$489,000
Investment Summary
- Monthly Cash Flow
- -$1,291
- Cap Rate
- 3.0%
- Cash-on-Cash Return
- -13.8%
- Debt Coverage Ratio
- 0.48
- Internal Rate of Return (5 years)
- -9.3%
Cash Flow
Net Operating Income (NOI) minus mortgage payments.
Calculation:
NOI - Mortgage Payments
Cap Rate (Market Value)
Capitalization Rate is a rate of return that compares the yearly Net Operating Income (NOI) to the market value.
Calculation:
NOI / Market Value
Cash-on-Cash Return (CoC)
Annual Cash Flow / Cash Invested
Calculation:
Annual cash flow divided by initial cash invested.
Debt Coverage Ratio (DCR)
Net Operating Income (NOI) divided by total debt payments.
Calculation:
NOI / Total Debt Payments
Internal Rate of Return (IRR)
A metric for assessing profitability over time. IRR is the discount rate at which the net present value (NPV) of all future cash flows (positive and negative) from an investment equals zero — including both periodic cash flow (such as rent) and a projected sale at the end of the holding period. It represents the expected annualized return, accounting for income, expenses, and the recovery of capital through a future sale.
Property Description
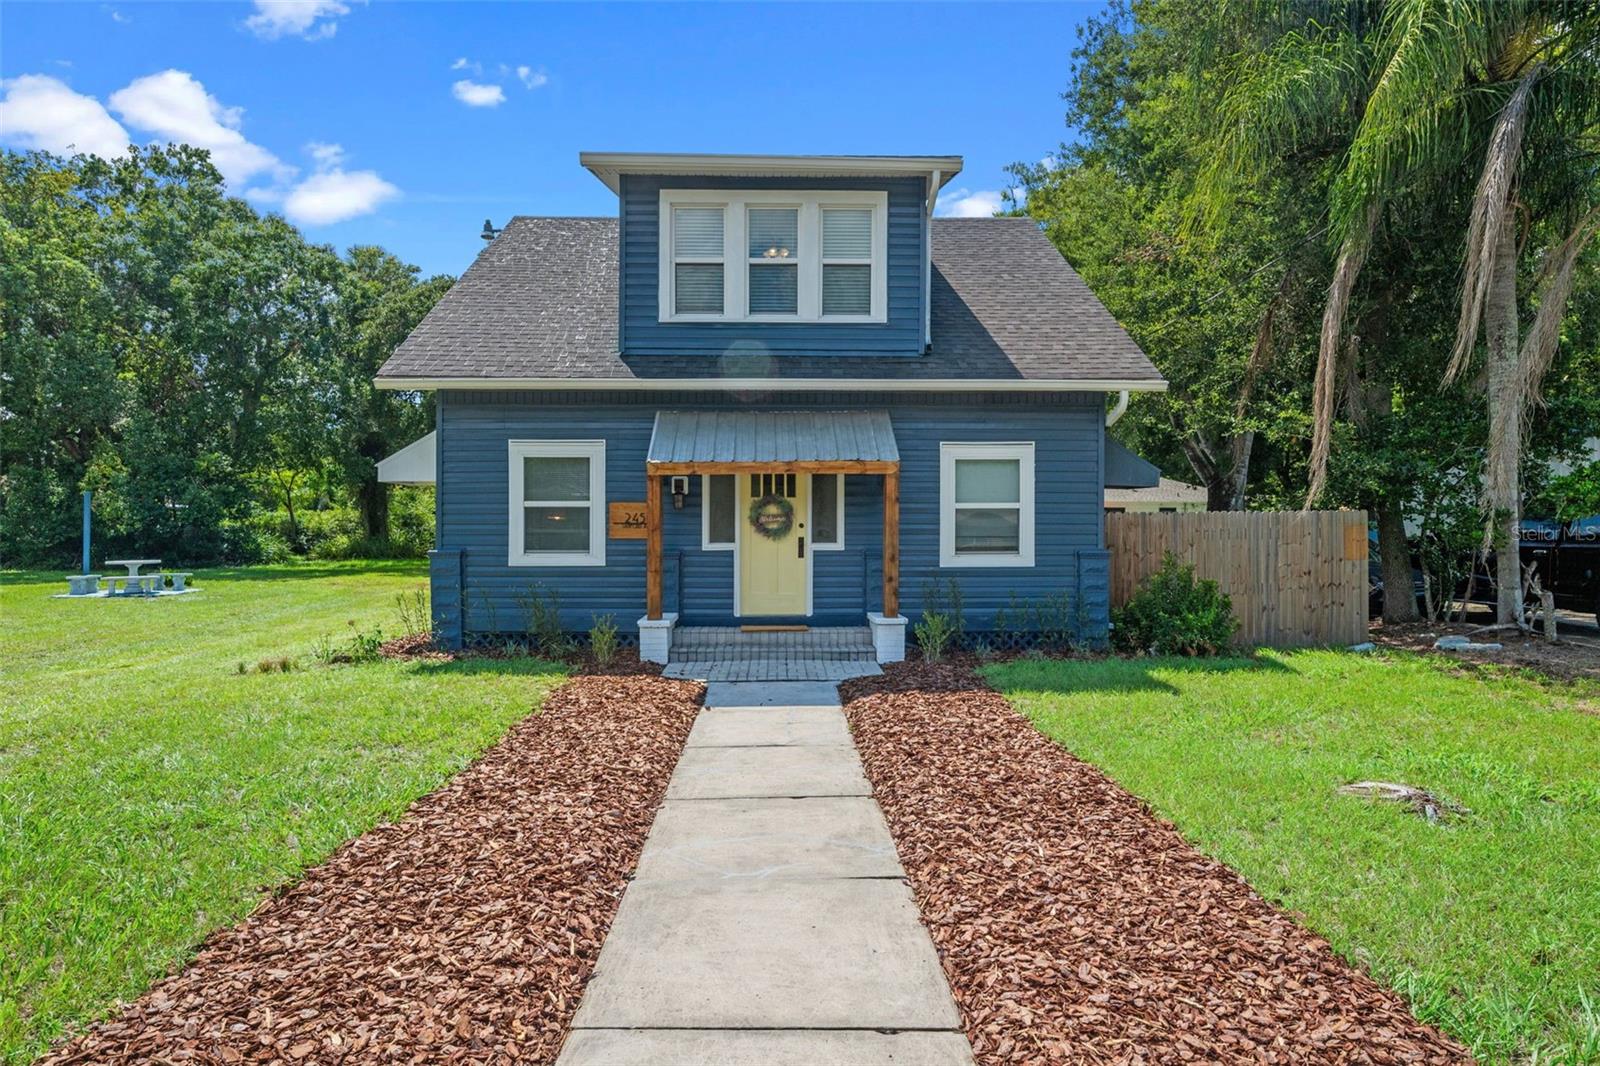
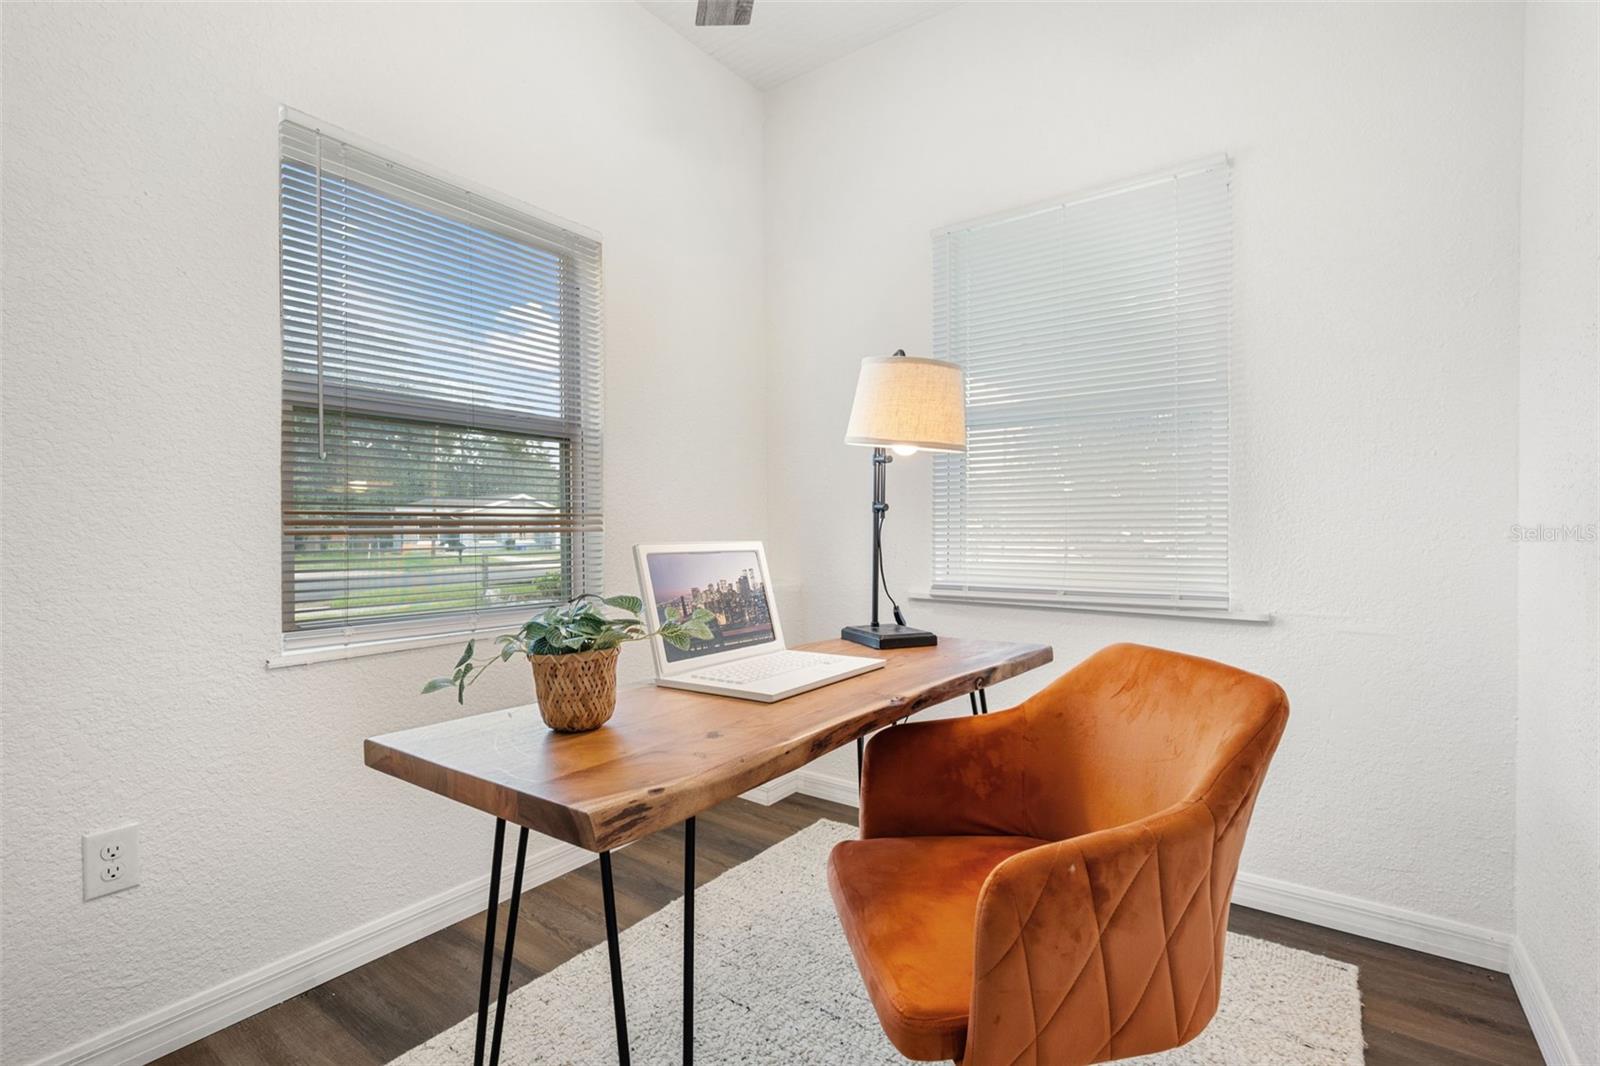
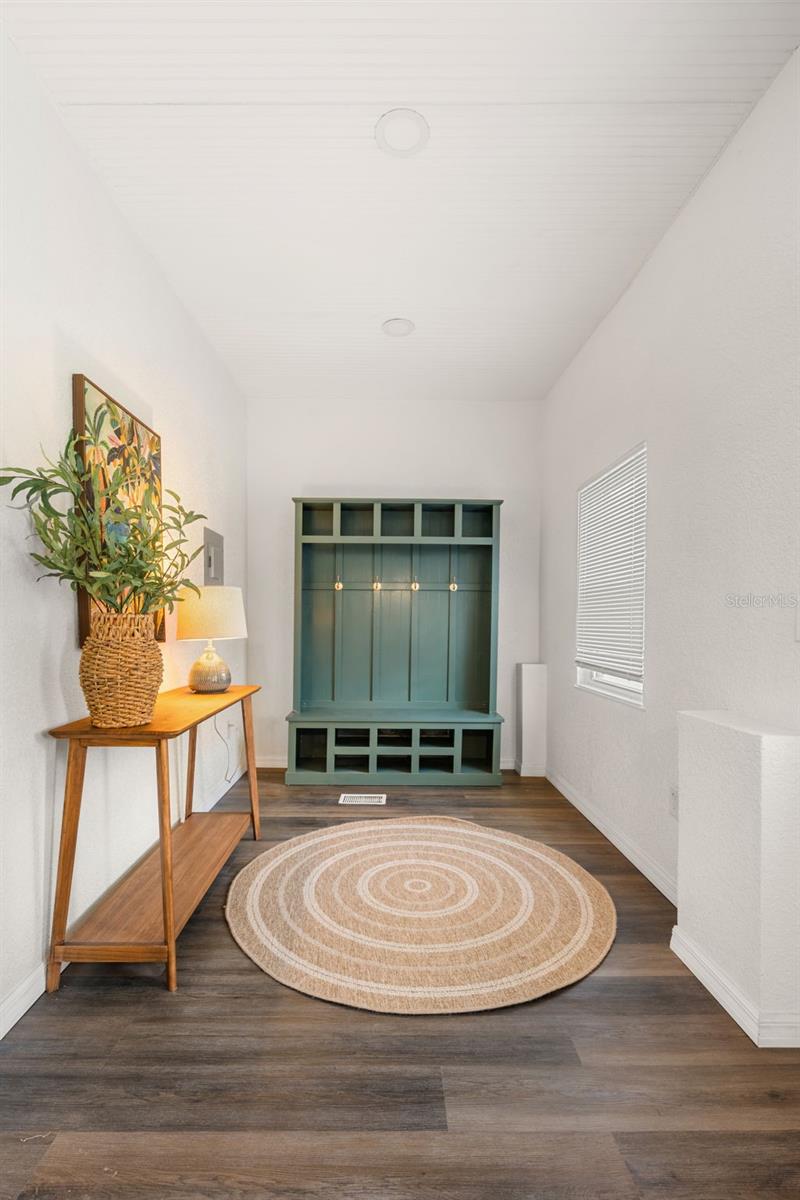
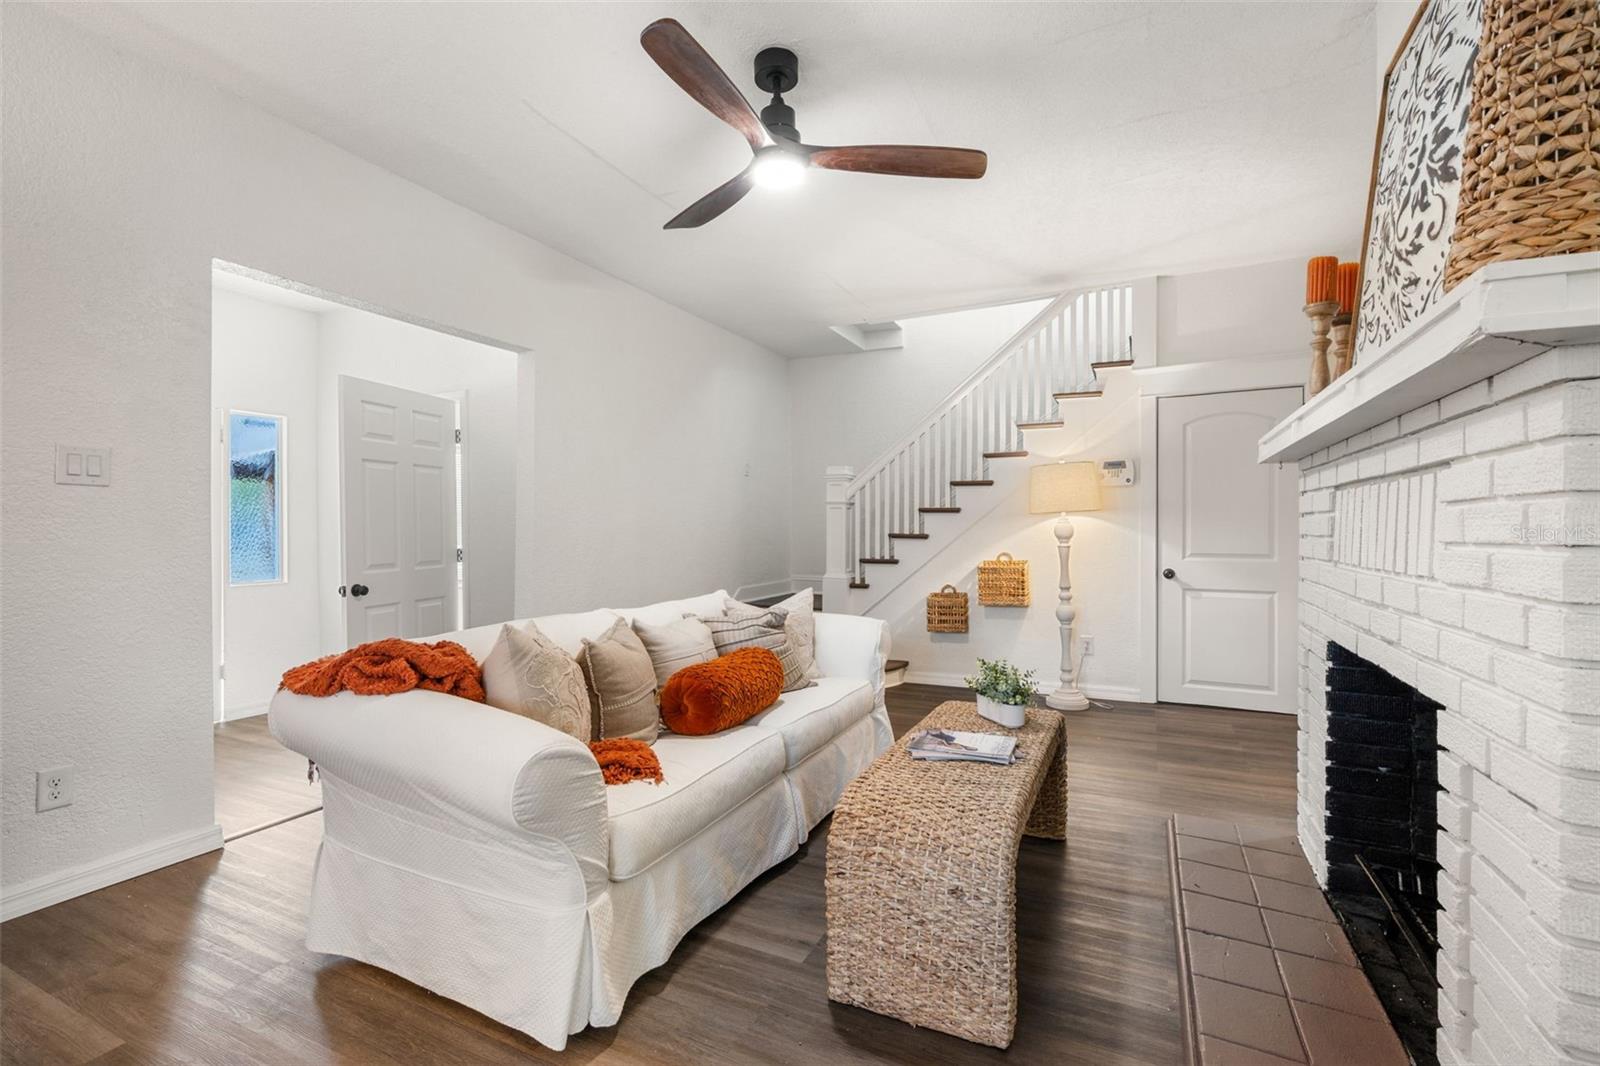
CHARACTER, CHARM, HISTORY & OPPORTUNITY in the HEART OF SANFORD! Step back in time and fall in love with this 1932 CHARMER that perfectly blends HISTORIC CHARACTER with thoughtful MODERN UPDATES. This three-bedroom, two-bathroom home sits proudly on an OVERSIZED LOT and offers not only WARMTH and CHARM but also rare flexibility with MIXED-USE ZONING and future DEVELOPMENT POTENTIAL. As you enter, you’re welcomed by a LIGHT-FILLED ENTRYWAY that can serve as a sunroom, drop zone, or cozy sitting nook—the perfect spot for your morning coffee. To the left, a charming door opens into a quiet OFFICE SPACE, ideal for working from home or curling up with a book. From there, step down into your spacious family room, anchored by a WOOD-BURNING FIREPLACE and filled with possibilities for entertaining, relaxing, or gathering with loved ones. Just off the living room is a hidden STORAGE NOOK/CLOSET tucked under the staircase with original wood shelving. Flowing seamlessly from the family room is the dining room, RICH WITH CHARACTER—STRIKING WALLPAPER, WOOD TRIM, and STYLISH LIGHT FIXTURE that feels right at home. The UPDATED KITCHEN is a true centerpiece, featuring QUARTZ COUNTERS, NEWER STAINLESS STEEL APPLIANCES, SUBWAY TILE BACKSPLASH, a LARGE PANTRY, and BREAKFAST BAR. —combining modern convenience with timeless detail. The PRIMARY SUITE, tucked away at the back of the home, is a private retreat with a WALK-IN closet, beautifully RENOVATED en suite with DUAL-HEAD WALK-IN SHOWER, and DIRECT ACCESS to the COVERED PORCH covered and OUTDOOR UTILITY ROOM. Upstairs, two additional bedrooms each feature WALK-IN CLOSETS and ABUNDANT NATURAL LIGHT, along with a cozy landing area currently used as a reading nook. The OVERSIZED FULL BATHROOM includes DUAL SINKS, a TUB/SHOWER COMBO, and GENEROUS LINEN CLOSET. Beyond the walls of this beautiful home lies the best of SANFORD LIVING—just minutes from HISTORIC DOWNTOWN Sanford’s brick-paved streets, charming shops, local dining, breweries, and the scenic riverfront where you can stroll, bike, kayak, and enjoy year-round festivals. But what makes this property TRULY UNIQUE is its MIXED-USE ZONING. Whether you’re looking for a PRIVATE RESIDENCE, PROFESSIONAL OFFICE, or SAMLL STOREFRONT, the possibilities are wide open. Approved uses include options such as a boutique-style retail, small offices, or other light commercial businesses—perfectly suited for transitional residential areas. Additionally, while Seminole County recognizes this as one parcel today, the property was originally platted as three separate lots. Though the city administratively combined them in the 1980’s, records still show the original lot configuration. Through the City of Sanford, a new owner can apply to subdivide the land back into three parcels—creating opportunities for multiple residences or mixed-use spaces. Whether you choose to enjoy this HISTORIC HOME AS-IS, REPURPOSE it for COMMERCIAL USE or EXPLORE SUBDIVISION and DEVELOPMENT POTENTIAL, this property is TRULY A ONE-OF-KIND OPPORTUNITY in the HEART OF SANFORD. Welcome home to history, charm, and endless possibilities! ROOF-2011, AC DOWNSTAIRS -2020, AC UPSTAIRS-2021, HOT WATER HEATER -2014, ELECTRICAL AND PLUMBING UPDATED. CALL YOUR AGENT TODAY FOR A TOUR!
Build Your Team
Quickly find investor-friendly professionals who can help you succeed in real estate investing at any stage of the investing journey.


Agents
Match with investor-friendly agents who can help you find, analyze, and close your next deal


Lenders
Get the best funding…find investor-friendly lenders who specialize in your deal strategy


Property Managers
Transition to passive investing. Find a trusted property management partnership that lasts.


Tax Pros & Accountants
Taxes and financial reporting made easy—find experts to create tax savings strategies, file taxes, and more
Location
Property Details
Parking
- Description: Carport
- Details: Oversized
- Garage Spaces: 0
- Spaces Total: 0
Bedroom Information
- # of Bedrooms: 3
Bathroom Information
- # of Baths (Full): 2
- # of Baths (Total): 2.0
Interior Features
- # of Rooms: 9
- # of Stories: 2
- Basement Description: Crawl Space
- Fireplace: Yes
Exterior Features
- Exterior Walls Materials: Siding (not specified)
- Roof Type: Gable
- Roof Material: Metal, Shingle
Land Information
- Land Use: Residential
- Land Use Subtype: Single Family Residential
Lot Information
- Parcel ID: 01203050600000220
- Lot Size: 18211 sqft
Property Information
- Property Type: Single Family Residence
- Year Built: 1932
Tax Information
- Annual Tax: $1,989
Utilities
- Water & Sewer: Public
- Heating: Central
- Cooling: Central Air
Location
- County: Seminole
Listing Details
Investment Summary
- Monthly Cash Flow
- -$1,291
- Cap Rate
- 3.0%
- Cash-on-Cash Return
- -13.8%
- Debt Coverage Ratio
- 0.48
- Internal Rate of Return (5 years)
- -9.3%
Cash Flow
Net Operating Income (NOI) minus mortgage payments.
Calculation:
NOI - Mortgage Payments
Cap Rate (Market Value)
Capitalization Rate is a rate of return that compares the yearly Net Operating Income (NOI) to the market value.
Calculation:
NOI / Market Value
Cash-on-Cash Return (CoC)
Annual Cash Flow / Cash Invested
Calculation:
Annual cash flow divided by initial cash invested.
Debt Coverage Ratio (DCR)
Net Operating Income (NOI) divided by total debt payments.
Calculation:
NOI / Total Debt Payments
Internal Rate of Return (IRR)
A metric for assessing profitability over time. IRR is the discount rate at which the net present value (NPV) of all future cash flows (positive and negative) from an investment equals zero — including both periodic cash flow (such as rent) and a projected sale at the end of the holding period. It represents the expected annualized return, accounting for income, expenses, and the recovery of capital through a future sale.
Purchase Details
Purchase PriceThe price paid for the property. Purchase price:
| $489,000 |
|---|---|
Amount FinancedThe amount of the purchase financed through a loan. Amount financed:
| -$391,200 |
Down paymentThe initial payment made towards the purchase. Down payment:
| $97,800 |
Closing CostsFees and expenses associated with purchasing a property, typically ranging from 2% to 5% of the home’s purchase price, paid at the end of a home purchase to cover services like lending, title transfer, and taxes. Closing costs:
| $14,670 |
Rehab CostsCosts incurred to repair or improve the property, including: roof, flooring, exterior siding, kitchen, exterior paint, bathrooms, etc. Rehab costs:
| $0 |
Initial Cash InvestedThe total initial cash invested in the property. Calculation:Down payment + Buying costs + Rehab costs Initial cash invested:
| $112,470 |
Square Feet (SQFT)The total square footage of the property. Square feet:
| 1,785 |
Cost Per Square FootCost per square foot of the property. Calculation:Purchase Price / Square Feet Cost per square foot:
| $274 |
Monthly Rent Per Square FootMonthly rent divided by the number of square feet. This ratio helps investors compare rental income efficiency across properties, markets, and unit sizes Calculation:Monthly Rent / Square Feet Monthly rent per square foot:
| $1.12 |
Financing Details
Loan AmountThe total sum of money borrowed from a lender to finance a property purchase. Calculation:Purchase Price - Down Payment
Loan amount:
| $391,200 |
|---|---|
Loan to Value Ratio (LTV)Loan amount divided by the market value of the property. Calculation:Loan Amount / Market Value
Loan to value ratio:
| 80.0% |
Loan TypeThe type of loan (e.g., fixed, adjustable).
Loan type:
| Amortizing |
TermThe loan repayment period in years.
Term:
| 30 years |
Interest RateThe percentage a lender charges on the borrowed amount of a loan, determining the cost of borrowing money.
Interest rate:
| 6.625% |
Principal & Interest (PI)The principal is the portion of the loan payment that reduces the loan balance. The interest is the lender's charge for borrowing money. Calculation:(P * r * (1 + r) ** n) / ((1 + r) ** n - 1) Where:
P = Loan amount (principal)
Principal & interest:
| $2,505 |
Property TaxesAnnual taxes levied by local governments on real estate properties. These taxes fund public services like schools, roads, and emergency services.
Property tax:
| $166 |
InsuranceThe costs for insurance coverage to protect against financial losses due to risks like fire, natural disasters, theft, liability, or tenant-related damages. Calculation:Assumes 7% of gross rental income, unless insurance rates are specified.
Insurance:
| $140 |
Private Mortgage Insurance (PMI)A fee that borrowers pay when they take out a conventional loan with a loan-to-value (LTV) ratio above 80%.
Private mortgage insurance (PMI):
| $0 |
Monthly PaymentThe fixed amount a borrower pays each month to repay a loan. It typically includes principal and interest (P&I) and may also cover property taxes, insurance, HOA fees, and PMI if escrowed. Monthly payment:
| $2,811 |
Operating Income
| % Rent | Monthly | Yearly | |
|---|---|---|---|
Gross RentThe total rental income received from tenants before deducting any expenses. Includes base rent, late fees, pet fees, parking fees, and other recurring charges.
Gross rent:
| $2,000 | $24,000 | |
Vacancy LossExpected loss of rent due to vacancies.
Vacancy loss:
(6%)
| 6% | -$120 | -$1,440 |
Operating IncomeGross rental income minus vacancy loss. Calculation:Gross rent - Vacancy loss
Operating income:
| $1,880 | $22,560 |
Operating Expenses
| % Rent | Monthly | Yearly | |
|---|---|---|---|
Property TaxesAnnual taxes levied by local governments on real estate properties. These taxes fund public services like schools, roads, and emergency services. | 8% | -$166 | -$1,990 |
InsuranceThe costs for insurance coverage to protect against financial losses due to risks like fire, natural disasters, theft, liability, or tenant-related damages. Calculation:Assumes 7% of gross rental income, unless insurance rates are specified. | 7% | -$140 | -$1,680 |
Property ManagementThe costs associated with hiring a property manager to handle the day-to-day operations of a rental property. Includes management fees, leasing fes, eviction fees, etc. Calculation:Assumes 8% of gross rental income. | 8% | -$160 | -$1,920 |
Repairs & MaintenanceOngoing costs for routine upkeep and minor fixes needed to keep a property in good working condition. Calculation:Assumes 5% of gross rental income. Varies by property age and condition. | 5% | -$100 | -$1,200 |
Capital ExpensesLarge, infrequent costs for major improvements or replacements, like a new roof, HVAC system, or appliances. Calculation:Assumes 5% of gross rental income. Varies by property age. | 5% | -$100 | -$1,200 |
HOA FeesRegular dues paid to a Homeowners Association for community maintenance, amenities, and management. Similar fees include: Condo Association Fees, Co-op Maintenance Fees, etc. | n/a | n/a | n/a |
Operating ExpensesRecurring costs required to maintain and manage a rental property, including property taxes, insurance, maintenance, repairs, utilities (if paid by the owner), property management fees, and other day-to-day expenses. Calculation:Insurance + Property Taxes + Property Management + Repairs & Maintenance + Capital Expenditures + HOA Fees | 33% | -$666 | -$7,990 |
Cash Flow
| Monthly | Yearly | |
|---|---|---|
Net Operating Income (NOI)The income generated from a property after deducting all operating expenses but before deducting mortgage payments, taxes, and capital expenditures. Calculation:Gross Operating Income - Operating Expenses
Net operating income:
| $1,214 | $14,568 |
Mortgage PaymentThe fixed amount a borrower pays each month to repay a loan. It typically includes principal and interest (P&I) and may also cover property taxes, insurance, HOA fees, and PMI if escrowed. | -$2,505 | -$30,060 |
Cash FlowNet Operating Income (NOI) minus mortgage payments. Calculation:NOI - Mortgage Payments | $1,291 | $15,492 |