$583,500
Investment Summary
- Monthly Cash Flow
- -$1,183
- Cap Rate
- 3.7%
- Cash-on-Cash Return
- -10.6%
- Debt Coverage Ratio
- 0.60
- Internal Rate of Return (5 years)
- -6.2%
Cash Flow
Net Operating Income (NOI) minus mortgage payments.
Calculation:
NOI - Mortgage Payments
Cap Rate (Market Value)
Capitalization Rate is a rate of return that compares the yearly Net Operating Income (NOI) to the market value.
Calculation:
NOI / Market Value
Cash-on-Cash Return (CoC)
Annual Cash Flow / Cash Invested
Calculation:
Annual cash flow divided by initial cash invested.
Debt Coverage Ratio (DCR)
Net Operating Income (NOI) divided by total debt payments.
Calculation:
NOI / Total Debt Payments
Internal Rate of Return (IRR)
A metric for assessing profitability over time. IRR is the discount rate at which the net present value (NPV) of all future cash flows (positive and negative) from an investment equals zero — including both periodic cash flow (such as rent) and a projected sale at the end of the holding period. It represents the expected annualized return, accounting for income, expenses, and the recovery of capital through a future sale.
Property Description
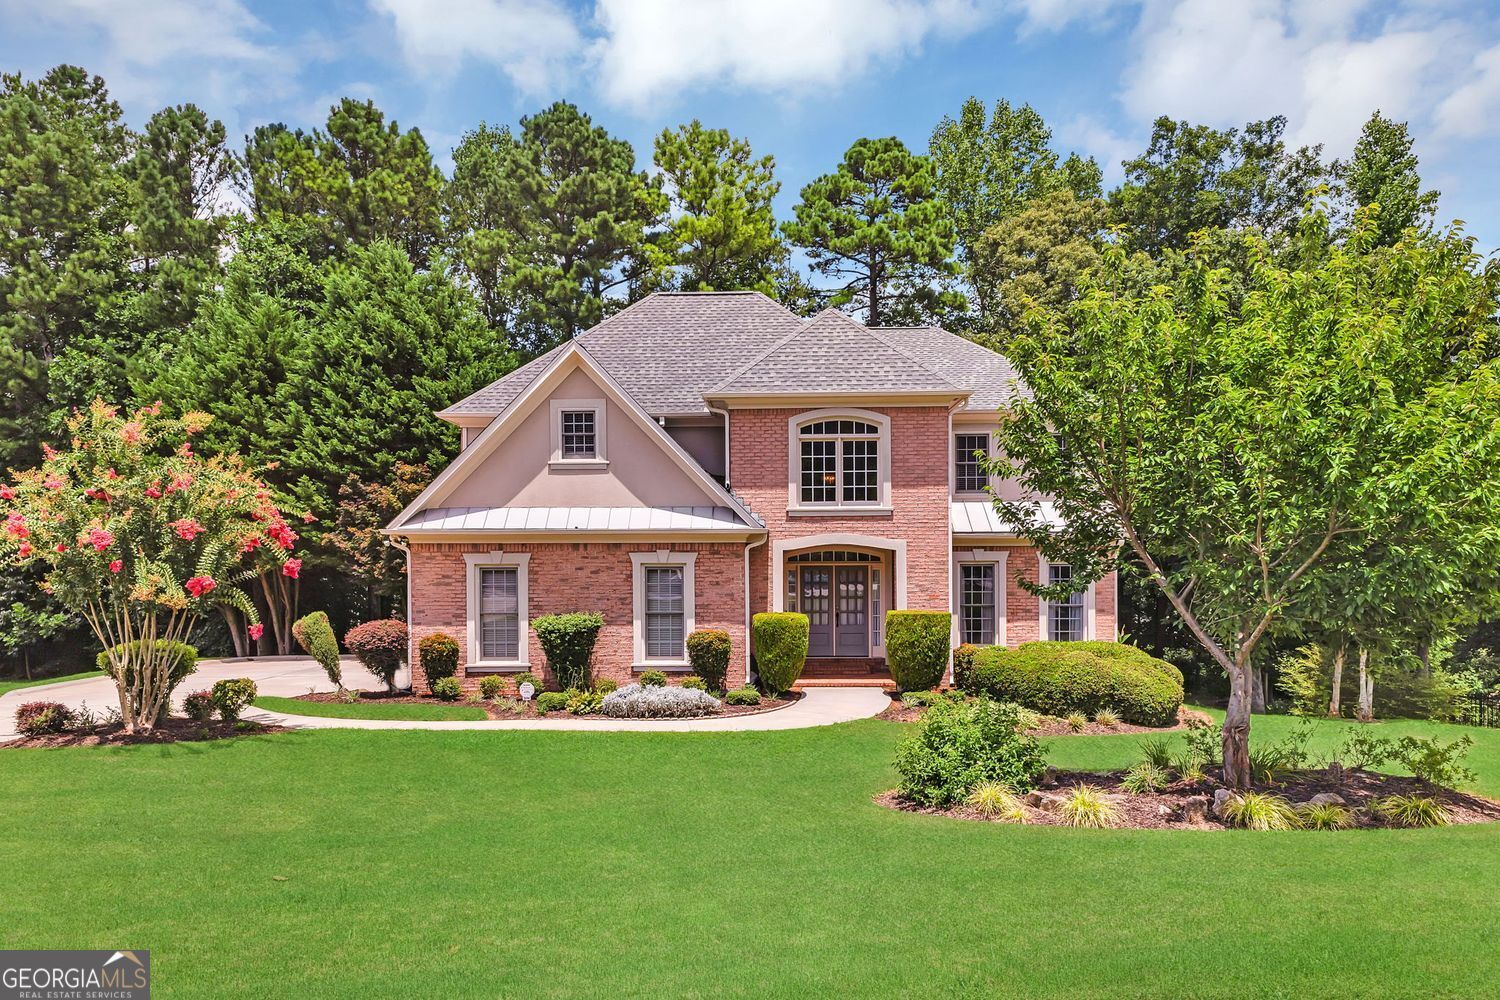
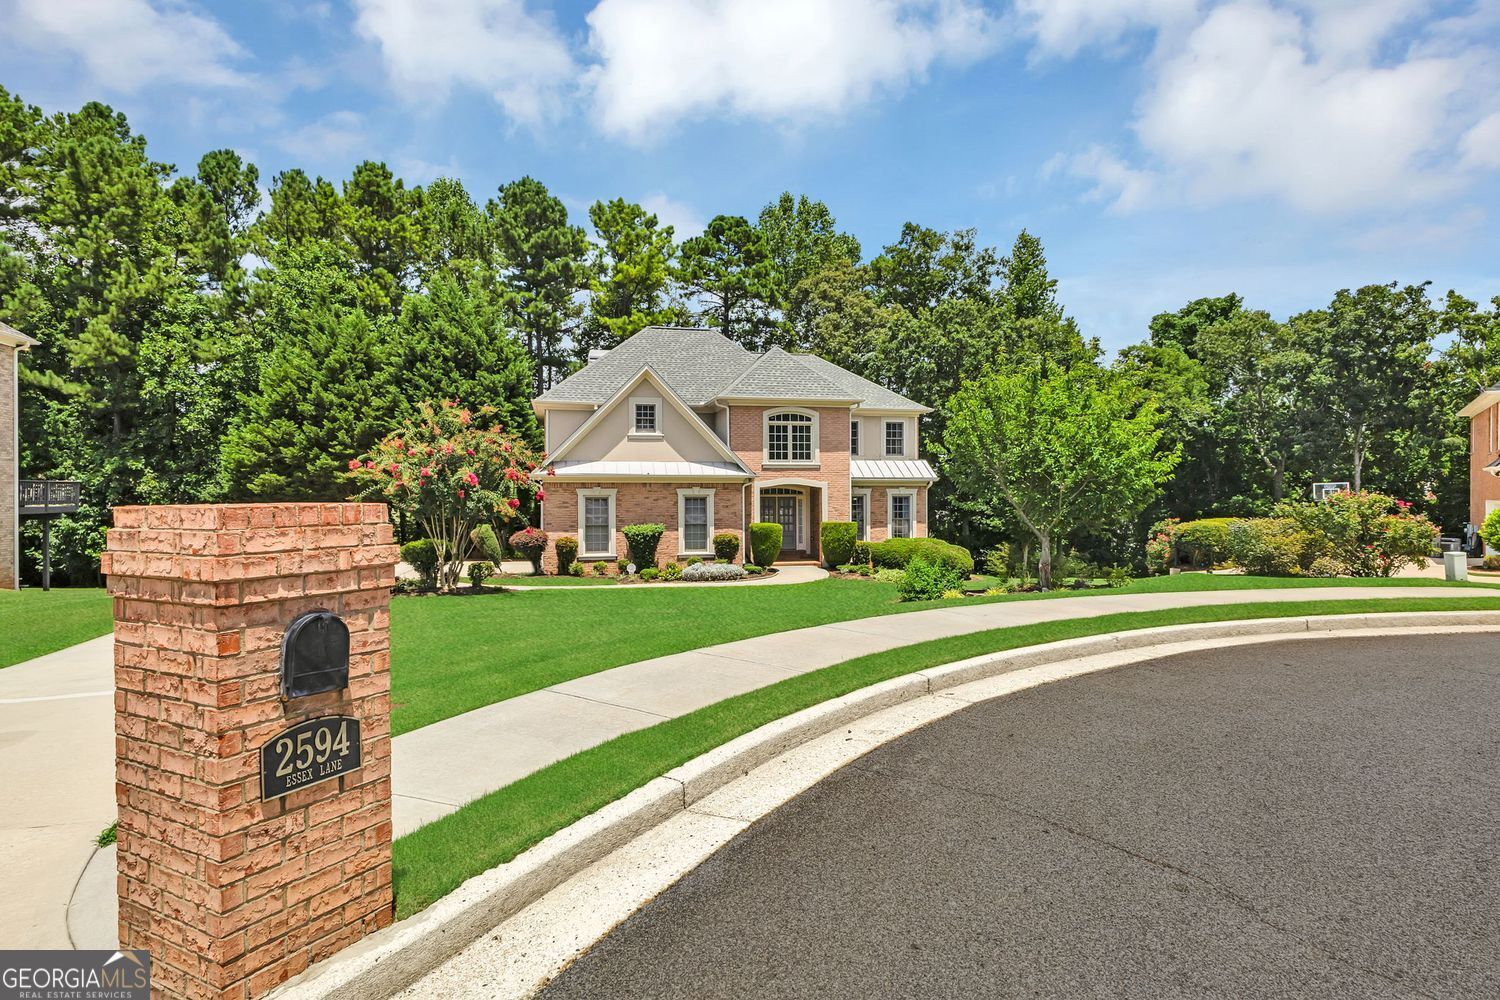
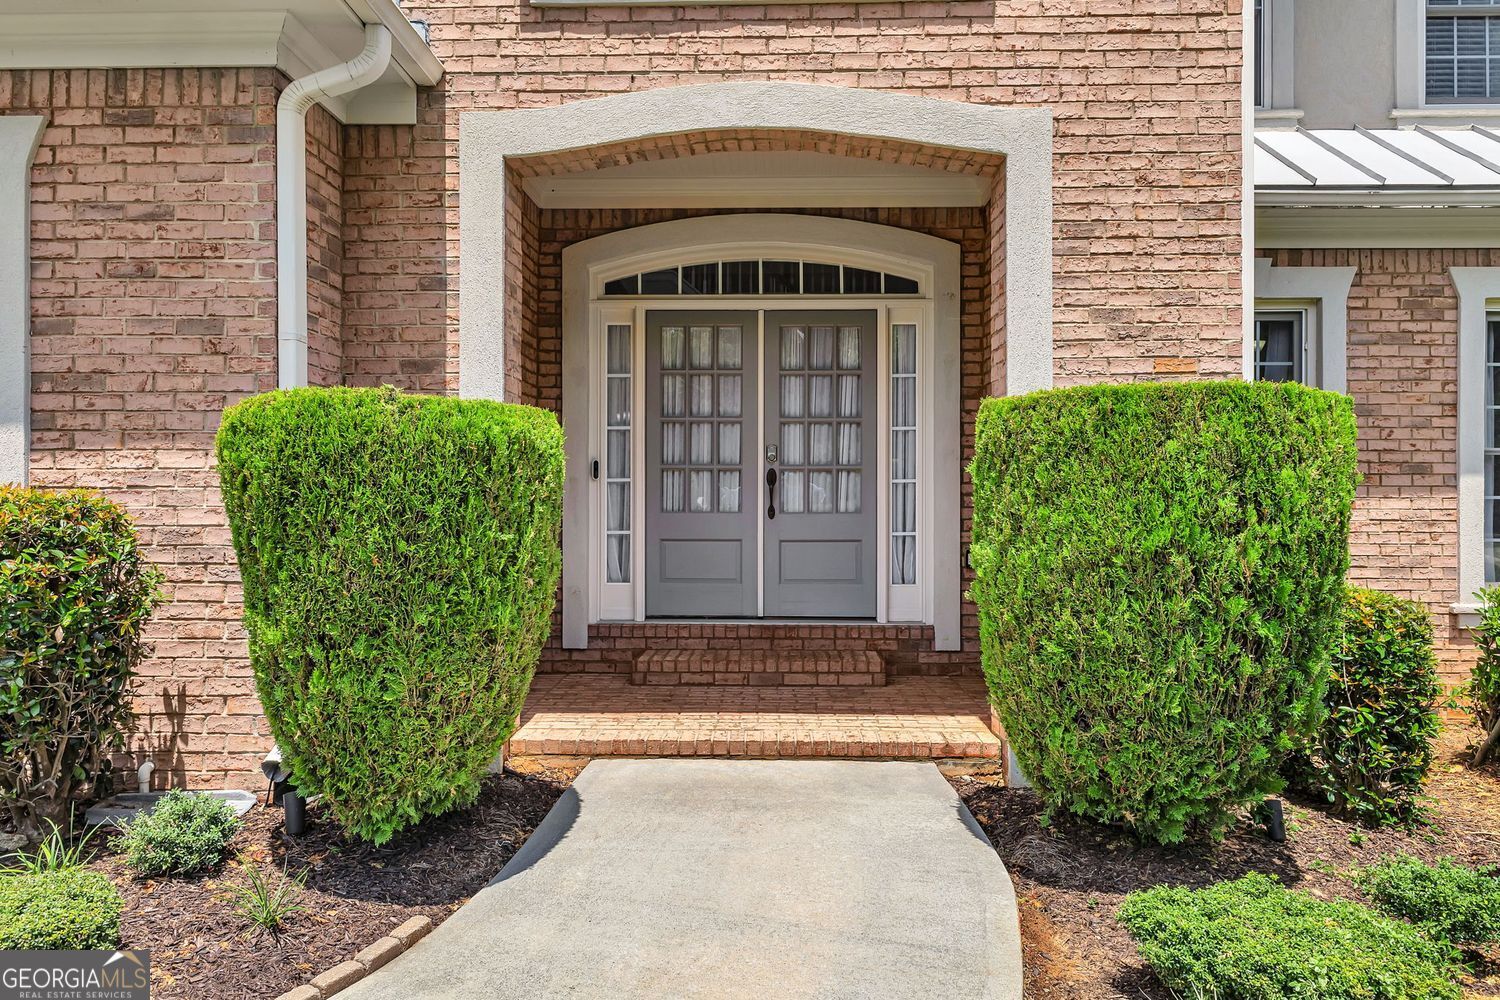
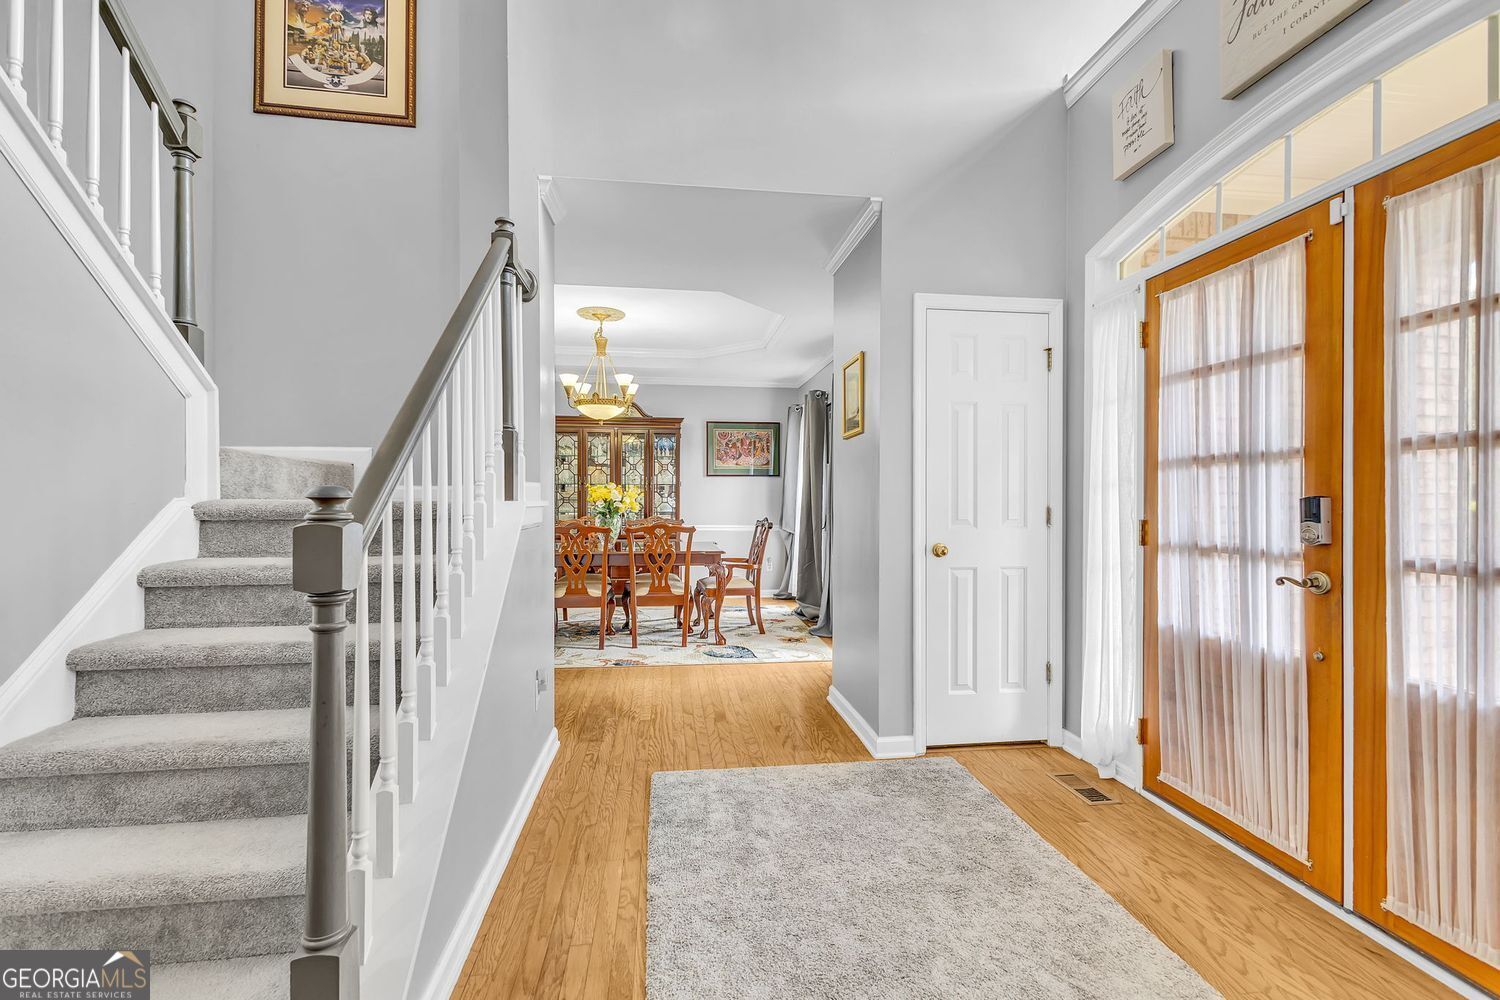
Welcome to a spectacular home, a perfect setting for family enjoyment.The open and bright interiors are flanked by gleaming hardwood floors. This exceptional home is a stunning masterpiece that showcases an impressive array of design elements. As you approach the residence, you are greeted by a beautifully manicured entrance that sets the tone for what lies beyond. The meticulous landscaping, accentuated by vibrant flowering trees and lush greenery, invites you to explore this sanctuary. Upon entering through the front entry, you are captivated by the soaring ceilings that embrace you with a sense of spaciousness and openness. The expansive foyer, bathed in natural light, serves as a warm welcome and transitions into the various living spaces, including a first-floor secondary bedroom currently being used as an office. The living areas are adorned with exquisite designer finishes. An inviting fireplace serves as the focal point in the great room, creating a cozy atmosphere perfect for those cooler evenings or unwinding after a long day. Large windows frame a picturesque view, allowing light to pour into the first floor from the outside. As you step into the home, you will find a gourmet kitchen equipped with top-of-the-line appliances and ample counter space, providing the perfect environment for preparing and enjoying delectable meals. The elegant cabinetry and luxurious finishes create a stunning backdrop, ready to inspire countless culinary adventures. An adjacent gracious-sized dining room offers the perfect setting for both family meals and festive dinner parties. The living experience continues as you explore the second floor of the home. The three generously sized bedrooms are havens of peace and tranquility, each designed to offer a retreat from the day's hustle and bustle. The primary suite, a true oasis, boasts a spa-inspired en-suite bathroom with luxurious finishes. Relax and rejuvenate in the expansive soaking tub or enjoy the shower, all designed to elevate your daily routine to new heights of indulgence. An added plus is the custom-designed closet, along with a spacious dressing room. Additionally, this magnificent property offers multiple spaces for leisure and entertainment, including a beautifully designed outdoor living area that seamlessly extends from the interior. Picture yourself hosting summer barbecues, cozying up around a fire pit on cool evenings, or simply soaking in the beauty of your surroundings in this serene outdoor retreat. The potential for creating unforgettable memories in this space is endless. This executive home offers a blend of luxury, functionality, and style. It presents an unparalleled opportunity for discerning buyers. This home is ready to embrace its new owners with open arms, promising many cherished memories for years to come in one of the area's sought-after communities.
Build Your Team
Quickly find investor-friendly professionals who can help you succeed in real estate investing at any stage of the investing journey.


Agents
Match with investor-friendly agents who can help you find, analyze, and close your next deal


Lenders
Get the best funding…find investor-friendly lenders who specialize in your deal strategy


Property Managers
Transition to passive investing. Find a trusted property management partnership that lasts.


Tax Pros & Accountants
Taxes and financial reporting made easy—find experts to create tax savings strategies, file taxes, and more
Location
Property Details
Parking
- Description: Assigned, Attached, Garage Door Opener, Garage, Kitchen Level, Side/Rear Entrance
- Details: Garage, Detached
- Garage Spaces: 4
- Spaces Total: 4
Bedroom Information
- # of Bedrooms: 5
Bathroom Information
- # of Baths (Full): 4
- # of Baths (Total): 4.0
Interior Features
- # of Rooms: 9
- # of Stories: 3
- Basement: Yes
- Basement Description: Daylight, Finished, Exterior Entry, Full, Interior Entry
- Fireplace: Yes
Exterior Features
- Exterior Walls Materials: Concrete
- Roof Material: Composition
HOA
- Has HOA: Yes
- HOA Fee: $850/annually
Land Information
- Land Use: Residential
- Land Use Subtype: Single Family Residential
Lot Information
- Parcel ID: 14F0095LL0507
- Lot Size: 0 sqft
Property Information
- Property Type: Single Family Residence
- Style: European
- Year Built: 2002
Tax Information
- Annual Tax: $6,456
Utilities
- Water & Sewer: Public
- Heating: Forced Air, Zoned
- Cooling: Dual, Zoned
Location
- County: Fulton
Listing Details
Investment Summary
- Monthly Cash Flow
- -$1,183
- Cap Rate
- 3.7%
- Cash-on-Cash Return
- -10.6%
- Debt Coverage Ratio
- 0.60
- Internal Rate of Return (5 years)
- -6.2%
Cash Flow
Net Operating Income (NOI) minus mortgage payments.
Calculation:
NOI - Mortgage Payments
Cap Rate (Market Value)
Capitalization Rate is a rate of return that compares the yearly Net Operating Income (NOI) to the market value.
Calculation:
NOI / Market Value
Cash-on-Cash Return (CoC)
Annual Cash Flow / Cash Invested
Calculation:
Annual cash flow divided by initial cash invested.
Debt Coverage Ratio (DCR)
Net Operating Income (NOI) divided by total debt payments.
Calculation:
NOI / Total Debt Payments
Internal Rate of Return (IRR)
A metric for assessing profitability over time. IRR is the discount rate at which the net present value (NPV) of all future cash flows (positive and negative) from an investment equals zero — including both periodic cash flow (such as rent) and a projected sale at the end of the holding period. It represents the expected annualized return, accounting for income, expenses, and the recovery of capital through a future sale.
Purchase Details
Purchase PriceThe price paid for the property. Purchase price:
| $583,500 |
|---|---|
Amount FinancedThe amount of the purchase financed through a loan. Amount financed:
| -$466,800 |
Down paymentThe initial payment made towards the purchase. Down payment:
| $116,700 |
Closing CostsFees and expenses associated with purchasing a property, typically ranging from 2% to 5% of the home’s purchase price, paid at the end of a home purchase to cover services like lending, title transfer, and taxes. Closing costs:
| $17,505 |
Rehab CostsCosts incurred to repair or improve the property, including: roof, flooring, exterior siding, kitchen, exterior paint, bathrooms, etc. Rehab costs:
| $0 |
Initial Cash InvestedThe total initial cash invested in the property. Calculation:Down payment + Buying costs + Rehab costs Initial cash invested:
| $134,205 |
Square Feet (SQFT)The total square footage of the property. Square feet:
| 3,699 |
Cost Per Square FootCost per square foot of the property. Calculation:Purchase Price / Square Feet Cost per square foot:
| $158 |
Monthly Rent Per Square FootMonthly rent divided by the number of square feet. This ratio helps investors compare rental income efficiency across properties, markets, and unit sizes Calculation:Monthly Rent / Square Feet Monthly rent per square foot:
| $0.95 |
Financing Details
Loan AmountThe total sum of money borrowed from a lender to finance a property purchase. Calculation:Purchase Price - Down Payment
Loan amount:
| $466,800 |
|---|---|
Loan to Value Ratio (LTV)Loan amount divided by the market value of the property. Calculation:Loan Amount / Market Value
Loan to value ratio:
| 80.0% |
Loan TypeThe type of loan (e.g., fixed, adjustable).
Loan type:
| Amortizing |
TermThe loan repayment period in years.
Term:
| 30 years |
Interest RateThe percentage a lender charges on the borrowed amount of a loan, determining the cost of borrowing money.
Interest rate:
| 6.625% |
Principal & Interest (PI)The principal is the portion of the loan payment that reduces the loan balance. The interest is the lender's charge for borrowing money. Calculation:(P * r * (1 + r) ** n) / ((1 + r) ** n - 1) Where:
P = Loan amount (principal)
Principal & interest:
| $2,989 |
Property TaxesAnnual taxes levied by local governments on real estate properties. These taxes fund public services like schools, roads, and emergency services.
Property tax:
| $538 |
InsuranceThe costs for insurance coverage to protect against financial losses due to risks like fire, natural disasters, theft, liability, or tenant-related damages. Calculation:Assumes 7% of gross rental income, unless insurance rates are specified.
Insurance:
| $245 |
Private Mortgage Insurance (PMI)A fee that borrowers pay when they take out a conventional loan with a loan-to-value (LTV) ratio above 80%.
Private mortgage insurance (PMI):
| $0 |
Monthly PaymentThe fixed amount a borrower pays each month to repay a loan. It typically includes principal and interest (P&I) and may also cover property taxes, insurance, HOA fees, and PMI if escrowed. Monthly payment:
| $3,772 |
Operating Income
| % Rent | Monthly | Yearly | |
|---|---|---|---|
Gross RentThe total rental income received from tenants before deducting any expenses. Includes base rent, late fees, pet fees, parking fees, and other recurring charges.
Gross rent:
| $3,500 | $42,000 | |
Vacancy LossExpected loss of rent due to vacancies.
Vacancy loss:
(6%)
| 6% | -$210 | -$2,520 |
Operating IncomeGross rental income minus vacancy loss. Calculation:Gross rent - Vacancy loss
Operating income:
| $3,290 | $39,480 |
Operating Expenses
| % Rent | Monthly | Yearly | |
|---|---|---|---|
Property TaxesAnnual taxes levied by local governments on real estate properties. These taxes fund public services like schools, roads, and emergency services. | 15% | -$538 | -$6,456 |
InsuranceThe costs for insurance coverage to protect against financial losses due to risks like fire, natural disasters, theft, liability, or tenant-related damages. Calculation:Assumes 7% of gross rental income, unless insurance rates are specified. | 7% | -$245 | -$2,940 |
Property ManagementThe costs associated with hiring a property manager to handle the day-to-day operations of a rental property. Includes management fees, leasing fes, eviction fees, etc. Calculation:Assumes 8% of gross rental income. | 8% | -$280 | -$3,360 |
Repairs & MaintenanceOngoing costs for routine upkeep and minor fixes needed to keep a property in good working condition. Calculation:Assumes 5% of gross rental income. Varies by property age and condition. | 5% | -$175 | -$2,100 |
Capital ExpensesLarge, infrequent costs for major improvements or replacements, like a new roof, HVAC system, or appliances. Calculation:Assumes 5% of gross rental income. Varies by property age. | 5% | -$175 | -$2,100 |
HOA FeesRegular dues paid to a Homeowners Association for community maintenance, amenities, and management. Similar fees include: Condo Association Fees, Co-op Maintenance Fees, etc. | 2% | -$71 | -$852 |
Operating ExpensesRecurring costs required to maintain and manage a rental property, including property taxes, insurance, maintenance, repairs, utilities (if paid by the owner), property management fees, and other day-to-day expenses. Calculation:Insurance + Property Taxes + Property Management + Repairs & Maintenance + Capital Expenditures + HOA Fees | 42% | -$1,484 | -$17,808 |
Cash Flow
| Monthly | Yearly | |
|---|---|---|
Net Operating Income (NOI)The income generated from a property after deducting all operating expenses but before deducting mortgage payments, taxes, and capital expenditures. Calculation:Gross Operating Income - Operating Expenses
Net operating income:
| $1,806 | $21,672 |
Mortgage PaymentThe fixed amount a borrower pays each month to repay a loan. It typically includes principal and interest (P&I) and may also cover property taxes, insurance, HOA fees, and PMI if escrowed. | -$2,989 | -$35,868 |
Cash FlowNet Operating Income (NOI) minus mortgage payments. Calculation:NOI - Mortgage Payments | -$1,183 | -$14,196 |