$1,250,000
Investment Summary
- Monthly Cash Flow
- -$4,296
- Cap Rate
- 1.9%
- Cash-on-Cash Return
- -17.9%
- Debt Coverage Ratio
- 0.32
- Internal Rate of Return (5 years)
- -13.3%
Cash Flow
Net Operating Income (NOI) minus mortgage payments.
Calculation:
NOI - Mortgage Payments
Cap Rate (Market Value)
Capitalization Rate is a rate of return that compares the yearly Net Operating Income (NOI) to the market value.
Calculation:
NOI / Market Value
Cash-on-Cash Return (CoC)
Annual Cash Flow / Cash Invested
Calculation:
Annual cash flow divided by initial cash invested.
Debt Coverage Ratio (DCR)
Net Operating Income (NOI) divided by total debt payments.
Calculation:
NOI / Total Debt Payments
Internal Rate of Return (IRR)
A metric for assessing profitability over time. IRR is the discount rate at which the net present value (NPV) of all future cash flows (positive and negative) from an investment equals zero — including both periodic cash flow (such as rent) and a projected sale at the end of the holding period. It represents the expected annualized return, accounting for income, expenses, and the recovery of capital through a future sale.
Property Description
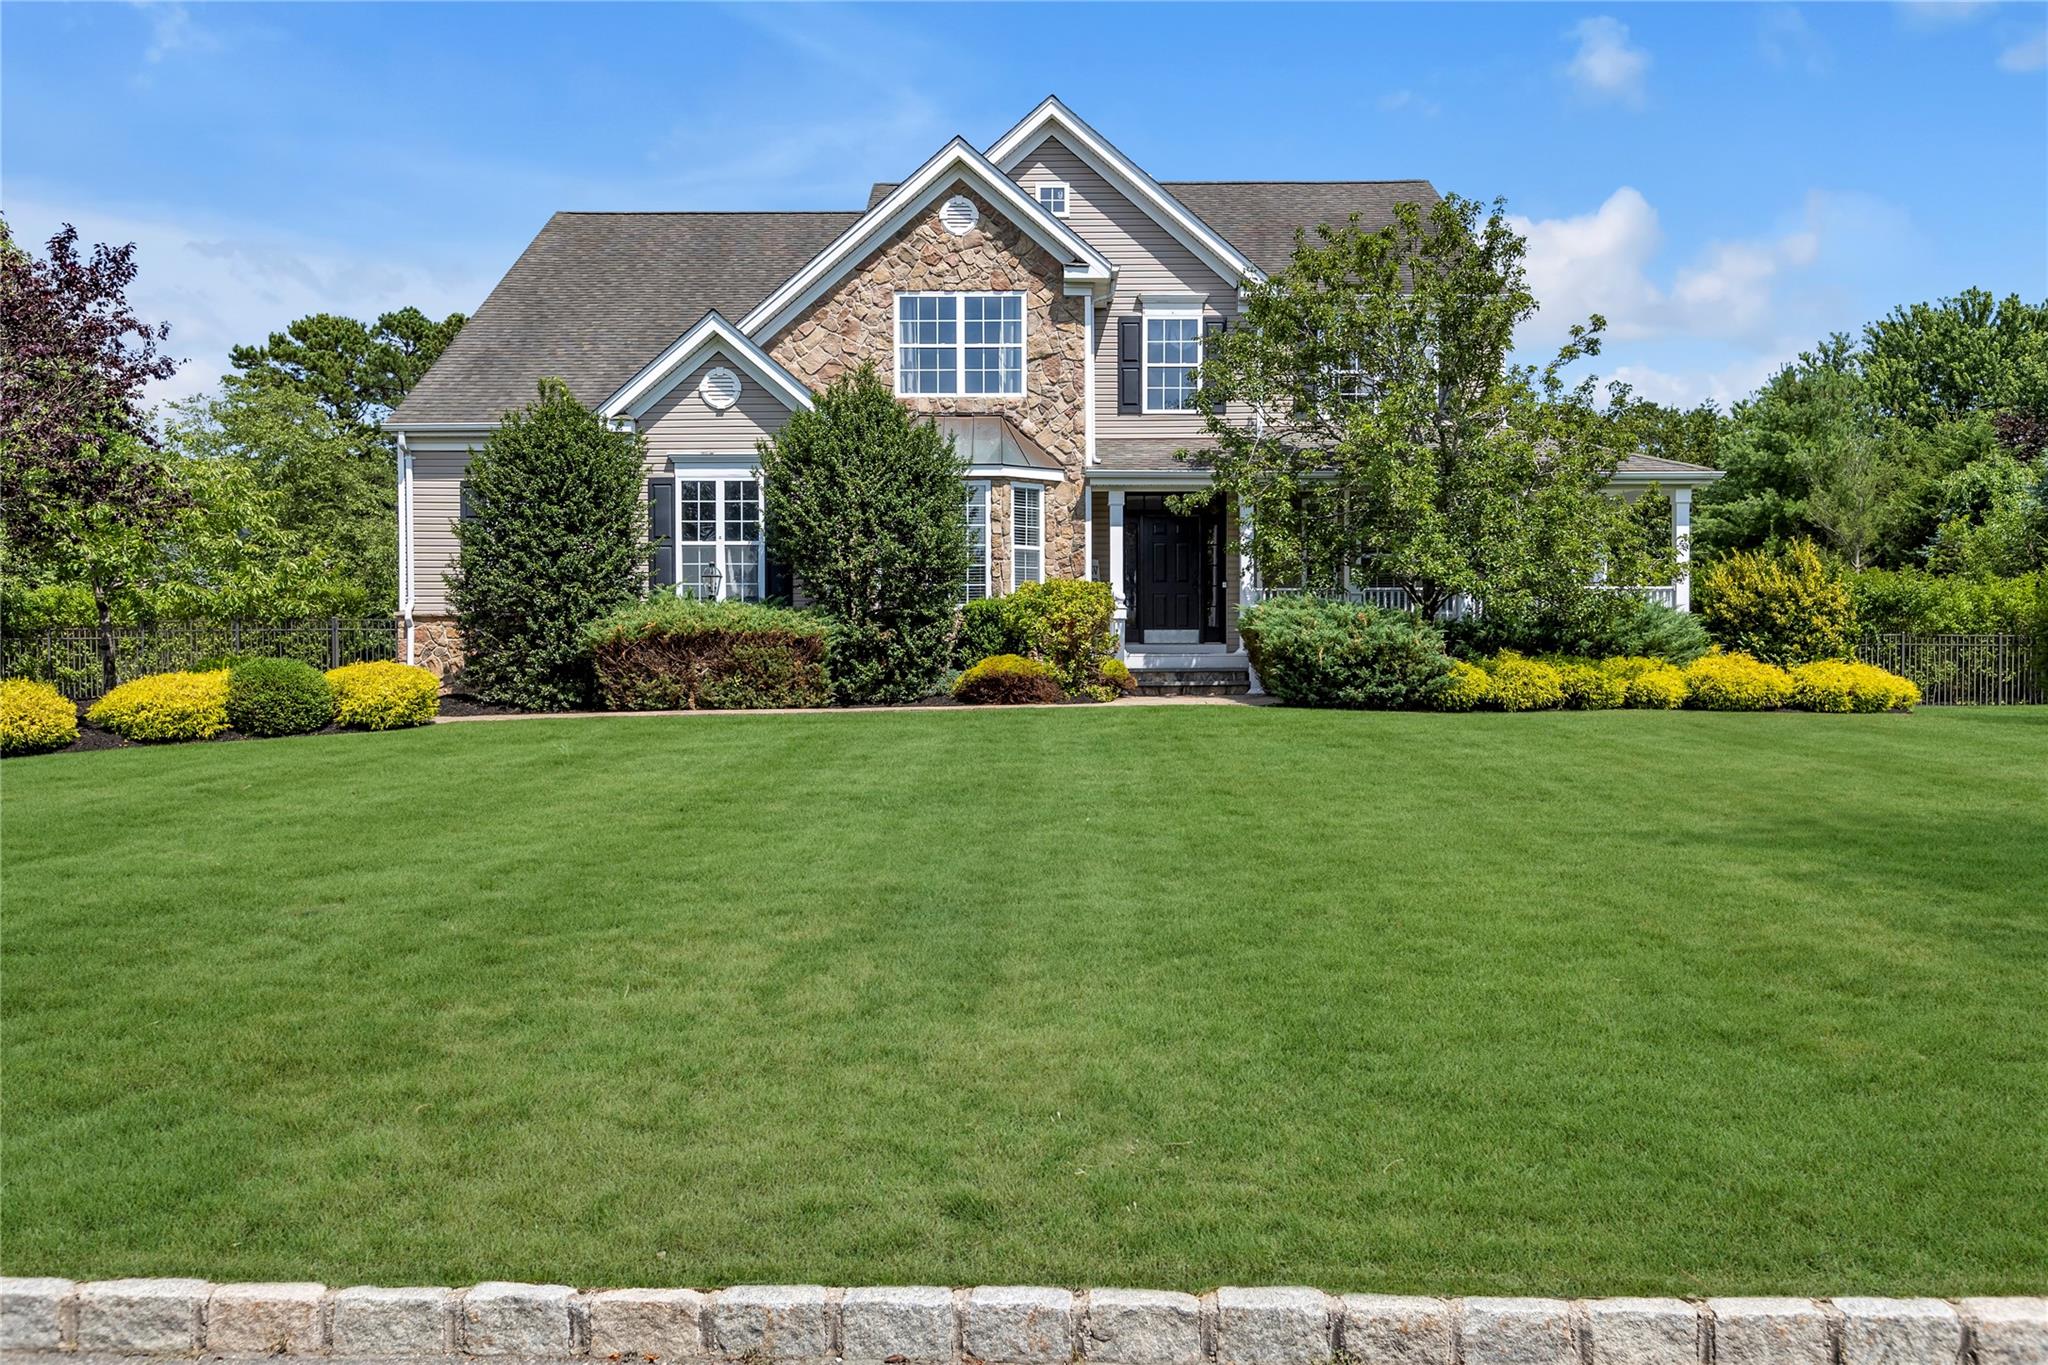
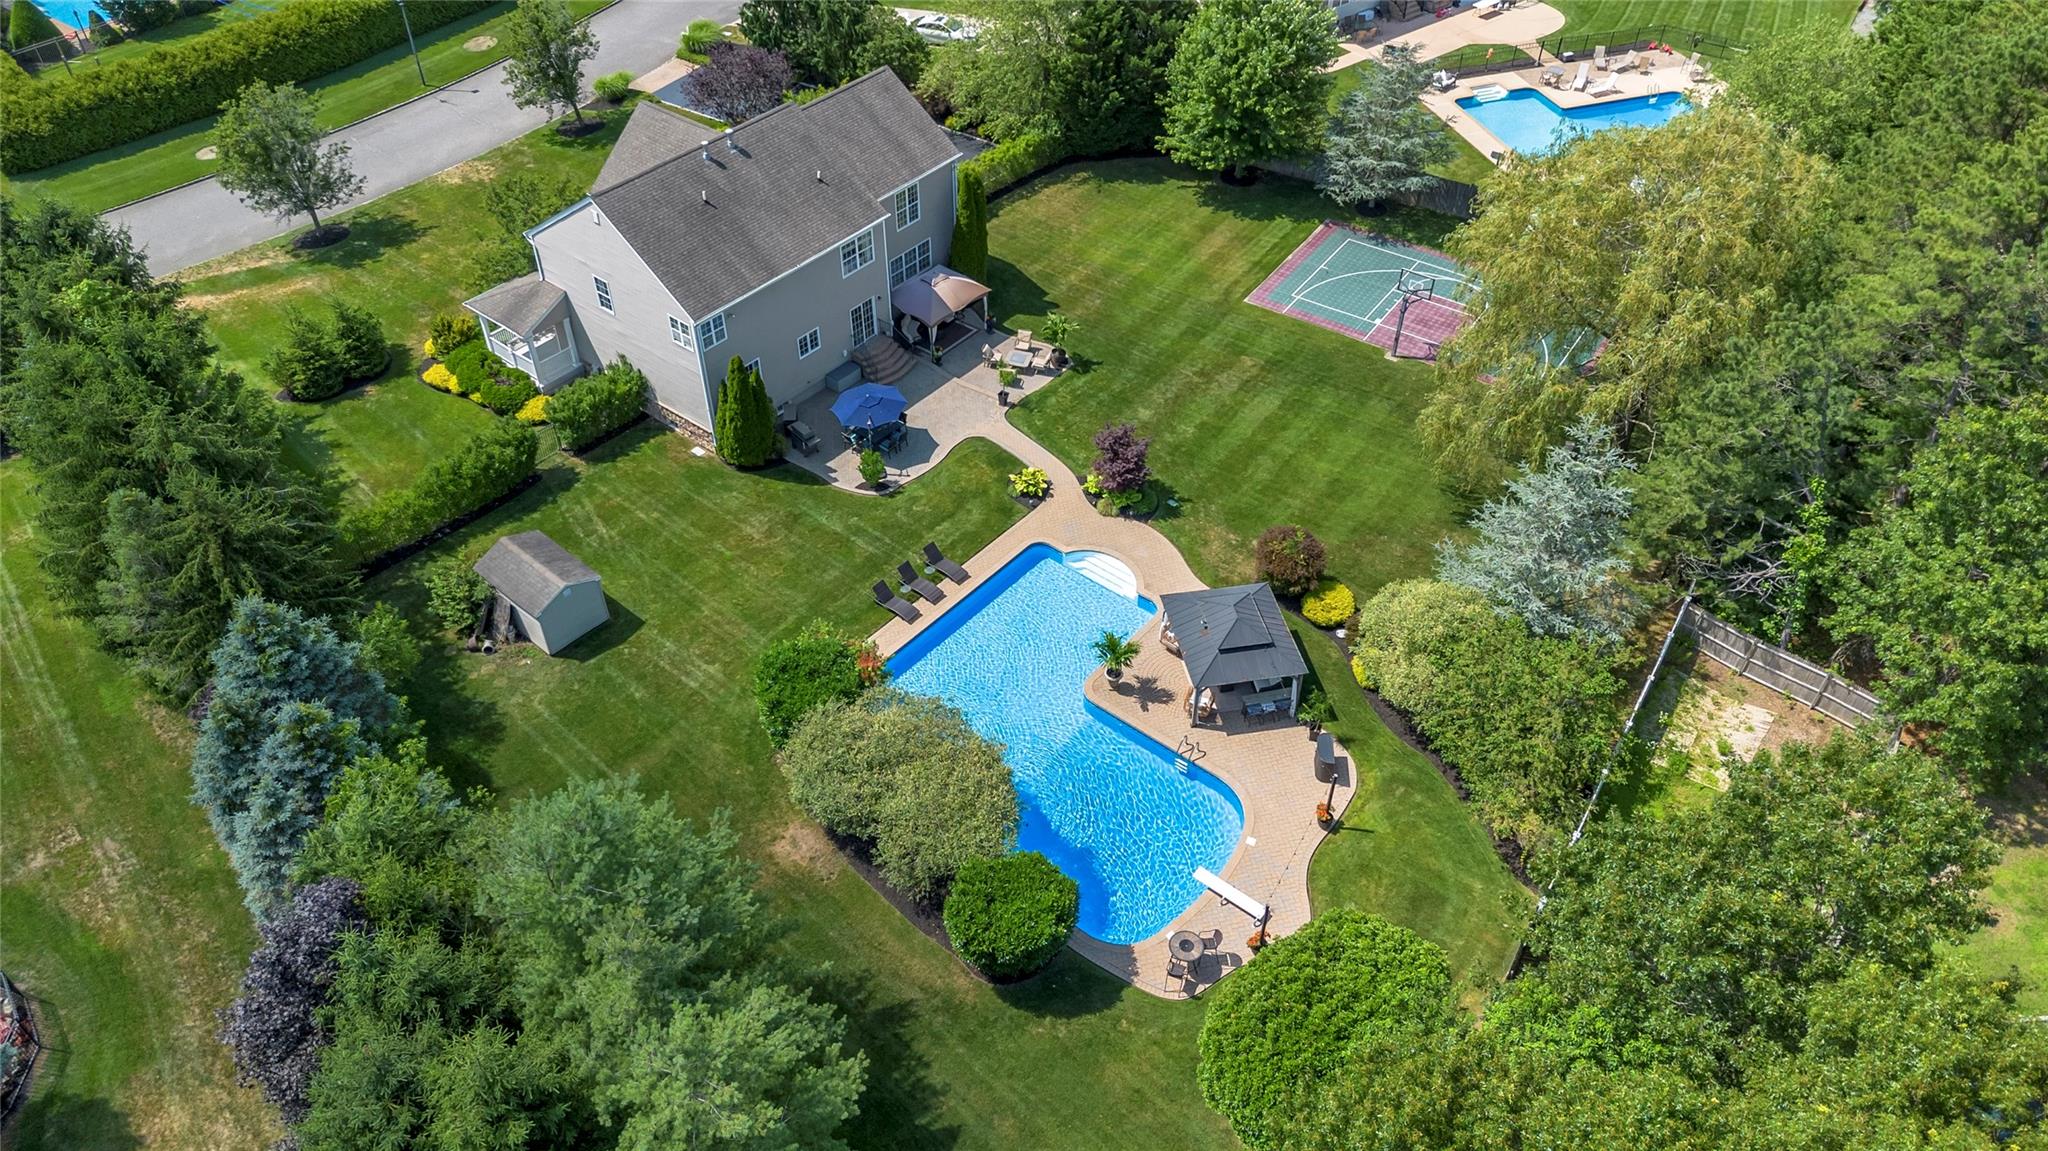
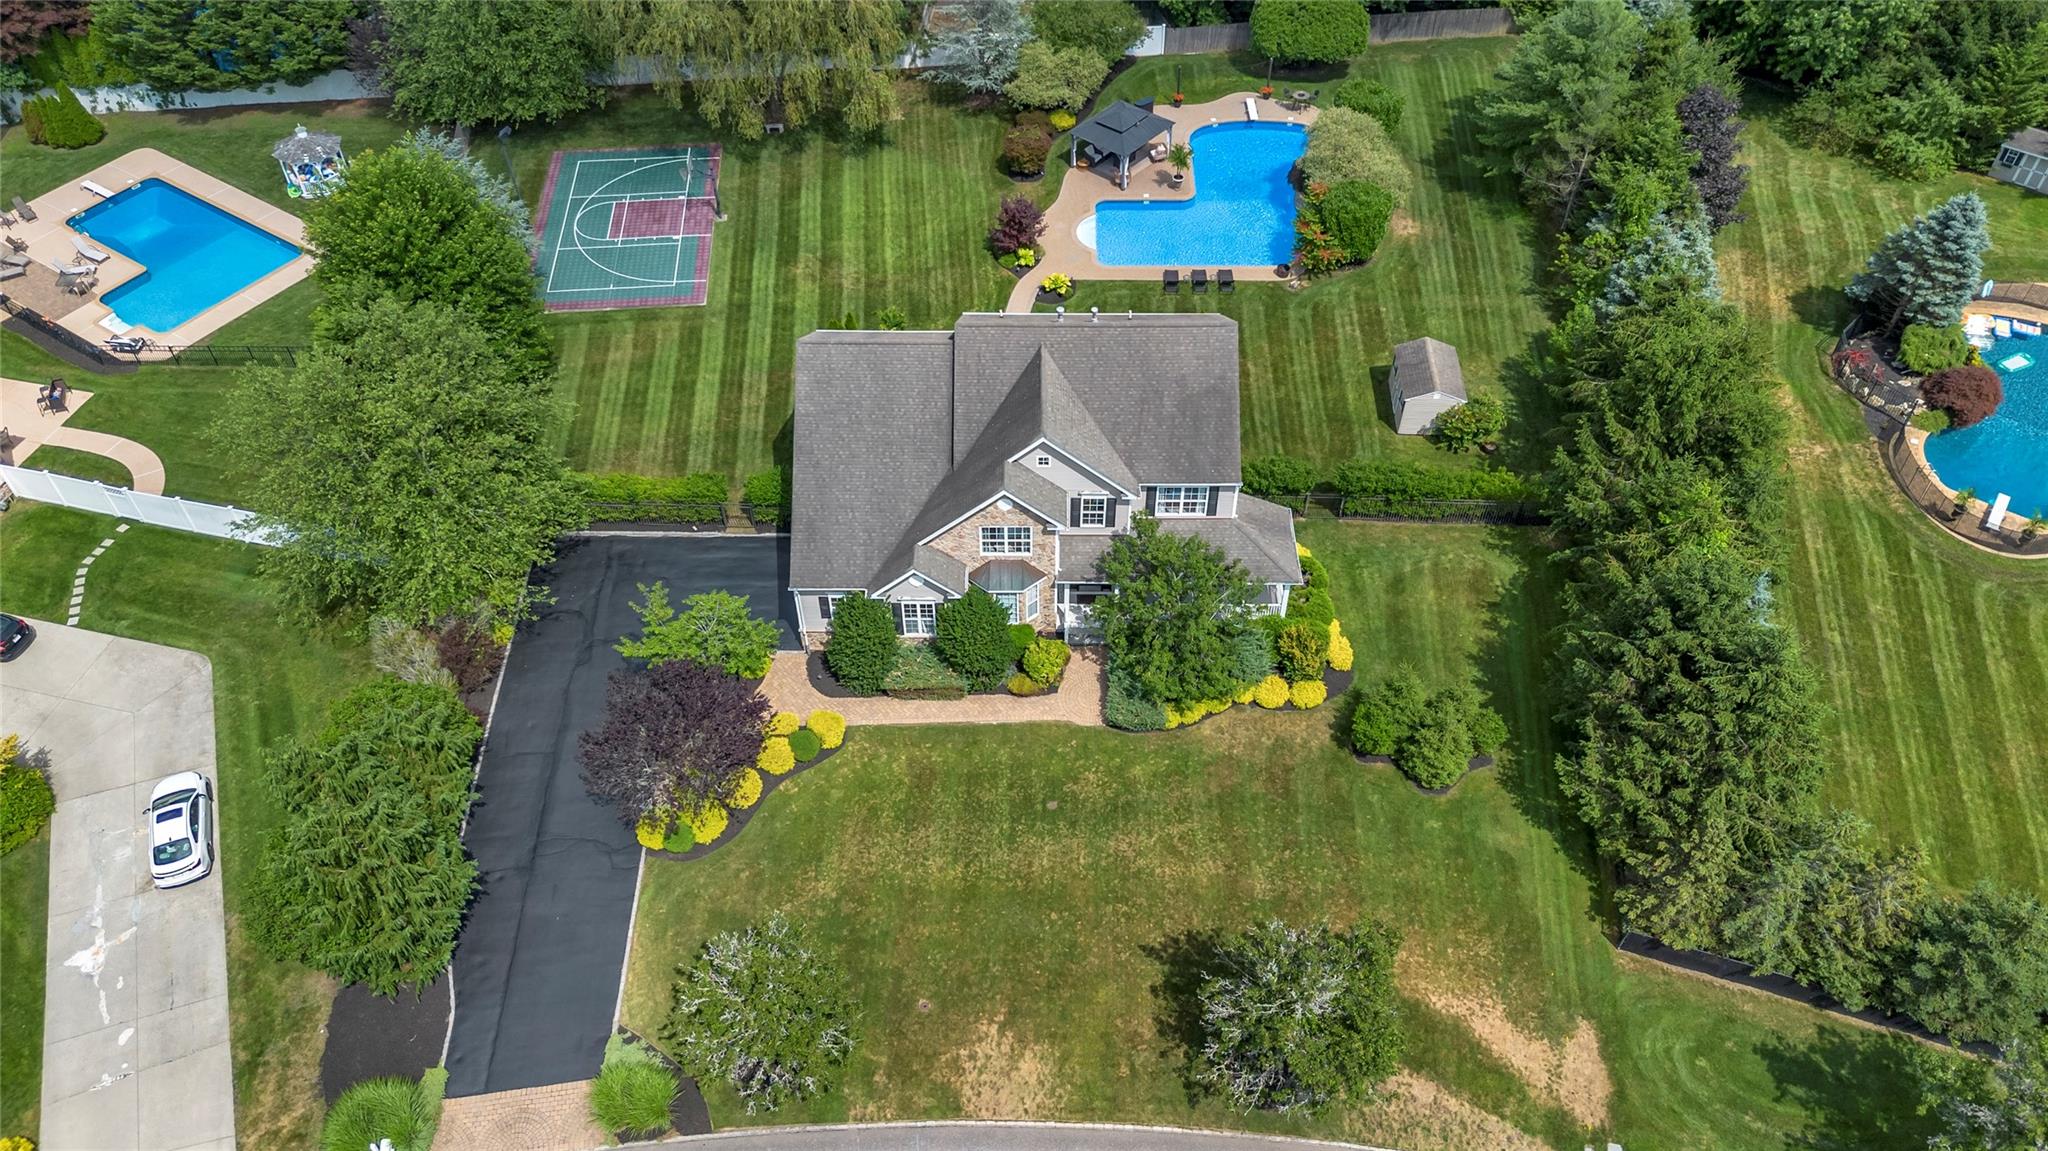
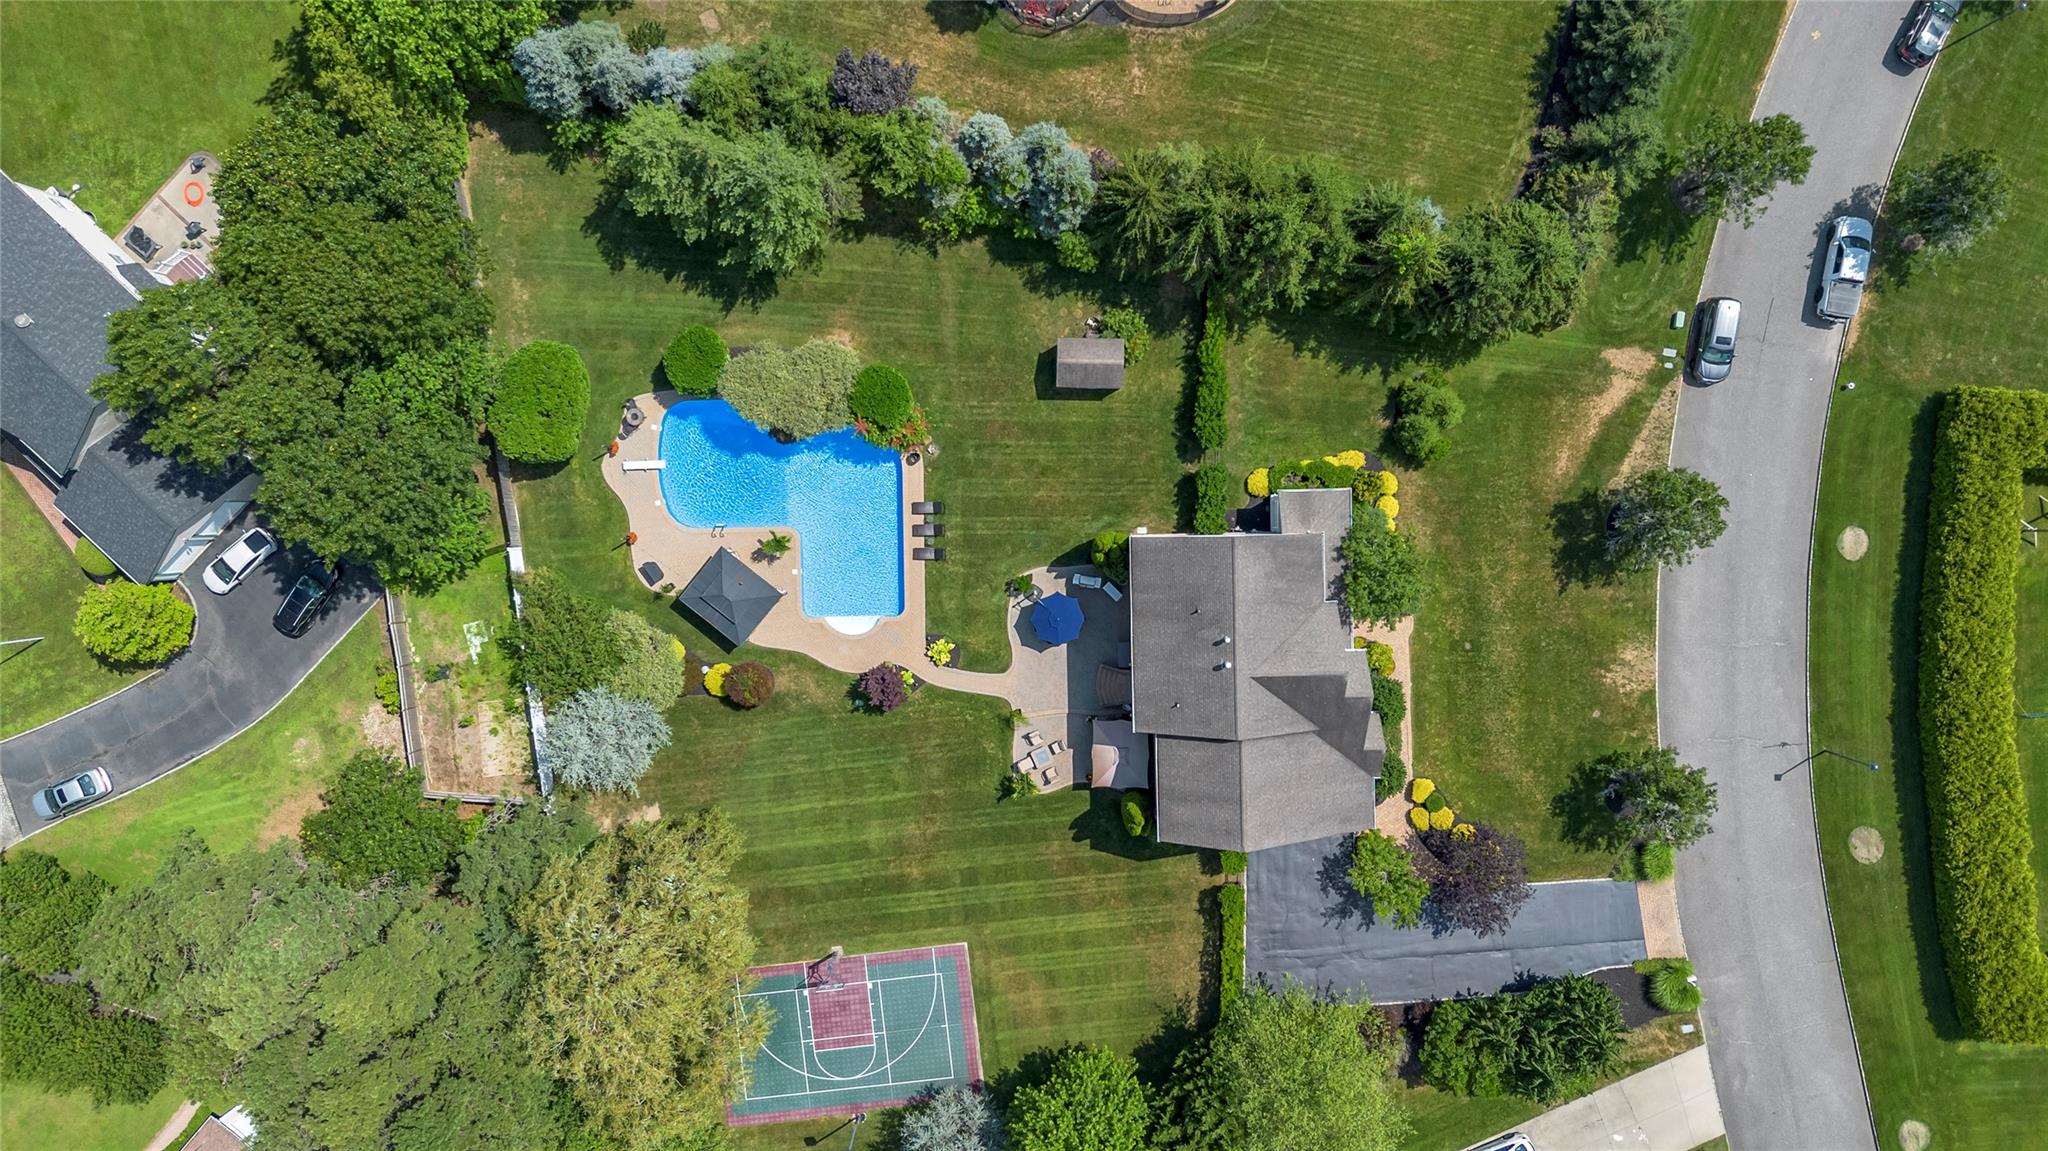
Offered to new residents for the first time, this young post-modern Colonial—constructed in 2003—is set within one of Wading River’s most desirable subdivisions, surrounded by equally beautiful homes. Well maintained and tastefully & thoughtfully updated, it presents a true move-in ready opportunity within Shoreham-Wading River school district. The home welcomes you with an architecturally interesting double height foyer trimmed with custom millwork. Flanking the entry, one will find a first floor study (optional 5th bedroom) to the left, and a formal living room that seamlessly transitions into a formal dining room, to the right. Crown molding, wainscoting, rich hardwood floors, and oversized bay windows enhance these spaces, which are perfectly suited for hosting gatherings. At the heart of the home, the chef’s kitchen features solid maple cabinetry, granite countertops, updated stainless steel appliances - including a gas range - and a functional layout ideal for everyday living and entertaining alike. The adjacent family room offers lofty 20 foot ceilings, four oversized windows, and a focal-point gas fireplace, as well as a Juliet balcony set above. Upstairs, a double-door entry leads to a generously proportioned primary suite complete with a spacious walk-in dressing room, and an ensuite offering dual vanities, a soaking tub with views over the backyard, and a separate water closet. Three additional bedrooms, one with a walk-in closet, along with a full hall bath and convenient second-floor laundry, round out the upper level. The finished lower level is simply awesome, offering 10-foot ceilings and a lounge-inspired design. Highlights include a wet bar with seating for six comfortably, multiple beverage refrigerators, a built-in wine rack, a dedicated billiards area, and a high-end theater room for immersive movie nights (details upon request). Outdoors, over 0.8 acres of level, manicured grounds stand as an extension of your interior living space. An extensive herringbone paver patio offers three distinct entertaining areas, including a gazebo-covered poolside lounge. The custom oversized L-shaped pool features three sheer descent waterfalls and is surrounded by lush landscaping. A lighted sports court and expansive lawn offer additional space for recreation. Other noteworthy points include a two car side entry garage, natural gas heating, and a brand new hot water heater. Located within the acclaimed Shoreham-Wading River School District and part of the Township of Riverhead, this property stands in close proximity to north shore beaches on the Long Island Sound, Wading River’s Wildwood State Park, and Long Island’s North Fork…think vineyards, beaches, farms, and coastal towns that define the best of the East End lifestyle.
Build Your Team
Quickly find investor-friendly professionals who can help you succeed in real estate investing at any stage of the investing journey.


Agents
Match with investor-friendly agents who can help you find, analyze, and close your next deal


Lenders
Get the best funding…find investor-friendly lenders who specialize in your deal strategy


Property Managers
Transition to passive investing. Find a trusted property management partnership that lasts.


Tax Pros & Accountants
Taxes and financial reporting made easy—find experts to create tax savings strategies, file taxes, and more
Location
Property Details
Parking
- Description: Attached Garage
- Garage Spaces: 2
- Spaces Total: 0
Bedroom Information
- # of Bedrooms: 4
Bathroom Information
- # of Baths (Full): 3
- # of Baths (Partial): 1
- # of Baths (Total): 4.0
Interior Features
- # of Rooms: 10
- # of Stories: 2
- Basement: Yes
- Basement Description: Finished
- Fireplace: Yes
Exterior Features
- Exterior Walls Materials: Siding (Alum/Vinyl)
- Pool: Yes
Land Information
- Land Use: Residential
- Land Use Subtype: Single Family Residential
Lot Information
- Parcel ID: 0600096.0001.00013.017
- Lot Size: 36155 sqft
Property Information
- Property Type: Single Family Residence
- Style: Colonial, Post Modern
- Year Built: 2003
Tax Information
- Annual Tax: $21,240
Utilities
- Water & Sewer: Public
- Heating: Natural Gas
- Cooling: Central Air
Location
- County: Suffolk
Listing Details
Investment Summary
- Monthly Cash Flow
- -$4,296
- Cap Rate
- 1.9%
- Cash-on-Cash Return
- -17.9%
- Debt Coverage Ratio
- 0.32
- Internal Rate of Return (5 years)
- -13.3%
Cash Flow
Net Operating Income (NOI) minus mortgage payments.
Calculation:
NOI - Mortgage Payments
Cap Rate (Market Value)
Capitalization Rate is a rate of return that compares the yearly Net Operating Income (NOI) to the market value.
Calculation:
NOI / Market Value
Cash-on-Cash Return (CoC)
Annual Cash Flow / Cash Invested
Calculation:
Annual cash flow divided by initial cash invested.
Debt Coverage Ratio (DCR)
Net Operating Income (NOI) divided by total debt payments.
Calculation:
NOI / Total Debt Payments
Internal Rate of Return (IRR)
A metric for assessing profitability over time. IRR is the discount rate at which the net present value (NPV) of all future cash flows (positive and negative) from an investment equals zero — including both periodic cash flow (such as rent) and a projected sale at the end of the holding period. It represents the expected annualized return, accounting for income, expenses, and the recovery of capital through a future sale.
Purchase Details
Purchase PriceThe price paid for the property. Purchase price:
| $1,250,000 |
|---|---|
Amount FinancedThe amount of the purchase financed through a loan. Amount financed:
| -$1,000,000 |
Down paymentThe initial payment made towards the purchase. Down payment:
| $250,000 |
Closing CostsFees and expenses associated with purchasing a property, typically ranging from 2% to 5% of the home’s purchase price, paid at the end of a home purchase to cover services like lending, title transfer, and taxes. Closing costs:
| $37,500 |
Rehab CostsCosts incurred to repair or improve the property, including: roof, flooring, exterior siding, kitchen, exterior paint, bathrooms, etc. Rehab costs:
| $0 |
Initial Cash InvestedThe total initial cash invested in the property. Calculation:Down payment + Buying costs + Rehab costs Initial cash invested:
| $287,500 |
Square Feet (SQFT)The total square footage of the property. Square feet:
| 3,423 |
Cost Per Square FootCost per square foot of the property. Calculation:Purchase Price / Square Feet Cost per square foot:
| $365 |
Monthly Rent Per Square FootMonthly rent divided by the number of square feet. This ratio helps investors compare rental income efficiency across properties, markets, and unit sizes Calculation:Monthly Rent / Square Feet Monthly rent per square foot:
| $1.61 |
Financing Details
Loan AmountThe total sum of money borrowed from a lender to finance a property purchase. Calculation:Purchase Price - Down Payment
Loan amount:
| $1,000,000 |
|---|---|
Loan to Value Ratio (LTV)Loan amount divided by the market value of the property. Calculation:Loan Amount / Market Value
Loan to value ratio:
| 80.0% |
Loan TypeThe type of loan (e.g., fixed, adjustable).
Loan type:
| Amortizing |
TermThe loan repayment period in years.
Term:
| 30 years |
Interest RateThe percentage a lender charges on the borrowed amount of a loan, determining the cost of borrowing money.
Interest rate:
| 6.500% |
Principal & Interest (PI)The principal is the portion of the loan payment that reduces the loan balance. The interest is the lender's charge for borrowing money. Calculation:(P * r * (1 + r) ** n) / ((1 + r) ** n - 1) Where:
P = Loan amount (principal)
Principal & interest:
| $6,321 |
Property TaxesAnnual taxes levied by local governments on real estate properties. These taxes fund public services like schools, roads, and emergency services.
Property tax:
| $1,770 |
InsuranceThe costs for insurance coverage to protect against financial losses due to risks like fire, natural disasters, theft, liability, or tenant-related damages. Calculation:Assumes 7% of gross rental income, unless insurance rates are specified.
Insurance:
| $385 |
Private Mortgage Insurance (PMI)A fee that borrowers pay when they take out a conventional loan with a loan-to-value (LTV) ratio above 80%.
Private mortgage insurance (PMI):
| $0 |
Monthly PaymentThe fixed amount a borrower pays each month to repay a loan. It typically includes principal and interest (P&I) and may also cover property taxes, insurance, HOA fees, and PMI if escrowed. Monthly payment:
| $8,476 |
Operating Income
| % Rent | Monthly | Yearly | |
|---|---|---|---|
Gross RentThe total rental income received from tenants before deducting any expenses. Includes base rent, late fees, pet fees, parking fees, and other recurring charges.
Gross rent:
| $5,500 | $66,000 | |
Vacancy LossExpected loss of rent due to vacancies.
Vacancy loss:
(6%)
| 6% | -$330 | -$3,960 |
Operating IncomeGross rental income minus vacancy loss. Calculation:Gross rent - Vacancy loss
Operating income:
| $5,170 | $62,040 |
Operating Expenses
| % Rent | Monthly | Yearly | |
|---|---|---|---|
Property TaxesAnnual taxes levied by local governments on real estate properties. These taxes fund public services like schools, roads, and emergency services. | 32% | -$1,770 | -$21,241 |
InsuranceThe costs for insurance coverage to protect against financial losses due to risks like fire, natural disasters, theft, liability, or tenant-related damages. Calculation:Assumes 7% of gross rental income, unless insurance rates are specified. | 7% | -$385 | -$4,620 |
Property ManagementThe costs associated with hiring a property manager to handle the day-to-day operations of a rental property. Includes management fees, leasing fes, eviction fees, etc. Calculation:Assumes 8% of gross rental income. | 8% | -$440 | -$5,280 |
Repairs & MaintenanceOngoing costs for routine upkeep and minor fixes needed to keep a property in good working condition. Calculation:Assumes 5% of gross rental income. Varies by property age and condition. | 5% | -$275 | -$3,300 |
Capital ExpensesLarge, infrequent costs for major improvements or replacements, like a new roof, HVAC system, or appliances. Calculation:Assumes 5% of gross rental income. Varies by property age. | 5% | -$275 | -$3,300 |
HOA FeesRegular dues paid to a Homeowners Association for community maintenance, amenities, and management. Similar fees include: Condo Association Fees, Co-op Maintenance Fees, etc. | n/a | n/a | n/a |
Operating ExpensesRecurring costs required to maintain and manage a rental property, including property taxes, insurance, maintenance, repairs, utilities (if paid by the owner), property management fees, and other day-to-day expenses. Calculation:Insurance + Property Taxes + Property Management + Repairs & Maintenance + Capital Expenditures + HOA Fees | 57% | -$3,145 | -$37,741 |
Cash Flow
| Monthly | Yearly | |
|---|---|---|
Net Operating Income (NOI)The income generated from a property after deducting all operating expenses but before deducting mortgage payments, taxes, and capital expenditures. Calculation:Gross Operating Income - Operating Expenses
Net operating income:
| $2,025 | $24,300 |
Mortgage PaymentThe fixed amount a borrower pays each month to repay a loan. It typically includes principal and interest (P&I) and may also cover property taxes, insurance, HOA fees, and PMI if escrowed. | -$6,321 | -$75,852 |
Cash FlowNet Operating Income (NOI) minus mortgage payments. Calculation:NOI - Mortgage Payments | -$4,296 | -$51,552 |