


$374,930
Investment Summary
- Monthly Cash Flow
- -$1,604
- Cap Rate
- 1.1%
- Cash-on-Cash Return
- -22.3%
- Debt Coverage Ratio
- 0.18
- Internal Rate of Return (5 years)
- -17.5%
Cash Flow
Net Operating Income (NOI) minus mortgage payments.
Calculation:
NOI - Mortgage Payments
Cap Rate (Market Value)
Capitalization Rate is a rate of return that compares the yearly Net Operating Income (NOI) to the market value.
Calculation:
NOI / Market Value
Cash-on-Cash Return (CoC)
Annual Cash Flow / Cash Invested
Calculation:
Annual cash flow divided by initial cash invested.
Debt Coverage Ratio (DCR)
Net Operating Income (NOI) divided by total debt payments.
Calculation:
NOI / Total Debt Payments
Internal Rate of Return (IRR)
A metric for assessing profitability over time. IRR is the discount rate at which the net present value (NPV) of all future cash flows (positive and negative) from an investment equals zero — including both periodic cash flow (such as rent) and a projected sale at the end of the holding period. It represents the expected annualized return, accounting for income, expenses, and the recovery of capital through a future sale.
Property Description
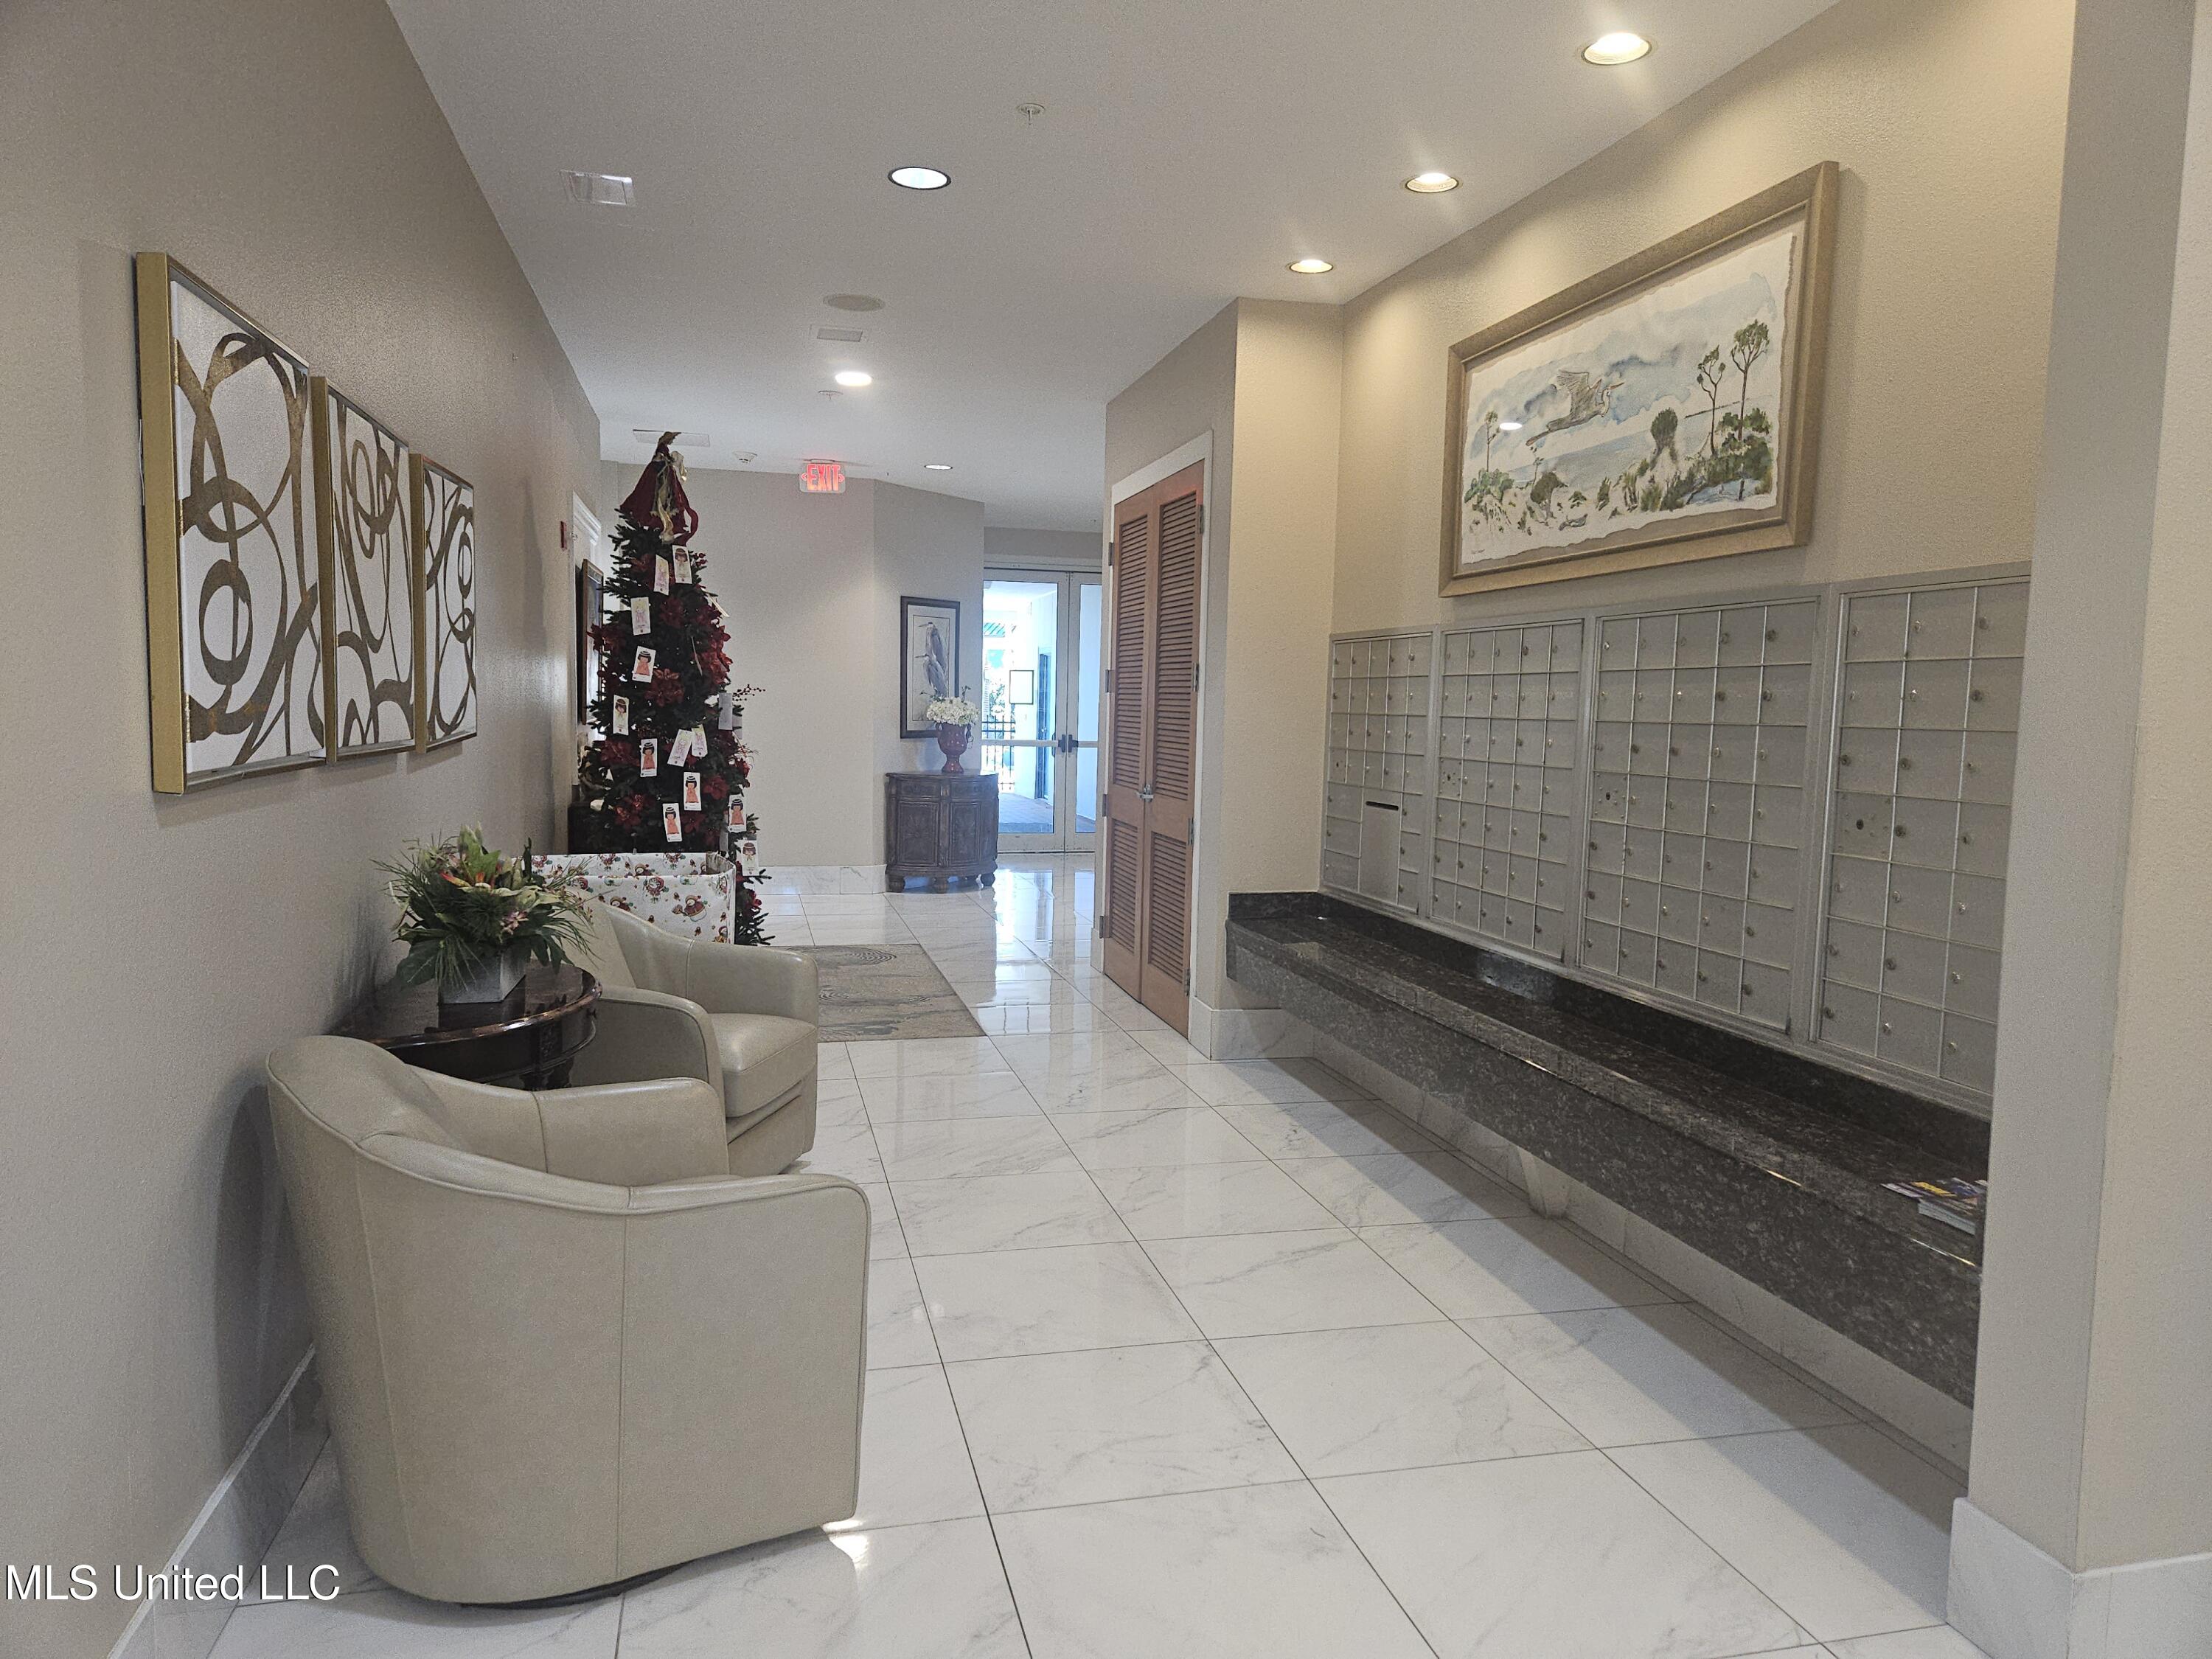
Welcome to the most luxurious beachfront condominium complex on the Mississippi Gulf Coast! This stunning property offers an unparalleled living experience with both outdoor and indoor amenities designed for comfort, relaxation, and entertainment. Outdoor Amenities: Resort-style Pool: A large pool with a separate kiddie pool and a hot tub, all surrounded by palm trees. Relaxation Areas: Enjoy covered and uncovered lounge chairs, perfect for soaking up the sun. Convenience: Grills, soda machines, water coolers, and bathrooms available for your convenience. Indoor Amenities: Club Room: A spacious, reservable club room with a massive kitchenâ€''ideal for hosting parties and gatherings. Theater Room: Plush theater room for club or reservable media viewings. Gym & Sauna: A state-of-the-art fitness center with a sauna and separate men's and women's bathrooms, each with a shower. Library & Game Table: A quiet library with a game table, perfect for relaxing or socializing. Spectacular Gulf Views: All three amenities boast breathtaking views of the Gulf of Mexico. Club Activities: Water Aerobics: Daily water aerobics sessions for fitness and fun. Social Events: Weekly card game socials and a ladies' Bible study group. Seasonal Events: Enjoy a variety of seasonal activities that foster a strong community spirit. Prime Location: Convenient Shopping & Dining: Just steps away from I-Hop (southwest corner), Super Walmart (north), and Edgewater Mall (east). 32-Mile Beachfront: Located along the scenic Mississippi Sound with 8 miles of multifunctional pathways for walking, biking, and enjoying historical sites and park benches. Exclusive Access & Privacy: Elevator Access: Take one of three elevators, each with security personnel at the desk, to your rear covered balcony. Conditioned Sitting Areas: Each floor features a comfortable, climate-controlled sitting area for residents. Inside the Condo: Living Room: Features a wet bar and sliding door access to the beachside balcony, which is also accessible from the primary bedroom. Dining Area: Beautiful recessed ceiling with a wide, tall bar over the kitchen cabinets. The kitchen itself is spacious and features stainless steel appliances, additional wall cabinets, and a pantry. Primary Bedroom & Ensuite: Spacious primary bedroom with a large, private bathroom including a wide double vanity, a heart-shaped jetted tub, a separate shower, a walk-in closet, and a private toilet room. Second Bedroom: A comfortable second bedroom with access to a second bathroom, which can also be accessed from the foyer, across from the laundry room. Don't Miss Out! Make your appointment today to see this exceptional beachfront condominium. Enjoy the lifestyle you deserve with luxury, convenience, and stunning views!
Build Your Team
Quickly find investor-friendly professionals who can help you succeed in real estate investing at any stage of the investing journey.


Agents
Match with investor-friendly agents who can help you find, analyze, and close your next deal


Lenders
Get the best funding…find investor-friendly lenders who specialize in your deal strategy


Property Managers
Transition to passive investing. Find a trusted property management partnership that lasts.


Tax Pros & Accountants
Taxes and financial reporting made easy—find experts to create tax savings strategies, file taxes, and more
Location
Property Details
Parking
- Description: Gated, On Site, Open, Parking Lot, Varies by Unit, Concrete
- Details: Gated, On Site, Open, Parking Lot, Varies by Unit, Concrete
- Garage Spaces: 0
- Spaces Total: 0
Bedroom Information
- # of Bedrooms: 2
Bathroom Information
- # of Baths (Full): 2
- # of Baths (Total): 2.0
Exterior Features
- Foundation: Concrete Perimeter
- Roof Material: Metal
- Pool: Yes
HOA
- Has HOA: Yes
- HOA Fee: $850/monthly
Land Information
- Land Use: Residential
- Land Use Subtype: Condominium Unit
Lot Information
- Parcel ID: 1110M04007.002
- Lot Size: 111949 sqft
Property Information
- Property Type: Condominium
- Style: See Remarks
- Year Built: 2007
Tax Information
- Annual Tax: $3,708
Utilities
- Water & Sewer: Public
- Heating: Central, Electric
- Cooling: Ceiling Fan(s), Central Air, Electric
Location
- County: Harrison
Listing Details
Investment Summary
- Monthly Cash Flow
- -$1,604
- Cap Rate
- 1.1%
- Cash-on-Cash Return
- -22.3%
- Debt Coverage Ratio
- 0.18
- Internal Rate of Return (5 years)
- -17.5%
Cash Flow
Net Operating Income (NOI) minus mortgage payments.
Calculation:
NOI - Mortgage Payments
Cap Rate (Market Value)
Capitalization Rate is a rate of return that compares the yearly Net Operating Income (NOI) to the market value.
Calculation:
NOI / Market Value
Cash-on-Cash Return (CoC)
Annual Cash Flow / Cash Invested
Calculation:
Annual cash flow divided by initial cash invested.
Debt Coverage Ratio (DCR)
Net Operating Income (NOI) divided by total debt payments.
Calculation:
NOI / Total Debt Payments
Internal Rate of Return (IRR)
A metric for assessing profitability over time. IRR is the discount rate at which the net present value (NPV) of all future cash flows (positive and negative) from an investment equals zero — including both periodic cash flow (such as rent) and a projected sale at the end of the holding period. It represents the expected annualized return, accounting for income, expenses, and the recovery of capital through a future sale.
Purchase Details
Purchase PriceThe price paid for the property. Purchase price:
| $374,930 |
|---|---|
Amount FinancedThe amount of the purchase financed through a loan. Amount financed:
| -$299,944 |
Down paymentThe initial payment made towards the purchase. Down payment:
| $74,986 |
Closing CostsFees and expenses associated with purchasing a property, typically ranging from 2% to 5% of the home’s purchase price, paid at the end of a home purchase to cover services like lending, title transfer, and taxes. Closing costs:
| $11,248 |
Rehab CostsCosts incurred to repair or improve the property, including: roof, flooring, exterior siding, kitchen, exterior paint, bathrooms, etc. Rehab costs:
| $0 |
Initial Cash InvestedThe total initial cash invested in the property. Calculation:Down payment + Buying costs + Rehab costs Initial cash invested:
| $86,234 |
Square Feet (SQFT)The total square footage of the property. Square feet:
| 0 |
Cost Per Square FootCost per square foot of the property. Calculation:Purchase Price / Square Feet Cost per square foot:
| n/a |
Monthly Rent Per Square FootMonthly rent divided by the number of square feet. This ratio helps investors compare rental income efficiency across properties, markets, and unit sizes Calculation:Monthly Rent / Square Feet Monthly rent per square foot:
| n/a |
Financing Details
Loan AmountThe total sum of money borrowed from a lender to finance a property purchase. Calculation:Purchase Price - Down Payment
Loan amount:
| $299,944 |
|---|---|
Loan to Value Ratio (LTV)Loan amount divided by the market value of the property. Calculation:Loan Amount / Market Value
Loan to value ratio:
| 80.0% |
Loan TypeThe type of loan (e.g., fixed, adjustable).
Loan type:
| Amortizing |
TermThe loan repayment period in years.
Term:
| 30 years |
Interest RateThe percentage a lender charges on the borrowed amount of a loan, determining the cost of borrowing money.
Interest rate:
| 6.840% |
Principal & Interest (PI)The principal is the portion of the loan payment that reduces the loan balance. The interest is the lender's charge for borrowing money. Calculation:(P * r * (1 + r) ** n) / ((1 + r) ** n - 1) Where:
P = Loan amount (principal)
Principal & interest:
| $1,963 |
Property TaxesAnnual taxes levied by local governments on real estate properties. These taxes fund public services like schools, roads, and emergency services.
Property tax:
| $309 |
InsuranceThe costs for insurance coverage to protect against financial losses due to risks like fire, natural disasters, theft, liability, or tenant-related damages. Calculation:Assumes 7% of gross rental income, unless insurance rates are specified.
Insurance:
| $154 |
Private Mortgage Insurance (PMI)A fee that borrowers pay when they take out a conventional loan with a loan-to-value (LTV) ratio above 80%.
Private mortgage insurance (PMI):
| $0 |
Monthly PaymentThe fixed amount a borrower pays each month to repay a loan. It typically includes principal and interest (P&I) and may also cover property taxes, insurance, HOA fees, and PMI if escrowed. Monthly payment:
| $2,426 |
Operating Income
| % Rent | Monthly | Yearly | |
|---|---|---|---|
Gross RentThe total rental income received from tenants before deducting any expenses. Includes base rent, late fees, pet fees, parking fees, and other recurring charges.
Gross rent:
| $2,200 | $26,400 | |
Vacancy LossExpected loss of rent due to vacancies.
Vacancy loss:
(6%)
| 6% | -$132 | -$1,584 |
Operating IncomeGross rental income minus vacancy loss. Calculation:Gross rent - Vacancy loss
Operating income:
| $2,068 | $24,816 |
Operating Expenses
| % Rent | Monthly | Yearly | |
|---|---|---|---|
Property TaxesAnnual taxes levied by local governments on real estate properties. These taxes fund public services like schools, roads, and emergency services. | 14% | -$309 | -$3,708 |
InsuranceThe costs for insurance coverage to protect against financial losses due to risks like fire, natural disasters, theft, liability, or tenant-related damages. Calculation:Assumes 7% of gross rental income, unless insurance rates are specified. | 7% | -$154 | -$1,848 |
Property ManagementThe costs associated with hiring a property manager to handle the day-to-day operations of a rental property. Includes management fees, leasing fes, eviction fees, etc. Calculation:Assumes 8% of gross rental income. | 8% | -$176 | -$2,112 |
Repairs & MaintenanceOngoing costs for routine upkeep and minor fixes needed to keep a property in good working condition. Calculation:Assumes 5% of gross rental income. Varies by property age and condition. | 5% | -$110 | -$1,320 |
Capital ExpensesLarge, infrequent costs for major improvements or replacements, like a new roof, HVAC system, or appliances. Calculation:Assumes 5% of gross rental income. Varies by property age. | 5% | -$110 | -$1,320 |
HOA FeesRegular dues paid to a Homeowners Association for community maintenance, amenities, and management. Similar fees include: Condo Association Fees, Co-op Maintenance Fees, etc. | 39% | -$850 | -$10,200 |
Operating ExpensesRecurring costs required to maintain and manage a rental property, including property taxes, insurance, maintenance, repairs, utilities (if paid by the owner), property management fees, and other day-to-day expenses. Calculation:Insurance + Property Taxes + Property Management + Repairs & Maintenance + Capital Expenditures + HOA Fees | 78% | -$1,709 | -$20,508 |
Cash Flow
| Monthly | Yearly | |
|---|---|---|
Net Operating Income (NOI)The income generated from a property after deducting all operating expenses but before deducting mortgage payments, taxes, and capital expenditures. Calculation:Gross Operating Income - Operating Expenses
Net operating income:
| $359 | $4,308 |
Mortgage PaymentThe fixed amount a borrower pays each month to repay a loan. It typically includes principal and interest (P&I) and may also cover property taxes, insurance, HOA fees, and PMI if escrowed. | -$1,963 | -$23,556 |
Cash FlowNet Operating Income (NOI) minus mortgage payments. Calculation:NOI - Mortgage Payments | $1,604 | $19,248 |