Biloxi, MS Investment Properties for Sale
Browse homes for sale and investment properties in Biloxi, MS. Refine your search by price, property type, or more.
Best cash flowing properties in Biloxi, MS
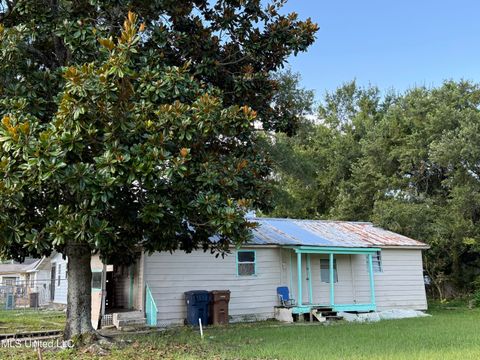
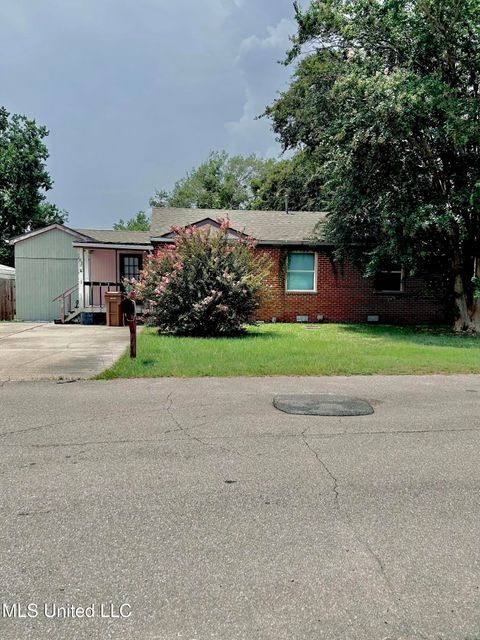
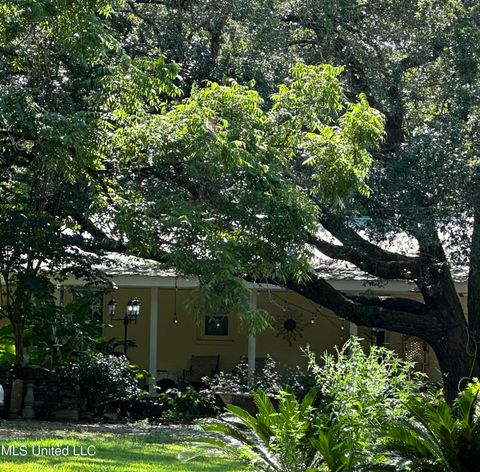
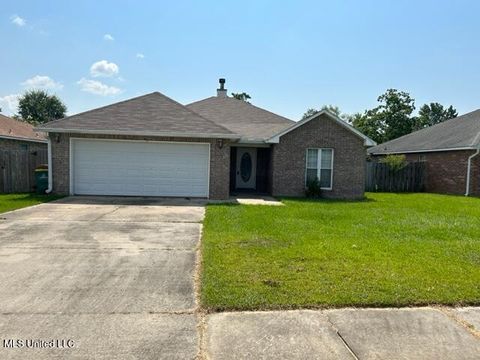
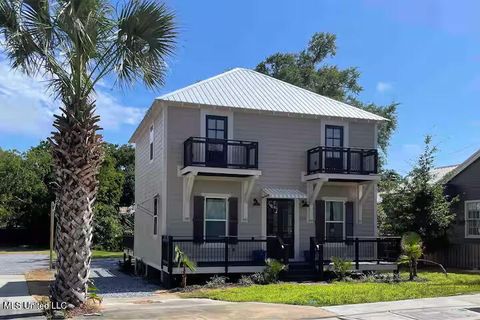
Active
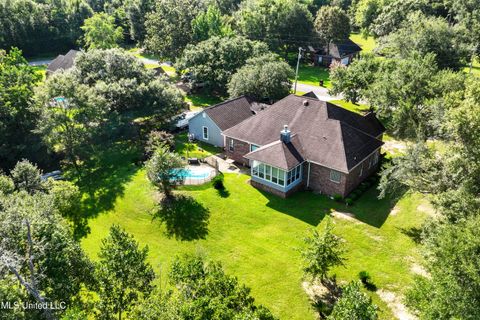
$64,900
2
bds
|
2
ba
|
0
sqft
|
built
1940
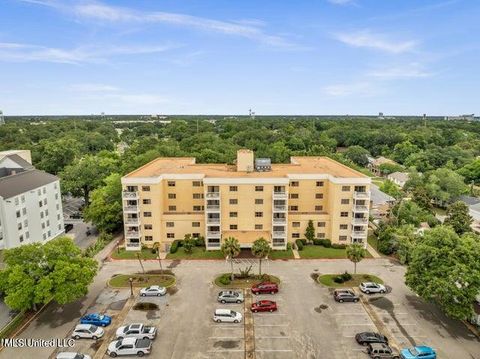
277 Nichols Dr, Biloxi, MS 39530
$966
Cash flow
17.3%
Cash-on-Cash Return
17.9%
Cap rate
2.2%
Rent to Value Ratio

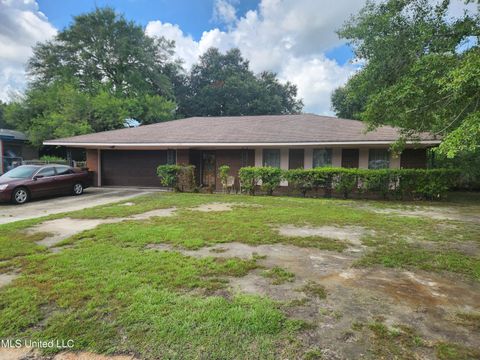
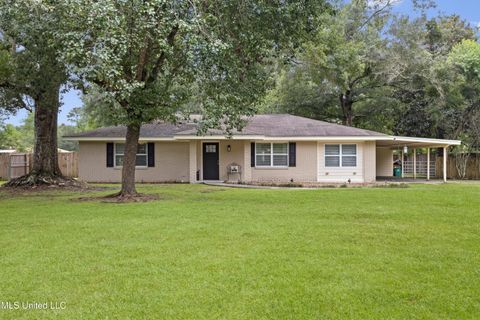
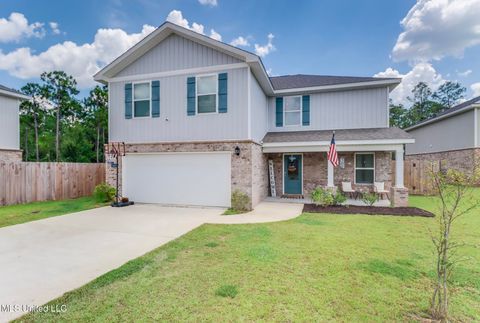
Active
$139,000
4
bds
|
2
ba
|
0
sqft
|
built
1962
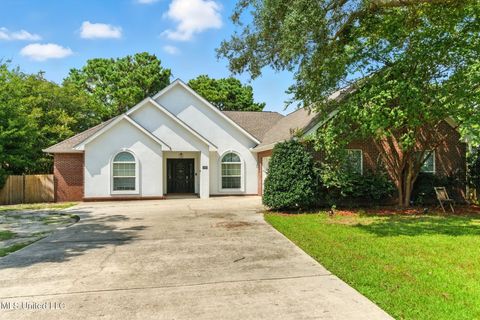
2516 Orleans Rd, Biloxi, MS 39531
$704
Cash flow
26.4%
Cash-on-Cash Return
11.8%
Cap rate
1.4%
Rent to Value Ratio
187 out of 206 properties for sale in Biloxi, MS
Limited Results Shown
Create a free account, or log in to reveal all property listings and enjoy the complete experience.
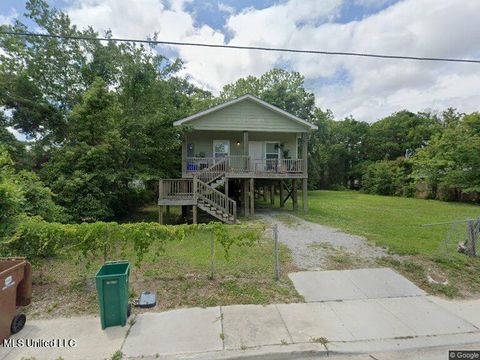
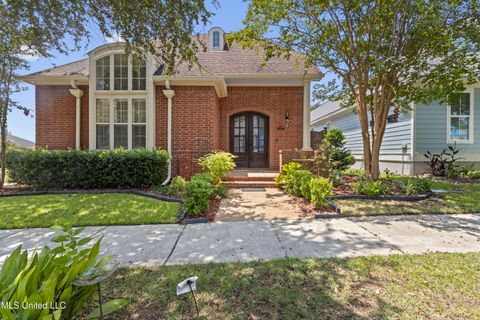
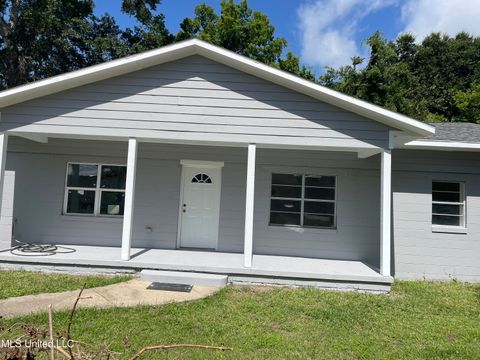
Active
$169,900
1
bds
|
1
ba
|
0
sqft
|
built
1965
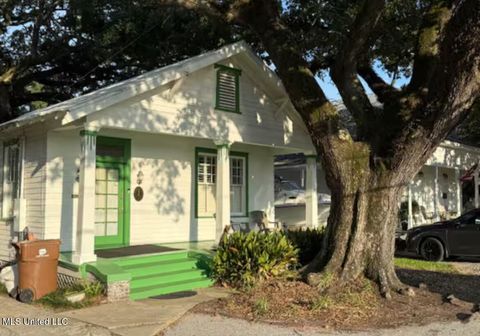
1282 Beach Blvd, Biloxi, MS 39530
$17
Cash flow
0.5%
Cash-on-Cash Return
5.8%
Cap rate
1.1%
Rent to Value Ratio
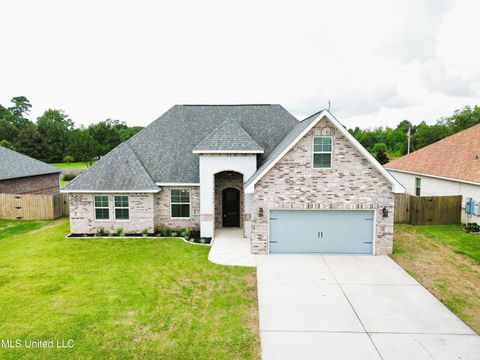
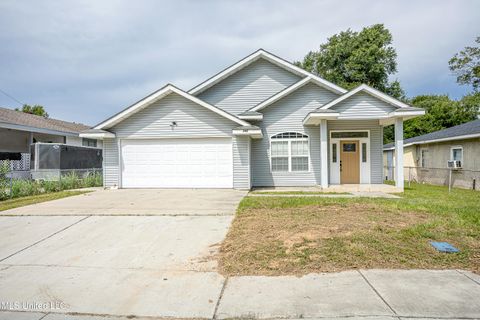
Active
$399,900
3
bds
|
2
ba
|
0
sqft
|
built
2020
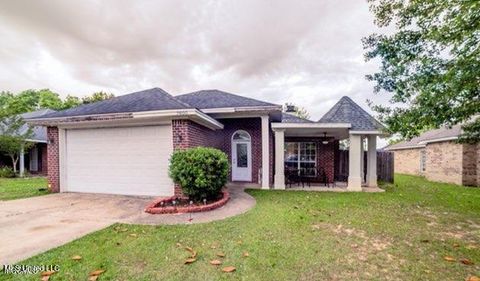
7919 Village Green Dr, Biloxi, MS 39532
$-284
Cash flow
-3.7%
Cash-on-Cash Return
4.8%
Cap rate
0.7%
Rent to Value Ratio
Active
$200,000
3
bds
|
3
ba
|
0
sqft
|
built
2013
269 Holley St, Biloxi, MS 39530
$-38
Cash flow
-1.0%
Cash-on-Cash Return
5.4%
Cap rate
0.7%
Rent to Value Ratio
Active
$118,000
2
bds
|
2
ba
|
0
sqft
|
built
1950
167 Travia Ave, Biloxi, MS 39531
$259
Cash flow
11.5%
Cash-on-Cash Return
8.3%
Cap rate
1.1%
Rent to Value Ratio
Active
$328,900
3
bds
|
2
ba
|
0
sqft
|
built
1970
8474 Woolmarket Rd, Biloxi, MS 39532
$-213
Cash flow
-3.4%
Cash-on-Cash Return
4.9%
Cap rate
0.6%
Rent to Value Ratio
Active
$185,000
3
bds
|
2
ba
|
0
sqft
|
built
1885
128 Thomas St, Biloxi, MS 39530
$88
Cash flow
2.5%
Cash-on-Cash Return
6.2%
Cap rate
0.9%
Rent to Value Ratio
Active
$355,000
3
bds
|
2
ba
|
0
sqft
|
built
1996
11512 Holly Bluff Cir, Biloxi, MS 39532
$-368
Cash flow
-5.4%
Cash-on-Cash Return
4.4%
Cap rate
0.6%
Rent to Value Ratio
Active
$280,000
2
bds
|
2
ba
|
0
sqft
|
built
1981
1130 Beach Blvd, Biloxi, MS 39530
$-843
Cash flow
-15.7%
Cash-on-Cash Return
2.1%
Cap rate
0.6%
Rent to Value Ratio
Active
$349,000
3
bds
|
2
ba
|
0
sqft
|
built
2006
2406 Bonne Terre Blvd, Biloxi, MS 39531
$-38
Cash flow
-0.6%
Cash-on-Cash Return
5.5%
Cap rate
0.7%
Rent to Value Ratio
Active
$350,000
2
bds
|
2
ba
|
0
sqft
|
built
1900
132 Dukate St, Biloxi, MS 39530
$-543
Cash flow
-8.1%
Cash-on-Cash Return
3.8%
Cap rate
0.5%
Rent to Value Ratio
Active
$219,000
3
bds
|
2
ba
|
0
sqft
|
built
2005
7400 Southwind Dr, Biloxi, MS 39532
$388
Cash flow
9.2%
Cash-on-Cash Return
7.8%
Cap rate
1.0%
Rent to Value Ratio
Active
$469,000
4
bds
|
3
ba
|
0
sqft
|
built
2006
11827 River Estates Cir, Biloxi, MS 39532
$-446
Cash flow
-5.0%
Cash-on-Cash Return
4.5%
Cap rate
0.6%
Rent to Value Ratio
Active
$475,000
4
bds
|
3
ba
|
0
sqft
|
built
1994
2013 Rue Ulysse, Biloxi, MS 39531
$-520
Cash flow
-5.7%
Cash-on-Cash Return
4.4%
Cap rate
0.7%
Rent to Value Ratio
Active
$729,000
3
bds
|
2
ba
|
0
sqft
|
built
1984
1099 Campbell Dr, Biloxi, MS 39532
$-977
Cash flow
-7.0%
Cash-on-Cash Return
4.1%
Cap rate
0.5%
Rent to Value Ratio
Active
$159,000
3
bds
|
3
ba
|
0
sqft
|
built
2001
1805 Irish Hill Dr, Biloxi, MS 39531
$243
Cash flow
8.0%
Cash-on-Cash Return
7.5%
Cap rate
1.0%
Rent to Value Ratio

Active
$249,900
2
bds
|
2
ba
|
0
sqft
|
built
2012
630 Bay Cove Dr, Biloxi, MS 39532
$-150
Cash flow
-3.1%
Cash-on-Cash Return
5.0%
Cap rate
0.6%
Rent to Value Ratio
Active
$574,000
3
bds
|
2
ba
|
0
sqft
|
built
1959
15173 Lorraine Rd, Biloxi, MS 39532
$-1,080
Cash flow
-9.8%
Cash-on-Cash Return
3.4%
Cap rate
0.4%
Rent to Value Ratio
Active
$155,000
3
bds
|
2
ba
|
0
sqft
|
built
1974
2285 Windsor Ct, Biloxi, MS 39532
$435
Cash flow
14.6%
Cash-on-Cash Return
9.1%
Cap rate
1.2%
Rent to Value Ratio
Active
$560,000
4
bds
|
4
ba
|
0
sqft
|
built
2011
19763 Maben Ave, Biloxi, MS 39532
$-856
Cash flow
-8.0%
Cash-on-Cash Return
3.8%
Cap rate
0.6%
Rent to Value Ratio
Active
$250,000
3
bds
|
2
ba
|
0
sqft
|
built
2007
345 Bowen St, Biloxi, MS 39530
$98
Cash flow
2.0%
Cash-on-Cash Return
6.1%
Cap rate
0.8%
Rent to Value Ratio

Active
$249,000
3
bds
|
2
ba
|
0
sqft
|
built
1947
160 Balmoral Ave, Biloxi, MS 39531
$38
Cash flow
0.8%
Cash-on-Cash Return
5.9%
Cap rate
0.8%
Rent to Value Ratio
Active
$300,000
4
bds
|
3
ba
|
0
sqft
|
built
2018
15405 Needle St, Biloxi, MS 39532
$194
Cash flow
3.4%
Cash-on-Cash Return
6.5%
Cap rate
0.9%
Rent to Value Ratio
Active
$257,700
4
bds
|
3
ba
|
0
sqft
|
built
1970
7650 Lexington Dr, Biloxi, MS 39532
$347
Cash flow
7.0%
Cash-on-Cash Return
7.3%
Cap rate
0.9%
Rent to Value Ratio
Active
$325,000
3
bds
|
2
ba
|
0
sqft
|
built
1980
615 N Haven Dr, Biloxi, MS 39532
$61
Cash flow
1.0%
Cash-on-Cash Return
5.9%
Cap rate
0.7%
Rent to Value Ratio
Active
$225,000
3
bds
|
2
ba
|
0
sqft
|
built
1968
2223 Popps Ferry Rd, Biloxi, MS 39532
$60
Cash flow
1.4%
Cash-on-Cash Return
6.0%
Cap rate
0.8%
Rent to Value Ratio
Active
$227,900
3
bds
|
2
ba
|
0
sqft
|
built
2000
10538 Shore Cv, Biloxi, MS 39532
$-96
Cash flow
-2.2%
Cash-on-Cash Return
5.2%
Cap rate
0.7%
Rent to Value Ratio

Active
$245,000
2
bds
|
2
ba
|
0
sqft
|
built
1982
2046 Beach Blvd, Biloxi, MS 39531
$136
Cash flow
2.9%
Cash-on-Cash Return
6.3%
Cap rate
0.9%
Rent to Value Ratio
Active
$234,900
4
bds
|
2
ba
|
0
sqft
|
built
1974
14199 Dundeewood Rd, Biloxi, MS 39532
$206
Cash flow
4.6%
Cash-on-Cash Return
6.7%
Cap rate
0.9%
Rent to Value Ratio
Active
$189,900
4
bds
|
2
ba
|
0
sqft
|
built
1980
15316 Anderson Dr, Biloxi, MS 39532
$87
Cash flow
2.4%
Cash-on-Cash Return
6.2%
Cap rate
0.8%
Rent to Value Ratio
Active
$385,000
4
bds
|
2
ba
|
0
sqft
|
built
2018
6236 Emerald Lake Dr, Biloxi, MS 39532
$-128
Cash flow
-1.7%
Cash-on-Cash Return
5.3%
Cap rate
0.7%
Rent to Value Ratio
Active
$349,900
3
bds
|
2
ba
|
0
sqft
|
built
1952
487 Oaklawn Pl, Biloxi, MS 39530
$-182
Cash flow
-2.7%
Cash-on-Cash Return
5.1%
Cap rate
0.6%
Rent to Value Ratio
Active
$709,000
4
bds
|
4
ba
|
0
sqft
|
built
1992
2004 Claudette Ct, Biloxi, MS 39531
$-1,918
Cash flow
-14.1%
Cash-on-Cash Return
2.4%
Cap rate
0.4%
Rent to Value Ratio
Active
$275,000
3
bds
|
2
ba
|
0
sqft
|
built
1959
2502 Randall Dr, Biloxi, MS 39531
$59
Cash flow
1.1%
Cash-on-Cash Return
5.9%
Cap rate
0.8%
Rent to Value Ratio
Active
$425,000
3
bds
|
2
ba
|
0
sqft
|
built
2007
126 Miramar Ave, Biloxi, MS 39530
$-557
Cash flow
-6.8%
Cash-on-Cash Return
4.1%
Cap rate
0.5%
Rent to Value Ratio
Active
$449,000
3
bds
|
3
ba
|
0
sqft
|
built
2023
649 Howard Ave, Biloxi, MS 39530
$-963
Cash flow
-11.2%
Cash-on-Cash Return
3.1%
Cap rate
0.4%
Rent to Value Ratio
Active
$349,000
4
bds
|
3
ba
|
0
sqft
|
built
2023
5416 Leeds Ln, Biloxi, MS 39532
$-189
Cash flow
-2.8%
Cash-on-Cash Return
5.0%
Cap rate
0.7%
Rent to Value Ratio
Active
$180,000
3
bds
|
2
ba
|
0
sqft
|
built
1976
241 Spanner Ln, Biloxi, MS 39530
$-58
Cash flow
-1.7%
Cash-on-Cash Return
5.3%
Cap rate
0.7%
Rent to Value Ratio

Active
$525,000
3
bds
|
3
ba
|
0
sqft
|
built
2023
121 Grande View Dr, Biloxi, MS 39531
$-415
Cash flow
-4.1%
Cash-on-Cash Return
4.7%
Cap rate
0.6%
Rent to Value Ratio