
$429,900
Investment Summary
- Monthly Cash Flow
- -$259
- Cap Rate
- 5.4%
- Cash-on-Cash Return
- -3.1%
- Debt Coverage Ratio
- 0.88
- Internal Rate of Return (5 years)
- 0.9%
Cash Flow
Net Operating Income (NOI) minus mortgage payments.
Calculation:
NOI - Mortgage Payments
Cap Rate (Market Value)
Capitalization Rate is a rate of return that compares the yearly Net Operating Income (NOI) to the market value.
Calculation:
NOI / Market Value
Cash-on-Cash Return (CoC)
Annual Cash Flow / Cash Invested
Calculation:
Annual cash flow divided by initial cash invested.
Debt Coverage Ratio (DCR)
Net Operating Income (NOI) divided by total debt payments.
Calculation:
NOI / Total Debt Payments
Internal Rate of Return (IRR)
A metric for assessing profitability over time. IRR is the discount rate at which the net present value (NPV) of all future cash flows (positive and negative) from an investment equals zero — including both periodic cash flow (such as rent) and a projected sale at the end of the holding period. It represents the expected annualized return, accounting for income, expenses, and the recovery of capital through a future sale.
Property Description
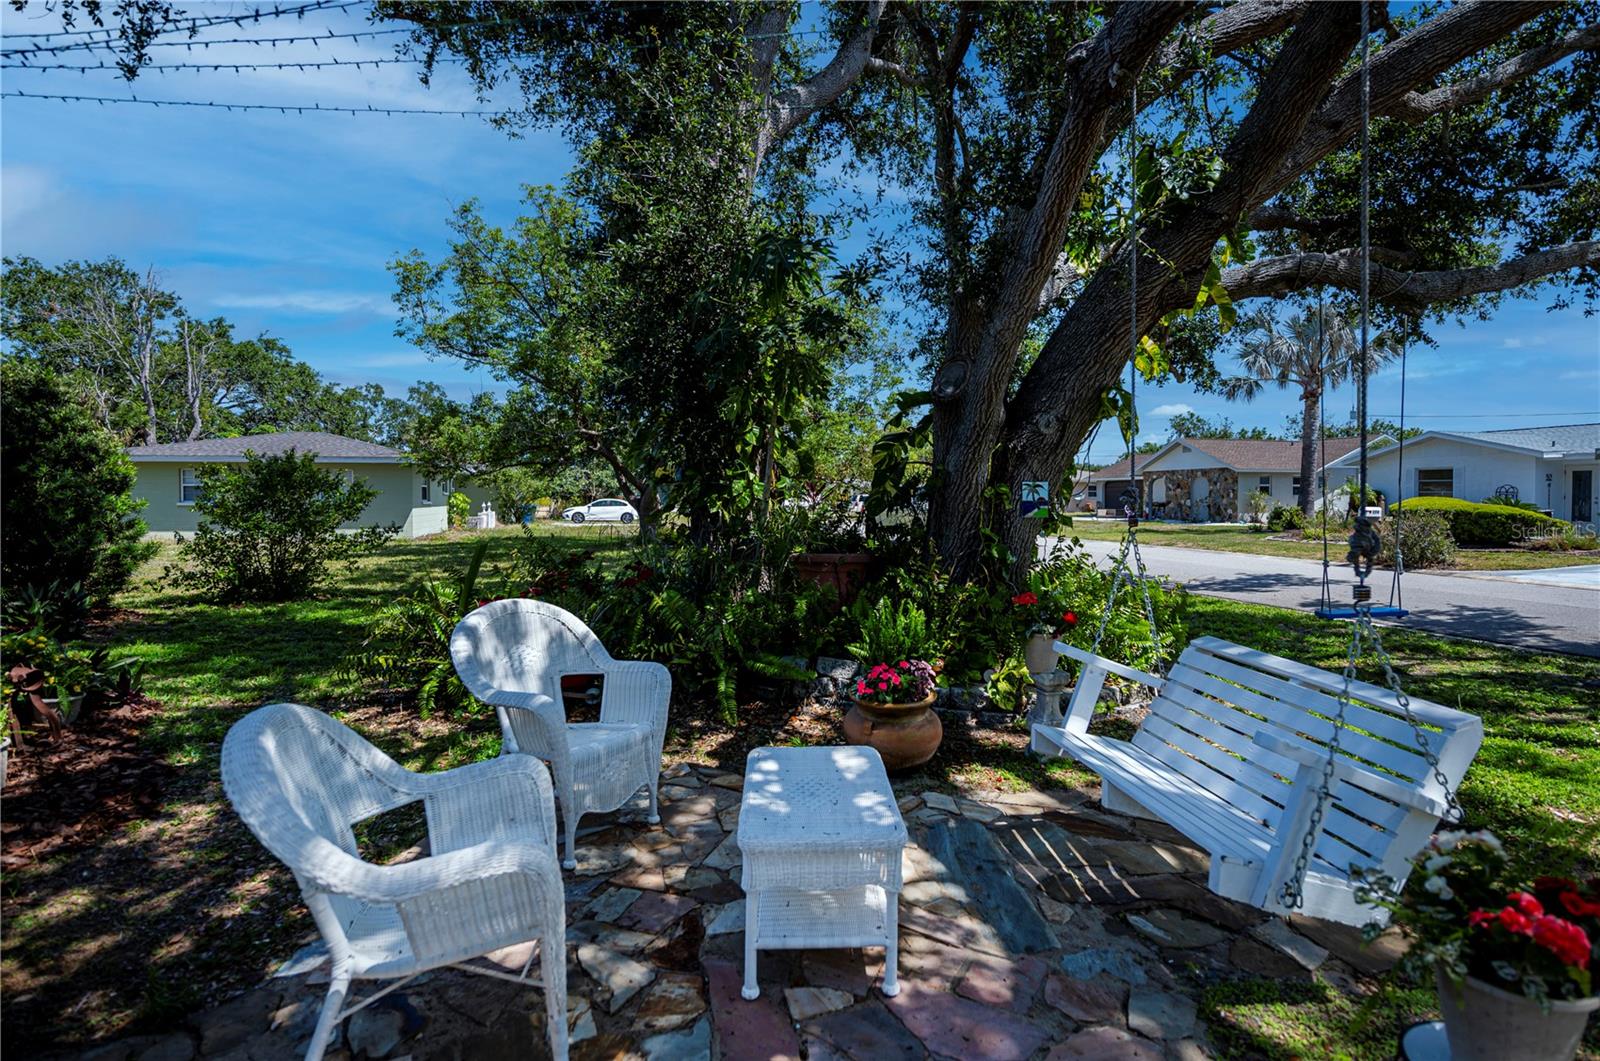
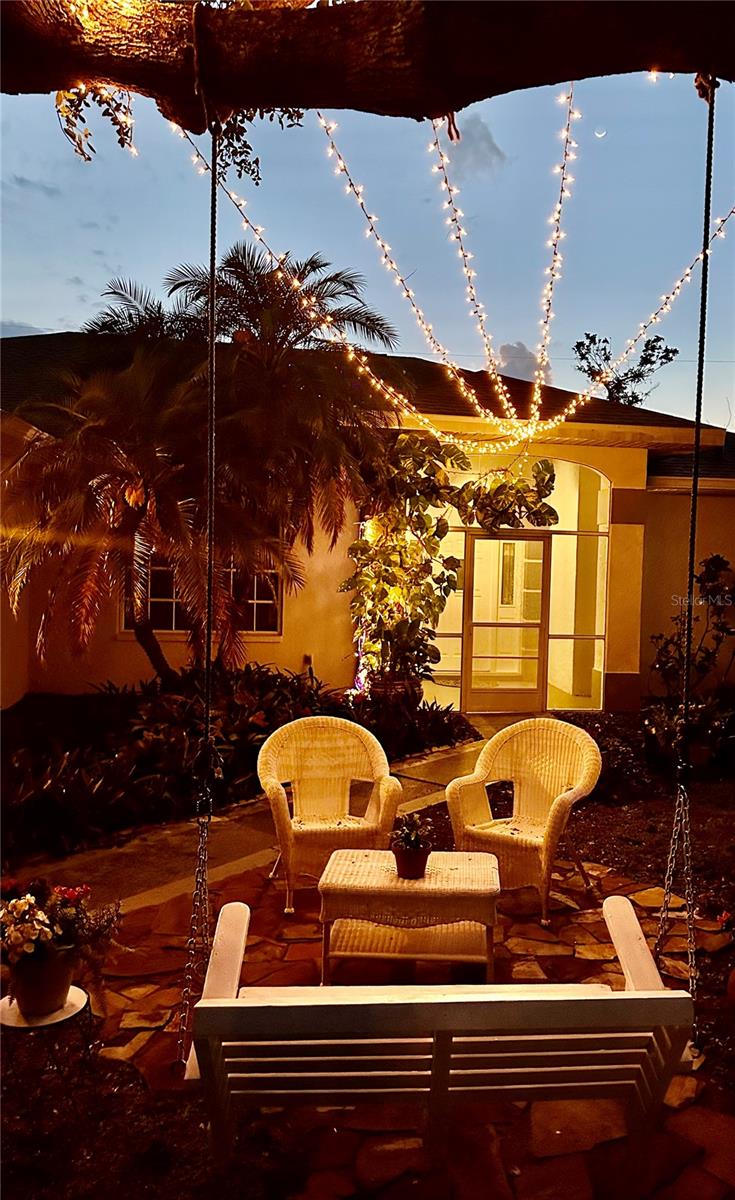
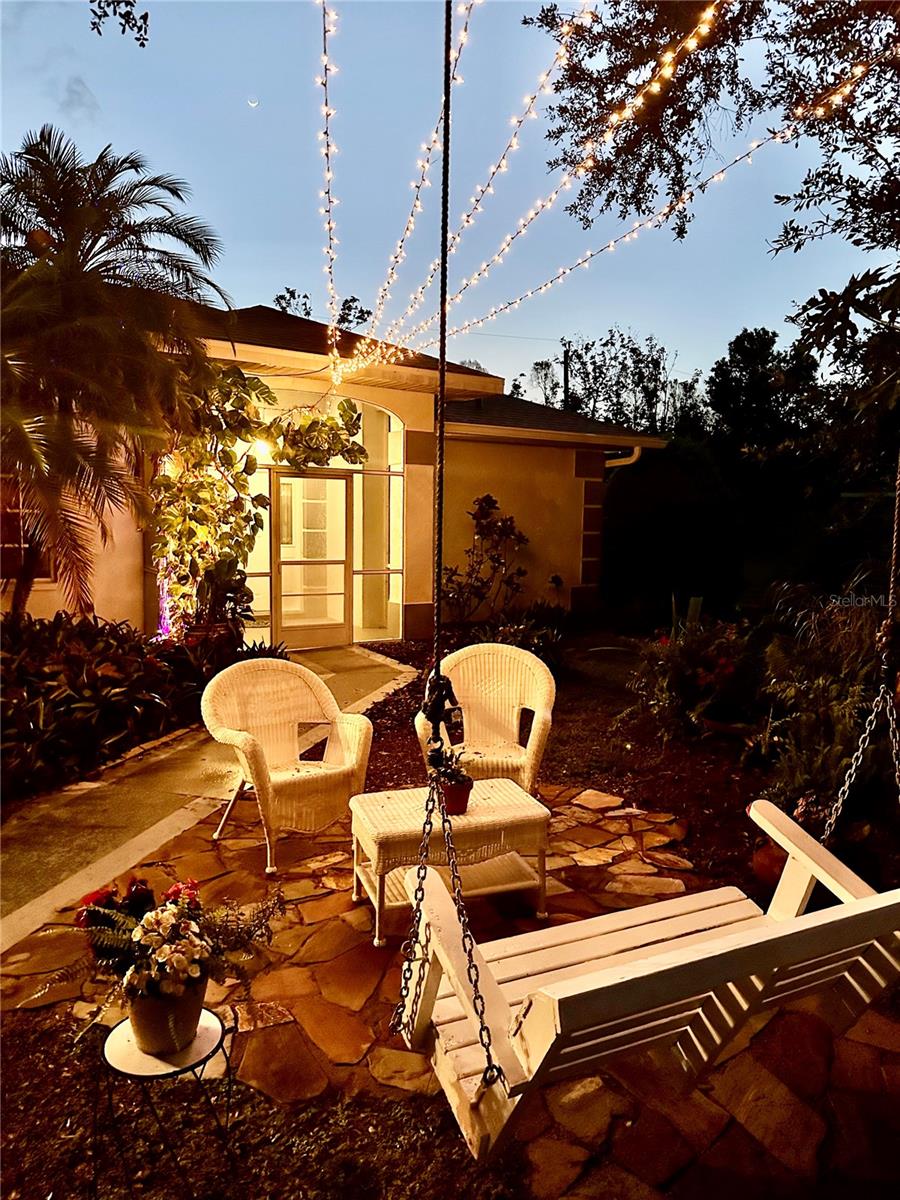
Under contract-accepting backup offers. “OWN YOUR FREEDOM”- No HOA, No CDD! Welcome to this beautifully maintained 3-bedroom, 2-bath, pool home featuring a desirable split-floor plan and elegant crown molding. With just two owners- the original builder and the current seller- this home has been lovingly cared for, and it shows. Enter a bright and expansive living room featuring soaring ceilings and elegant crown molding, ideal for both relaxing evenings and lively entertainment. The kitchen offers an abundance of space, extensive cabinetry, sweeping countertops, and a large peninsula, all complemented by tall ceilings and exquisite crown molding. The expansive primary bedroom offers direct access to the pool through a sliding glass door, perfect for stepping out with your morning coffee or enjoying peaceful Florida evenings. It also features a newly updated walk-in shower fully renovated in March 2025 with a $11,200 UPGRADE, showcasing high end finishes and a fresh modern design. The split floor plan provides two additional bedrooms and a bath on the opposite side of the home – ideal for guests or family members seeking extra privacy. Step outside to your private swimming pool under a screened lanai – ideal for soaking up the Florida sunshine in your own backyard oasis. A brand-new pool light was installed in 2025, a $1,000 UPGRADE that adds both ambiance and functionality for those evening swims. (Child safety fencing is provided and easily installed, giving peace of mind to families with little ones). Additionally, the yard boasts a unique mature edible landscape with a variety of fruits and vegetables planted. Complete with a detailed book listing everything that is growing on the property – perfect for the garden enthusiast or anyone looking to live sustainably. The backyard also features a spacious wooden shed equipped with a garage door entry and a separate locked access. Ideal for additional storage or easily adaptable as a workshop, she shed, studio, or creative outdoor retreat. The RV pad includes a newly installed 30-amp RV hookup and EV charger (2025) a $1,000 UPGRADE perfect for RV owners with additional parking or electric vehicle enthusiasts. Also, the garage is fully equipped with built in storage, a workbench, and all the essentials to create the ultimate man cave or functional workspace. Additional features include roll –down hurricane screen pad, clear hurricane shutters for all windows, Ring security camera, and a central vacuum system. This elegant home truly has it all. $70,000 in UPGRADES in just the last two years. $14,000 UPGRADE Whole House Replumbed 2025. The new roof $24,000 UPGRADE installed in 2023 including the wooden shed is under warranty until 2042, $12,500 UPGRADE Heat Pump HVAC 2024, $2,000 UPGRADE 50 Gallon Water Heater 2024, $500.00 UPGRADE Dishwasher 2024, $3,200 UPGRADE Refrigerator & Microwave 2023, $600 UPGRADE Washing Machine 2024. Located just 7.5 miles from Sharkey's on the Pier and Caspersen Beach. This home offers effortless access to premier shopping, fine entertainment, fine dining and cultural attractions. This is coastal living at its finest where all the BIG-TICKET ITEMS have been taken care of. Just add your personal touch and make it your Florida dream.
Build Your Team
Quickly find investor-friendly professionals who can help you succeed in real estate investing at any stage of the investing journey.


Agents
Match with investor-friendly agents who can help you find, analyze, and close your next deal


Lenders
Get the best funding…find investor-friendly lenders who specialize in your deal strategy


Property Managers
Transition to passive investing. Find a trusted property management partnership that lasts.


Tax Pros & Accountants
Taxes and financial reporting made easy—find experts to create tax savings strategies, file taxes, and more
Location
Property Details
Parking
- Description: Attached Garage
- Details: Boat, Electric Vehicle Charging Station(s), Garage Door Opener, Guest, Off Street, Oversized, Parking Pad, RV Access/Parking, Workshop in Garage, Attached
- Garage Spaces: 2
- Spaces Total: 0
Bedroom Information
- # of Bedrooms: 3
Bathroom Information
- # of Baths (Full): 2
- # of Baths (Total): 2.0
Interior Features
- # of Rooms: 8
- # of Stories: 1
Exterior Features
- Exterior Walls Materials: Stucco
- Foundation: Slab
- Roof Type: Hip
- Roof Material: Shingle
- Pool: Yes
Land Information
- Land Use: Residential
- Land Use Subtype: Single Family Residential
Lot Information
- Parcel ID: 0445130014
- Lot Size: 9000 sqft
Property Information
- Property Type: Single Family Residence
- Year Built: 1993
Tax Information
- Annual Tax: $2,354
Utilities
- Water & Sewer: Public
- Heating: Central, Electric, Heat Pump
- Cooling: Central Air, Humidity Control
Location
- County: Sarasota
Listing Details
Investment Summary
- Monthly Cash Flow
- -$259
- Cap Rate
- 5.4%
- Cash-on-Cash Return
- -3.1%
- Debt Coverage Ratio
- 0.88
- Internal Rate of Return (5 years)
- 0.9%
Cash Flow
Net Operating Income (NOI) minus mortgage payments.
Calculation:
NOI - Mortgage Payments
Cap Rate (Market Value)
Capitalization Rate is a rate of return that compares the yearly Net Operating Income (NOI) to the market value.
Calculation:
NOI / Market Value
Cash-on-Cash Return (CoC)
Annual Cash Flow / Cash Invested
Calculation:
Annual cash flow divided by initial cash invested.
Debt Coverage Ratio (DCR)
Net Operating Income (NOI) divided by total debt payments.
Calculation:
NOI / Total Debt Payments
Internal Rate of Return (IRR)
A metric for assessing profitability over time. IRR is the discount rate at which the net present value (NPV) of all future cash flows (positive and negative) from an investment equals zero — including both periodic cash flow (such as rent) and a projected sale at the end of the holding period. It represents the expected annualized return, accounting for income, expenses, and the recovery of capital through a future sale.
Purchase Details
Purchase PriceThe price paid for the property. Purchase price:
| $429,900 |
|---|---|
Amount FinancedThe amount of the purchase financed through a loan. Amount financed:
| -$343,920 |
Down paymentThe initial payment made towards the purchase. Down payment:
| $85,980 |
Closing CostsFees and expenses associated with purchasing a property, typically ranging from 2% to 5% of the home’s purchase price, paid at the end of a home purchase to cover services like lending, title transfer, and taxes. Closing costs:
| $12,897 |
Rehab CostsCosts incurred to repair or improve the property, including: roof, flooring, exterior siding, kitchen, exterior paint, bathrooms, etc. Rehab costs:
| $0 |
Initial Cash InvestedThe total initial cash invested in the property. Calculation:Down payment + Buying costs + Rehab costs Initial cash invested:
| $98,877 |
Square Feet (SQFT)The total square footage of the property. Square feet:
| 1,781 |
Cost Per Square FootCost per square foot of the property. Calculation:Purchase Price / Square Feet Cost per square foot:
| $241 |
Monthly Rent Per Square FootMonthly rent divided by the number of square feet. This ratio helps investors compare rental income efficiency across properties, markets, and unit sizes Calculation:Monthly Rent / Square Feet Monthly rent per square foot:
| $1.74 |
Financing Details
Loan AmountThe total sum of money borrowed from a lender to finance a property purchase. Calculation:Purchase Price - Down Payment
Loan amount:
| $343,920 |
|---|---|
Loan to Value Ratio (LTV)Loan amount divided by the market value of the property. Calculation:Loan Amount / Market Value
Loan to value ratio:
| 80.0% |
Loan TypeThe type of loan (e.g., fixed, adjustable).
Loan type:
| Amortizing |
TermThe loan repayment period in years.
Term:
| 30 years |
Interest RateThe percentage a lender charges on the borrowed amount of a loan, determining the cost of borrowing money.
Interest rate:
| 6.625% |
Principal & Interest (PI)The principal is the portion of the loan payment that reduces the loan balance. The interest is the lender's charge for borrowing money. Calculation:(P * r * (1 + r) ** n) / ((1 + r) ** n - 1) Where:
P = Loan amount (principal)
Principal & interest:
| $2,202 |
Property TaxesAnnual taxes levied by local governments on real estate properties. These taxes fund public services like schools, roads, and emergency services.
Property tax:
| $196 |
InsuranceThe costs for insurance coverage to protect against financial losses due to risks like fire, natural disasters, theft, liability, or tenant-related damages. Calculation:Assumes 7% of gross rental income, unless insurance rates are specified.
Insurance:
| $217 |
Private Mortgage Insurance (PMI)A fee that borrowers pay when they take out a conventional loan with a loan-to-value (LTV) ratio above 80%.
Private mortgage insurance (PMI):
| $0 |
Monthly PaymentThe fixed amount a borrower pays each month to repay a loan. It typically includes principal and interest (P&I) and may also cover property taxes, insurance, HOA fees, and PMI if escrowed. Monthly payment:
| $2,615 |
Operating Income
| % Rent | Monthly | Yearly | |
|---|---|---|---|
Gross RentThe total rental income received from tenants before deducting any expenses. Includes base rent, late fees, pet fees, parking fees, and other recurring charges.
Gross rent:
| $3,100 | $37,200 | |
Vacancy LossExpected loss of rent due to vacancies.
Vacancy loss:
(6%)
| 6% | -$186 | -$2,232 |
Operating IncomeGross rental income minus vacancy loss. Calculation:Gross rent - Vacancy loss
Operating income:
| $2,914 | $34,968 |
Operating Expenses
| % Rent | Monthly | Yearly | |
|---|---|---|---|
Property TaxesAnnual taxes levied by local governments on real estate properties. These taxes fund public services like schools, roads, and emergency services. | 6% | -$196 | -$2,355 |
InsuranceThe costs for insurance coverage to protect against financial losses due to risks like fire, natural disasters, theft, liability, or tenant-related damages. Calculation:Assumes 7% of gross rental income, unless insurance rates are specified. | 7% | -$217 | -$2,604 |
Property ManagementThe costs associated with hiring a property manager to handle the day-to-day operations of a rental property. Includes management fees, leasing fes, eviction fees, etc. Calculation:Assumes 8% of gross rental income. | 8% | -$248 | -$2,976 |
Repairs & MaintenanceOngoing costs for routine upkeep and minor fixes needed to keep a property in good working condition. Calculation:Assumes 5% of gross rental income. Varies by property age and condition. | 5% | -$155 | -$1,860 |
Capital ExpensesLarge, infrequent costs for major improvements or replacements, like a new roof, HVAC system, or appliances. Calculation:Assumes 5% of gross rental income. Varies by property age. | 5% | -$155 | -$1,860 |
HOA FeesRegular dues paid to a Homeowners Association for community maintenance, amenities, and management. Similar fees include: Condo Association Fees, Co-op Maintenance Fees, etc. | n/a | n/a | n/a |
Operating ExpensesRecurring costs required to maintain and manage a rental property, including property taxes, insurance, maintenance, repairs, utilities (if paid by the owner), property management fees, and other day-to-day expenses. Calculation:Insurance + Property Taxes + Property Management + Repairs & Maintenance + Capital Expenditures + HOA Fees | 31% | -$971 | -$11,655 |
Cash Flow
| Monthly | Yearly | |
|---|---|---|
Net Operating Income (NOI)The income generated from a property after deducting all operating expenses but before deducting mortgage payments, taxes, and capital expenditures. Calculation:Gross Operating Income - Operating Expenses
Net operating income:
| $1,943 | $23,316 |
Mortgage PaymentThe fixed amount a borrower pays each month to repay a loan. It typically includes principal and interest (P&I) and may also cover property taxes, insurance, HOA fees, and PMI if escrowed. | -$2,202 | -$26,424 |
Cash FlowNet Operating Income (NOI) minus mortgage payments. Calculation:NOI - Mortgage Payments | $259 | $3,108 |