
$764,900
Investment Summary
- Monthly Cash Flow
- -$1,826
- Cap Rate
- 3.3%
- Cash-on-Cash Return
- -12.5%
- Debt Coverage Ratio
- 0.53
- Internal Rate of Return (5 years)
- -8.1%
Cash Flow
Net Operating Income (NOI) minus mortgage payments.
Calculation:
NOI - Mortgage Payments
Cap Rate (Market Value)
Capitalization Rate is a rate of return that compares the yearly Net Operating Income (NOI) to the market value.
Calculation:
NOI / Market Value
Cash-on-Cash Return (CoC)
Annual Cash Flow / Cash Invested
Calculation:
Annual cash flow divided by initial cash invested.
Debt Coverage Ratio (DCR)
Net Operating Income (NOI) divided by total debt payments.
Calculation:
NOI / Total Debt Payments
Internal Rate of Return (IRR)
A metric for assessing profitability over time. IRR is the discount rate at which the net present value (NPV) of all future cash flows (positive and negative) from an investment equals zero — including both periodic cash flow (such as rent) and a projected sale at the end of the holding period. It represents the expected annualized return, accounting for income, expenses, and the recovery of capital through a future sale.
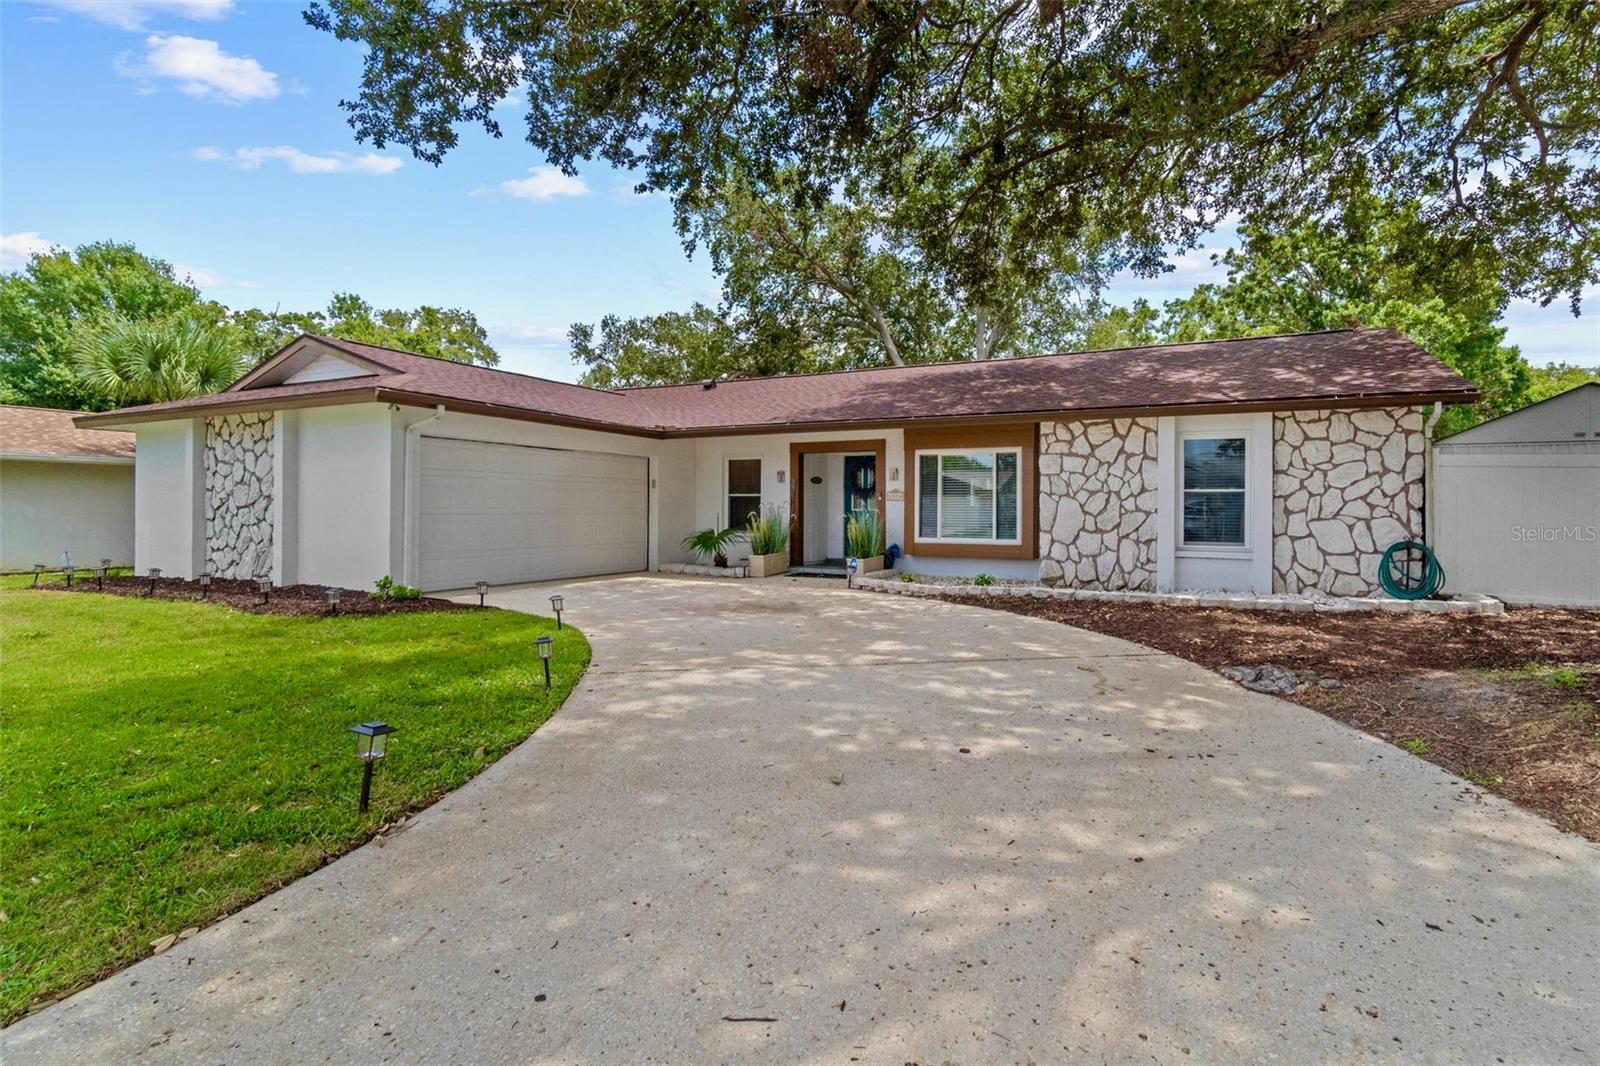
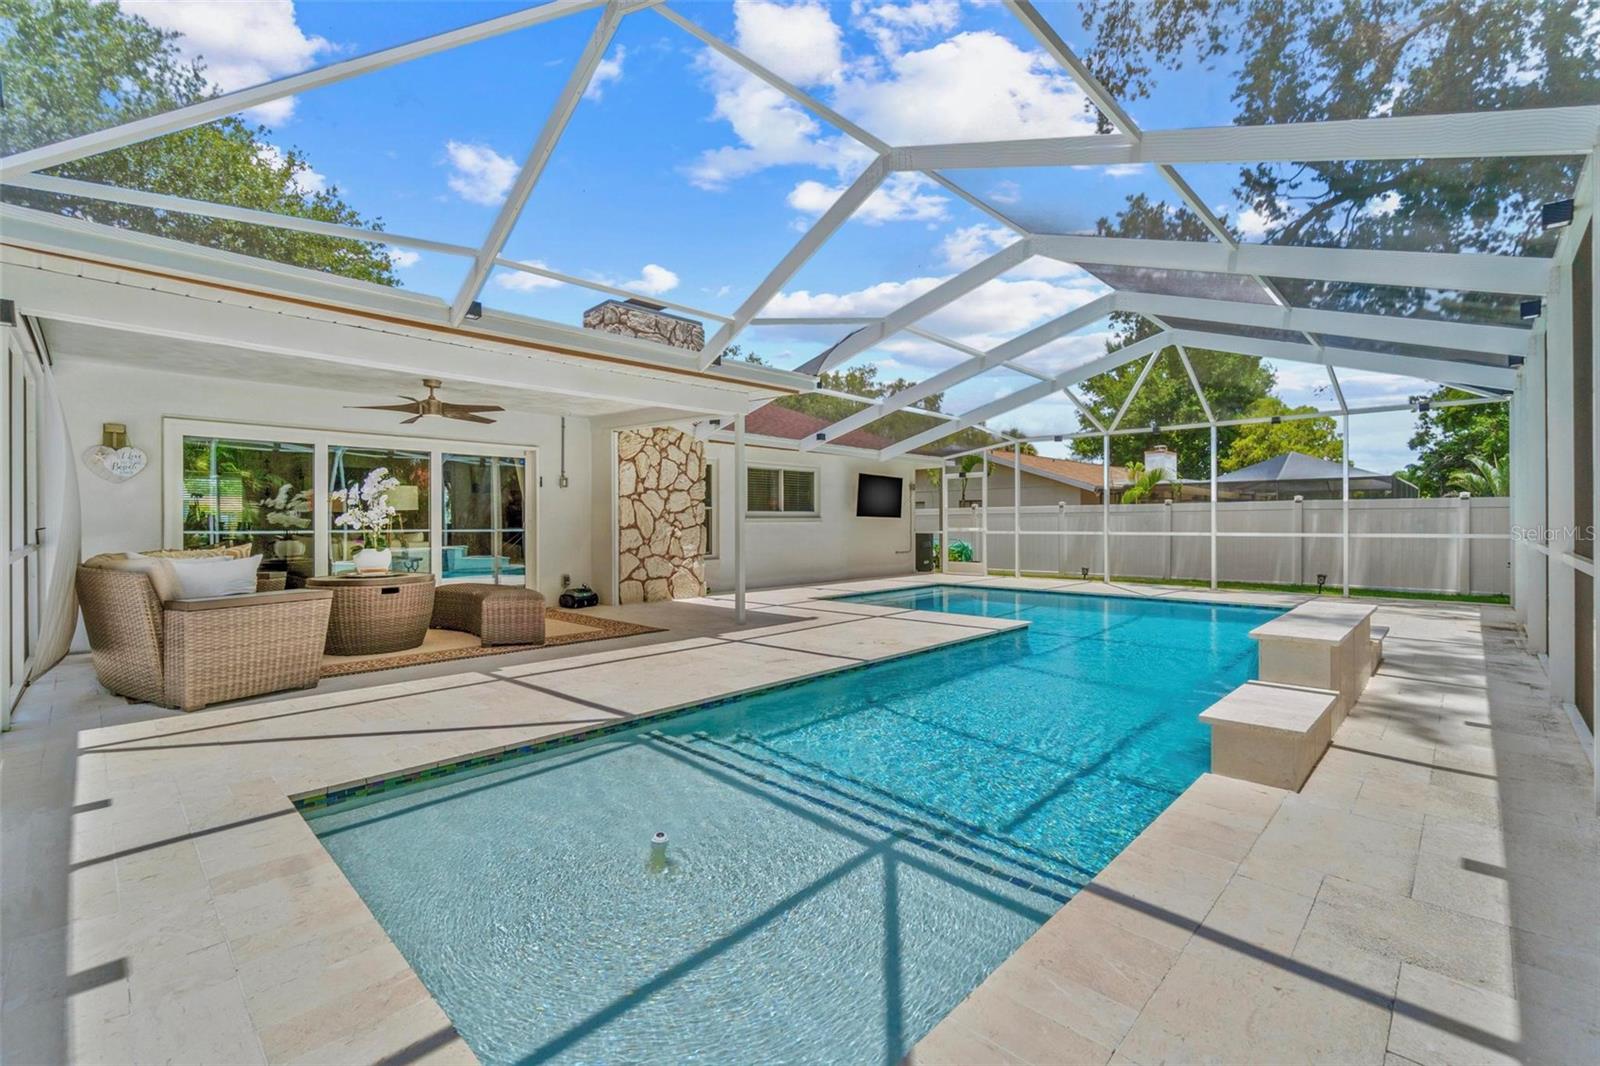
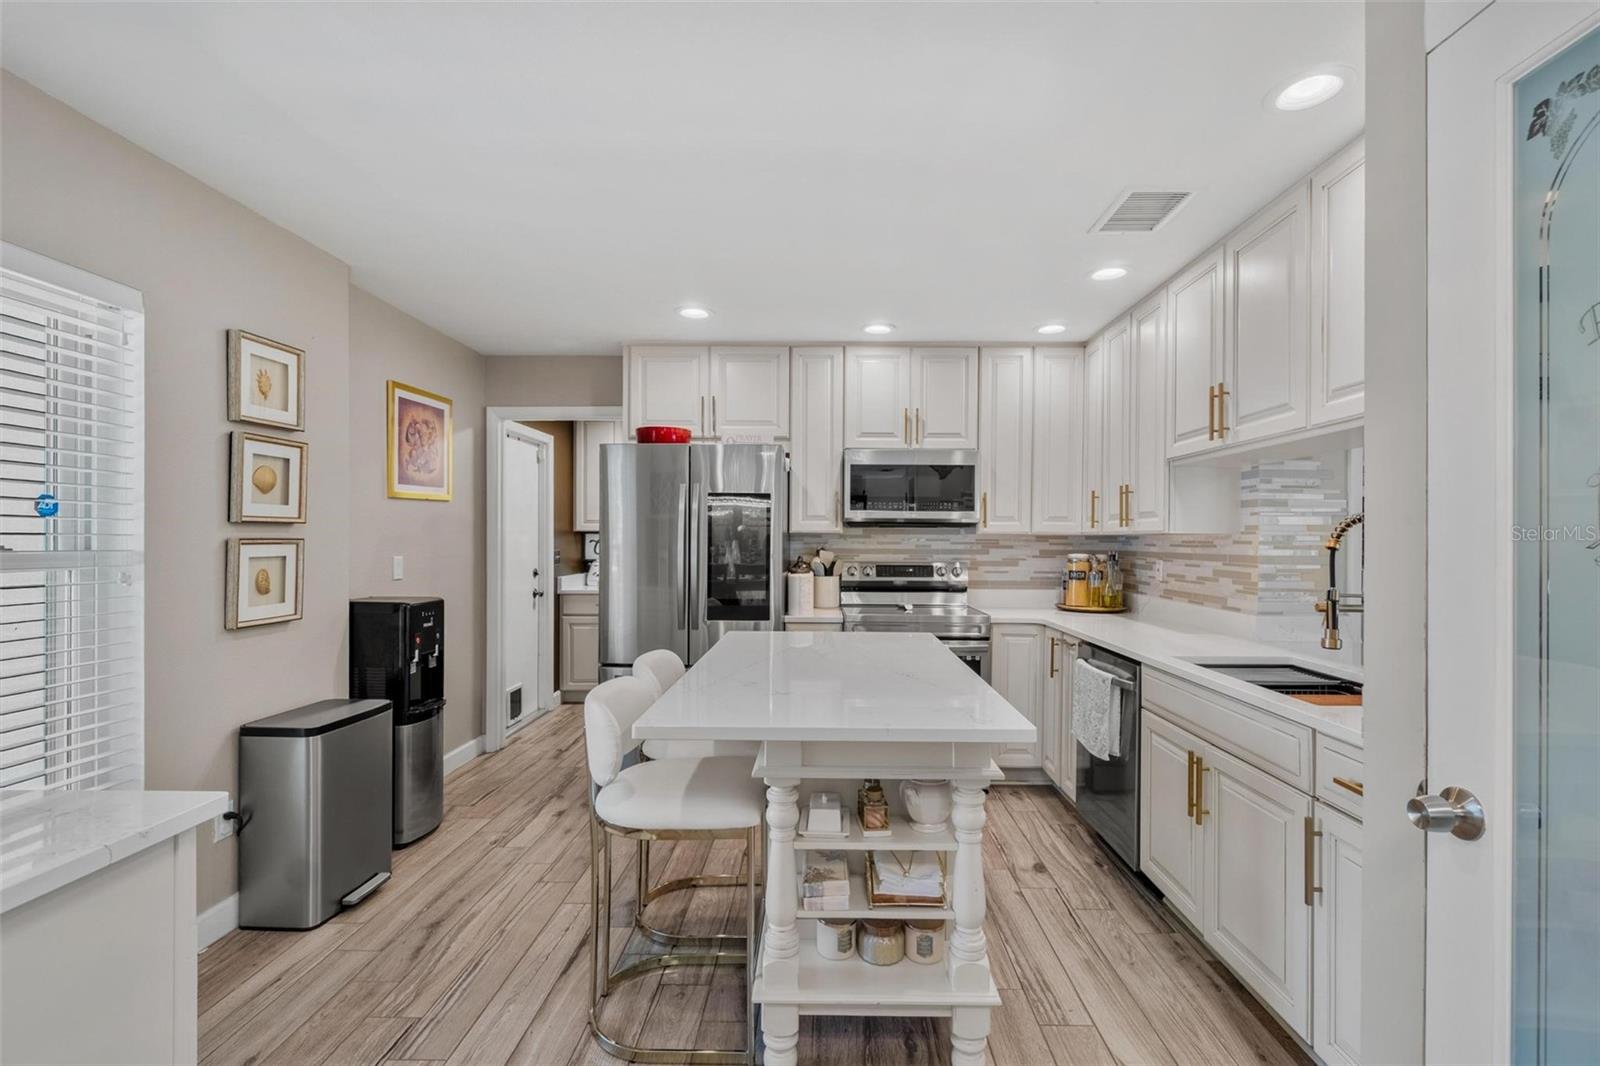
Property Description
Welcome to your dream pool home in the sought-after Rustic Oaks community, perfectly situated within the highly desirable Palm Harbor University school zone. This immaculate, fully remodeled residence impresses from the moment you arrive, boasting gorgeous curb appeal with stone accents, fresh landscaping with in-ground irrigation, and a side-load garage. The home is located on one of the highest streets in the area – 65 feet above sea level in flood zone X – providing peace of mind that you’re high and dry, with no flood insurance required. Step inside to discover a thoughtfully designed open-concept floor plan featuring a spacious great room layout with soaring cathedral ceilings, a cozy wood-burning fireplace, and split bedrooms for privacy. The gourmet kitchen is truly the heart of the home, showcasing elegant Thomasville custom cabinetry, granite countertops, a brand-new island, beverage station, and top-of-the-line Samsung Smart Hub stainless steel appliances – including a French door smart refrigerator and double oven range. Quartz crystal chandeliers accent the expansive living and dining areas, perfect for entertaining. The primary suite is a peaceful retreat with a large walk-in closet and luxurious en suite bathroom. Additional bedrooms are generously sized, offering flexibility for family, guests, or a home office. Enjoy resort-style living in your private backyard oasis featuring a screen-enclosed lanai with light travertine tile, a stunning temperature-controlled saltwater pool, and a brand-new paved patio area – ideal for outdoor dining and entertaining under the Florida sun. The fully automated smart home system includes a Ring doorbell camera, Honeywell Wi-Fi thermostat, ADT Pulse security system with front and backyard cameras, and hurricane-impact windows and sliders (installed 2012, lifetime warranty). Recent updates provide peace of mind and modern comfort, including a new roof (2023), electrical panel (2016), Tesla/EV charger, new water softener salt system (2022), and high-efficiency Thermau heater with Pentair pool equipment and rain monitor sensor. The upgraded garage adds 400 sq ft of heated space – perfect for an office, gym, or flex space – with a new split A/C unit with heat, a new app-controlled garage door opener, and new attic. And the location can’t be beat – just 5 miles from the beach, 2 miles to Ozona, 30 minutes to Weeki Wachee, and close to downtown Palm Harbor, Safety Harbor, St. Pete/Clearwater Airport, and the new Trader Joe’s. This home offers luxury, comfort, and security with no flood insurance required – and even stays powered during storms thanks to newly upgraded electrical lines. Schedule your private showing today and come experience the best of Palm Harbor living.
Build Your Team
Quickly find investor-friendly professionals who can help you succeed in real estate investing at any stage of the investing journey.


Agents
Match with investor-friendly agents who can help you find, analyze, and close your next deal


Lenders
Get the best funding…find investor-friendly lenders who specialize in your deal strategy


Property Managers
Transition to passive investing. Find a trusted property management partnership that lasts.


Tax Pros & Accountants
Taxes and financial reporting made easy—find experts to create tax savings strategies, file taxes, and more
Location
Property Details
Parking
- Description: Garage
- Details: Driveway, Electric Vehicle Charging Station(s), Garage Door Opener, Garage Faces Side, Attached
- Garage Spaces: 2
- Spaces Total: 0
Bedroom Information
- # of Bedrooms: 3
Bathroom Information
- # of Baths (Full): 2
- # of Baths (Total): 2.0
Interior Features
- # of Rooms: 4
- # of Stories: 1
- Fireplace: Yes
Exterior Features
- Exterior Walls Materials: Stucco
- Foundation: Slab
- Roof Type: Gable
- Roof Material: Shingle
- Pool: Yes
Land Information
- Land Use: Residential
- Land Use Subtype: Single Family Residential
Lot Information
- Parcel ID: 052816776420000910
- Lot Size: 9997 sqft
Property Information
- Property Type: Single Family Residence
- Year Built: 1981
Tax Information
- Annual Tax: $4,699
Utilities
- Water & Sewer: Public
- Heating: Central, Electric
- Cooling: Central Air, Ductless
Location
- County: Pinellas
Listing Details
Investment Summary
- Monthly Cash Flow
- -$1,826
- Cap Rate
- 3.3%
- Cash-on-Cash Return
- -12.5%
- Debt Coverage Ratio
- 0.53
- Internal Rate of Return (5 years)
- -8.1%
Cash Flow
Net Operating Income (NOI) minus mortgage payments.
Calculation:
NOI - Mortgage Payments
Cap Rate (Market Value)
Capitalization Rate is a rate of return that compares the yearly Net Operating Income (NOI) to the market value.
Calculation:
NOI / Market Value
Cash-on-Cash Return (CoC)
Annual Cash Flow / Cash Invested
Calculation:
Annual cash flow divided by initial cash invested.
Debt Coverage Ratio (DCR)
Net Operating Income (NOI) divided by total debt payments.
Calculation:
NOI / Total Debt Payments
Internal Rate of Return (IRR)
A metric for assessing profitability over time. IRR is the discount rate at which the net present value (NPV) of all future cash flows (positive and negative) from an investment equals zero — including both periodic cash flow (such as rent) and a projected sale at the end of the holding period. It represents the expected annualized return, accounting for income, expenses, and the recovery of capital through a future sale.
Purchase Details
Purchase PriceThe price paid for the property. Purchase price:
| $764,900 |
|---|---|
Amount FinancedThe amount of the purchase financed through a loan. Amount financed:
| -$611,920 |
Down paymentThe initial payment made towards the purchase. Down payment:
| $152,980 |
Closing CostsFees and expenses associated with purchasing a property, typically ranging from 2% to 5% of the home’s purchase price, paid at the end of a home purchase to cover services like lending, title transfer, and taxes. Closing costs:
| $22,947 |
Rehab CostsCosts incurred to repair or improve the property, including: roof, flooring, exterior siding, kitchen, exterior paint, bathrooms, etc. Rehab costs:
| $0 |
Initial Cash InvestedThe total initial cash invested in the property. Calculation:Down payment + Buying costs + Rehab costs Initial cash invested:
| $175,927 |
Square Feet (SQFT)The total square footage of the property. Square feet:
| 2,036 |
Cost Per Square FootCost per square foot of the property. Calculation:Purchase Price / Square Feet Cost per square foot:
| $376 |
Monthly Rent Per Square FootMonthly rent divided by the number of square feet. This ratio helps investors compare rental income efficiency across properties, markets, and unit sizes Calculation:Monthly Rent / Square Feet Monthly rent per square foot:
| $1.77 |
Financing Details
Loan AmountThe total sum of money borrowed from a lender to finance a property purchase. Calculation:Purchase Price - Down Payment
Loan amount:
| $611,920 |
|---|---|
Loan to Value Ratio (LTV)Loan amount divided by the market value of the property. Calculation:Loan Amount / Market Value
Loan to value ratio:
| 80.0% |
Loan TypeThe type of loan (e.g., fixed, adjustable).
Loan type:
| Amortizing |
TermThe loan repayment period in years.
Term:
| 30 years |
Interest RateThe percentage a lender charges on the borrowed amount of a loan, determining the cost of borrowing money.
Interest rate:
| 6.625% |
Principal & Interest (PI)The principal is the portion of the loan payment that reduces the loan balance. The interest is the lender's charge for borrowing money. Calculation:(P * r * (1 + r) ** n) / ((1 + r) ** n - 1) Where:
P = Loan amount (principal)
Principal & interest:
| $3,918 |
Property TaxesAnnual taxes levied by local governments on real estate properties. These taxes fund public services like schools, roads, and emergency services.
Property tax:
| $392 |
InsuranceThe costs for insurance coverage to protect against financial losses due to risks like fire, natural disasters, theft, liability, or tenant-related damages. Calculation:Assumes 7% of gross rental income, unless insurance rates are specified.
Insurance:
| $252 |
Private Mortgage Insurance (PMI)A fee that borrowers pay when they take out a conventional loan with a loan-to-value (LTV) ratio above 80%.
Private mortgage insurance (PMI):
| $0 |
Monthly PaymentThe fixed amount a borrower pays each month to repay a loan. It typically includes principal and interest (P&I) and may also cover property taxes, insurance, HOA fees, and PMI if escrowed. Monthly payment:
| $4,562 |
Operating Income
| % Rent | Monthly | Yearly | |
|---|---|---|---|
Gross RentThe total rental income received from tenants before deducting any expenses. Includes base rent, late fees, pet fees, parking fees, and other recurring charges.
Gross rent:
| $3,600 | $43,200 | |
Vacancy LossExpected loss of rent due to vacancies.
Vacancy loss:
(6%)
| 6% | -$216 | -$2,592 |
Operating IncomeGross rental income minus vacancy loss. Calculation:Gross rent - Vacancy loss
Operating income:
| $3,384 | $40,608 |
Operating Expenses
| % Rent | Monthly | Yearly | |
|---|---|---|---|
Property TaxesAnnual taxes levied by local governments on real estate properties. These taxes fund public services like schools, roads, and emergency services. | 11% | -$392 | -$4,699 |
InsuranceThe costs for insurance coverage to protect against financial losses due to risks like fire, natural disasters, theft, liability, or tenant-related damages. Calculation:Assumes 7% of gross rental income, unless insurance rates are specified. | 7% | -$252 | -$3,024 |
Property ManagementThe costs associated with hiring a property manager to handle the day-to-day operations of a rental property. Includes management fees, leasing fes, eviction fees, etc. Calculation:Assumes 8% of gross rental income. | 8% | -$288 | -$3,456 |
Repairs & MaintenanceOngoing costs for routine upkeep and minor fixes needed to keep a property in good working condition. Calculation:Assumes 5% of gross rental income. Varies by property age and condition. | 5% | -$180 | -$2,160 |
Capital ExpensesLarge, infrequent costs for major improvements or replacements, like a new roof, HVAC system, or appliances. Calculation:Assumes 5% of gross rental income. Varies by property age. | 5% | -$180 | -$2,160 |
HOA FeesRegular dues paid to a Homeowners Association for community maintenance, amenities, and management. Similar fees include: Condo Association Fees, Co-op Maintenance Fees, etc. | n/a | n/a | n/a |
Operating ExpensesRecurring costs required to maintain and manage a rental property, including property taxes, insurance, maintenance, repairs, utilities (if paid by the owner), property management fees, and other day-to-day expenses. Calculation:Insurance + Property Taxes + Property Management + Repairs & Maintenance + Capital Expenditures + HOA Fees | 36% | -$1,292 | -$15,499 |
Cash Flow
| Monthly | Yearly | |
|---|---|---|
Net Operating Income (NOI)The income generated from a property after deducting all operating expenses but before deducting mortgage payments, taxes, and capital expenditures. Calculation:Gross Operating Income - Operating Expenses
Net operating income:
| $2,092 | $25,104 |
Mortgage PaymentThe fixed amount a borrower pays each month to repay a loan. It typically includes principal and interest (P&I) and may also cover property taxes, insurance, HOA fees, and PMI if escrowed. | -$3,918 | -$47,016 |
Cash FlowNet Operating Income (NOI) minus mortgage payments. Calculation:NOI - Mortgage Payments | $1,826 | $21,912 |