$895,000
Investment Summary
- Monthly Cash Flow
- -$2,901
- Cap Rate
- 1.8%
- Cash-on-Cash Return
- -16.9%
- Debt Coverage Ratio
- 0.31
- Internal Rate of Return (5 years)
- -12.3%
Cash Flow
Net Operating Income (NOI) minus mortgage payments.
Calculation:
NOI - Mortgage Payments
Cap Rate (Market Value)
Capitalization Rate is a rate of return that compares the yearly Net Operating Income (NOI) to the market value.
Calculation:
NOI / Market Value
Cash-on-Cash Return (CoC)
Annual Cash Flow / Cash Invested
Calculation:
Annual cash flow divided by initial cash invested.
Debt Coverage Ratio (DCR)
Net Operating Income (NOI) divided by total debt payments.
Calculation:
NOI / Total Debt Payments
Internal Rate of Return (IRR)
A metric for assessing profitability over time. IRR is the discount rate at which the net present value (NPV) of all future cash flows (positive and negative) from an investment equals zero — including both periodic cash flow (such as rent) and a projected sale at the end of the holding period. It represents the expected annualized return, accounting for income, expenses, and the recovery of capital through a future sale.
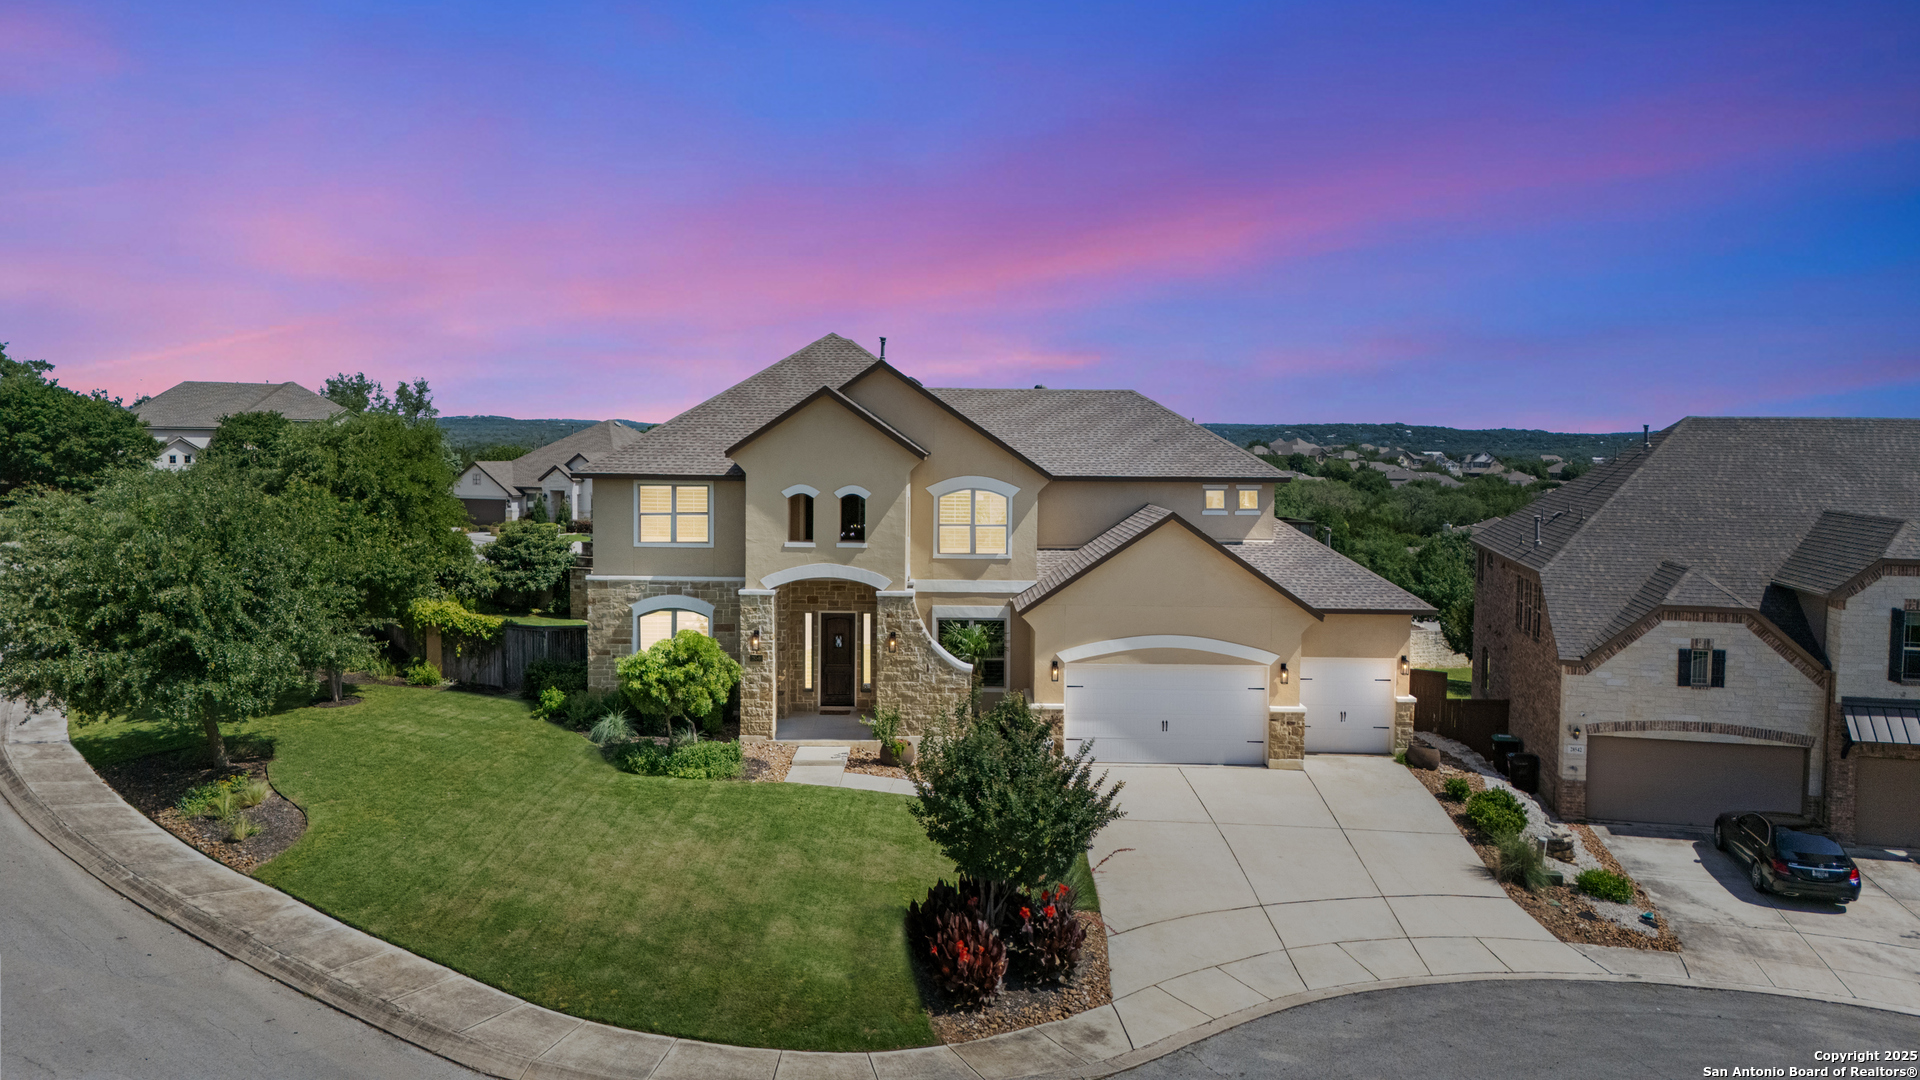
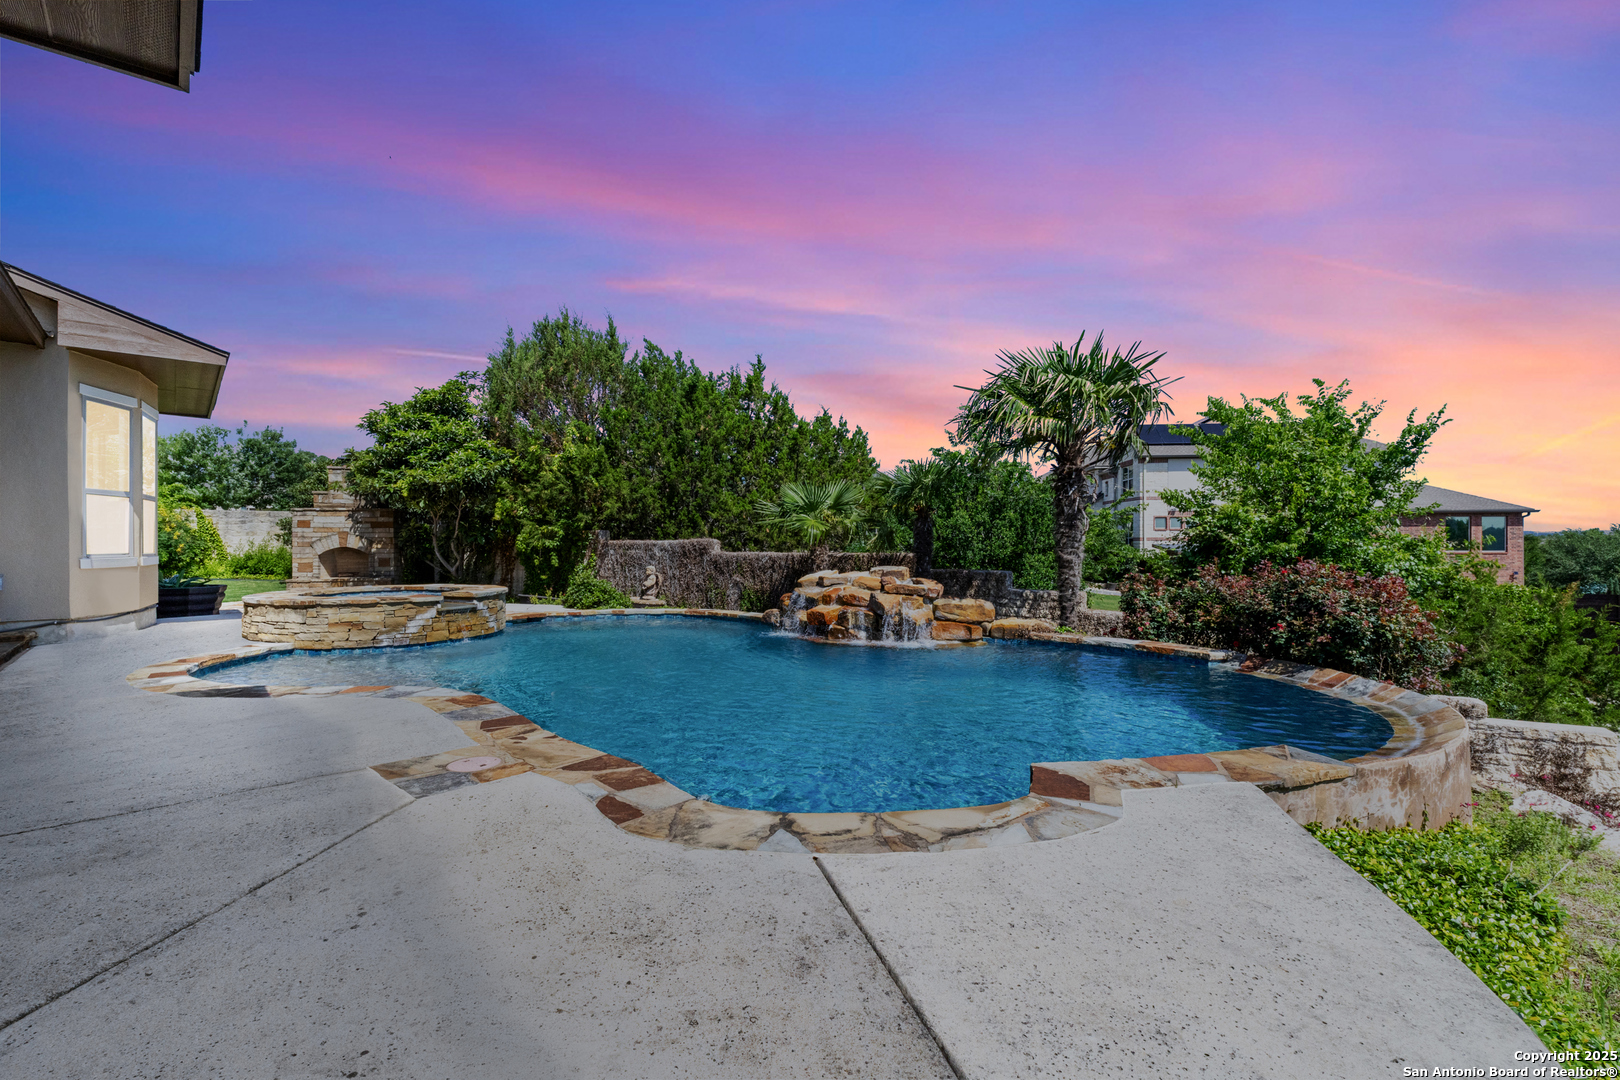
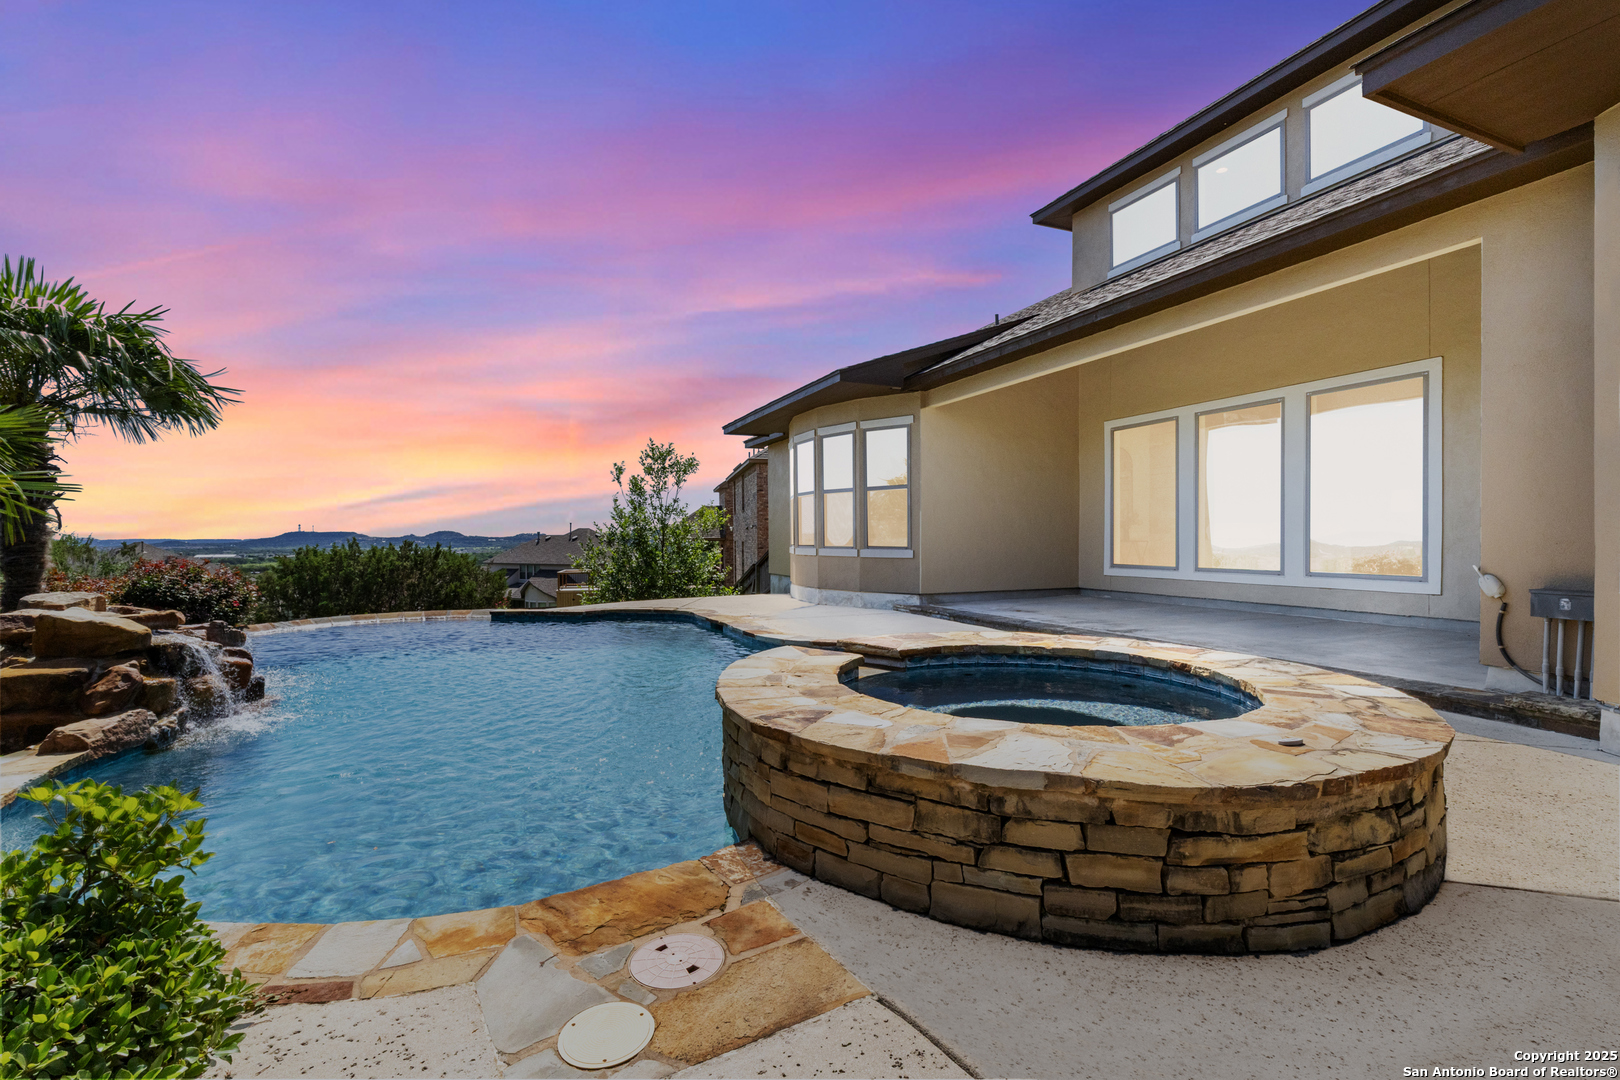
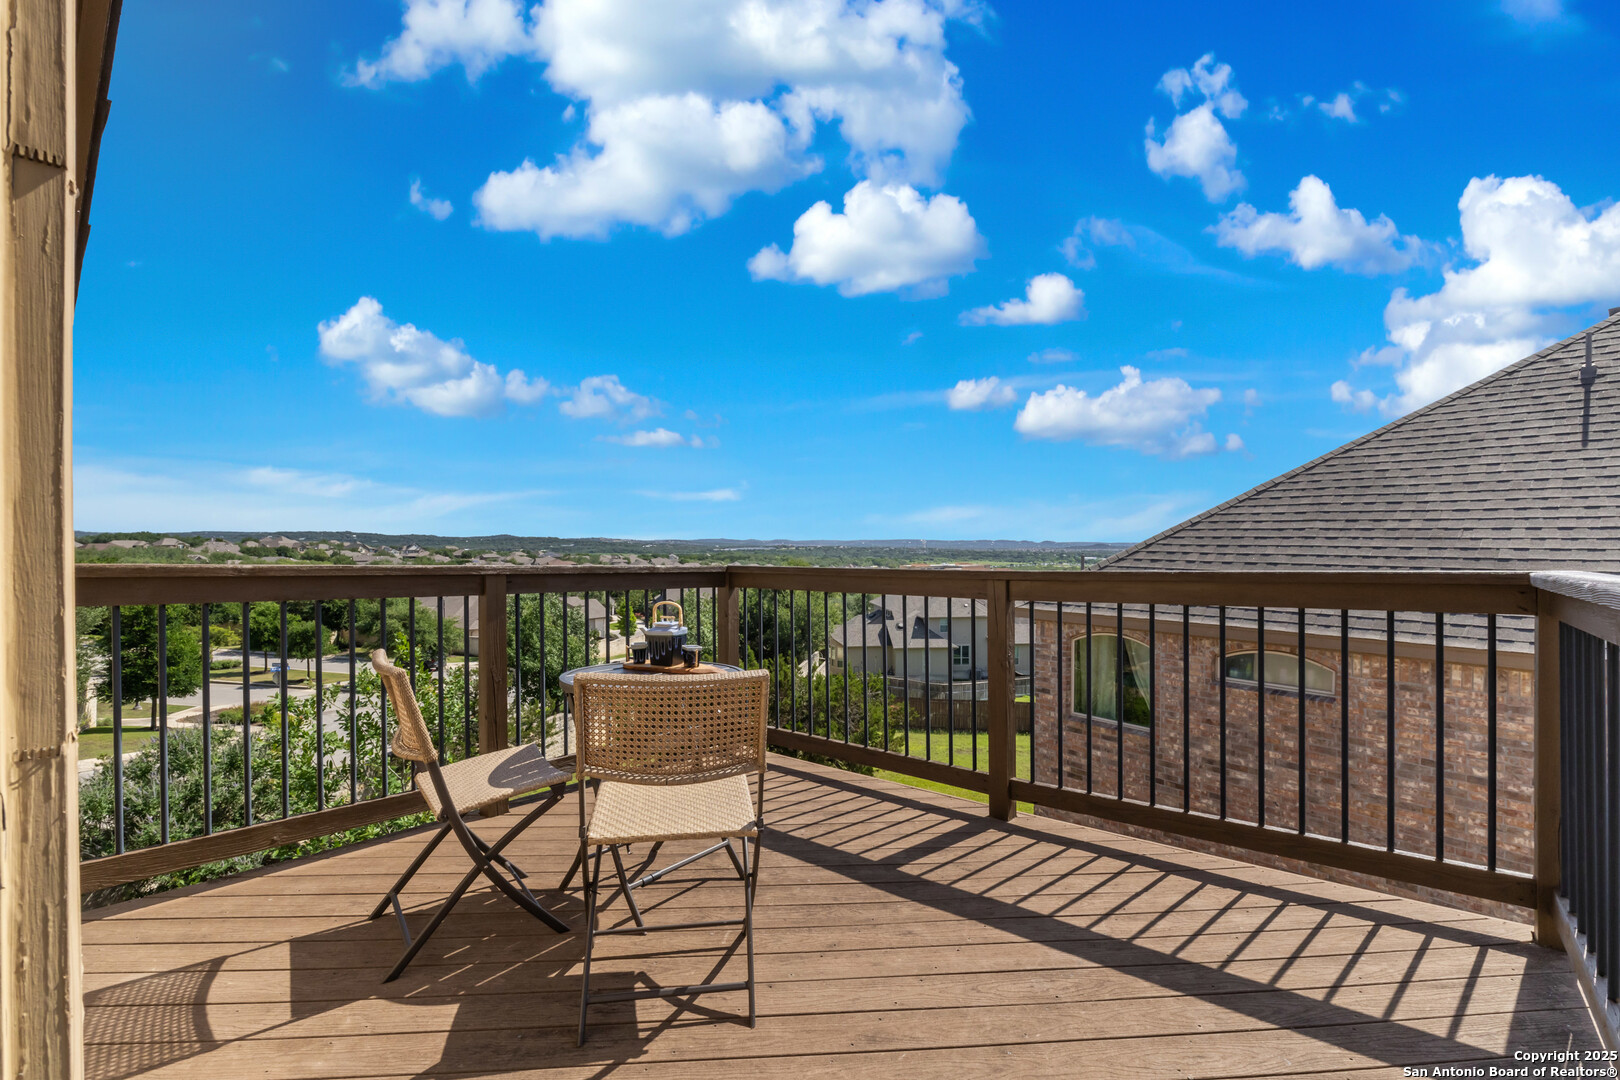
Property Description
Luxury Living with Hill Country Views at an amazing price!!! Welcome to this stunning Monticello-built masterpiece, on an oversized corner lot at the top of the hill in the prestigious gated community of Hastings Ridge at Kinder Ranch. With unparalleled views, this 5-bedroom, 4-bathroom home offers 4,319 sq ft of thoughtfully designed space where elegance meets everyday comfort. As you approach the home, you're immediately welcomed by a beautifully landscaped front yard featuring lush Zoysia grass, mature crepe myrtle trees, and stately potted plants, all maintained by a full irrigation system-a true first impression of elegance and care. Upon entering, you're greeted by a grand foyer, a striking curved staircase, a private home office, and a formal dining room, setting the tone for the home's sophisticated character. Soaring 10-foot ceilings and an abundance of natural light carry you into the spacious living room-ideal for both entertaining guests and everyday relaxation. The gourmet kitchen is a chef's dream, showcasing high-end granite countertops, custom upgraded cabinetry, stone backsplash, gas cooking, and built-in appliances. You can also enjoy many family meals in the breakfast nook large enough for a 8 person table. The luxurious primary suite is your private sanctuary with sweeping Hill Country views, a spa-inspired bath featuring a mud-set walk-in shower, garden tub, dual vanities, and separate his-and-her closets. A large secondary bedroom and full bath on the main floor is perfect for multigenerational living or guests. Step outside to your private resort-style backyard oasis. Enjoy the large covered patio, outdoor stone fireplace, hot tub, and in-ground pool. This yard is perfect for relaxing evenings or lively gatherings. Don't miss the second-floor "Eagle's Nest" balcony, offering breathtaking panoramic views. Additional highlights include: wood and tile flooring throughout the first floor, a spacious game room with custom shuffleboard and darts, a separate media room with tv and surround sound, fitness equipment included, oversized laundry room with shelving and utility sink, drop zone off the oversized 3-car garage, two water heaters & two HVAC units, whole-home water filtration system, and custom shutters on all front-facing windows. Custom Hunter Douglas motorized shades available for all other windows in the home. This home is located in the highly acclaimed Comal ISD with the elementary, middle and high school that services the neighborhood all within walking distance. Just minutes from Hwy 281, top-tier shopping, dining, and all that North San Antonio has to offer. Hastings Ridge also features fantastic community amenities to include a pool, playground, basketball court, and scenic walking/jogging trails.
Build Your Team
Quickly find investor-friendly professionals who can help you succeed in real estate investing at any stage of the investing journey.


Agents
Match with investor-friendly agents who can help you find, analyze, and close your next deal


Lenders
Get the best funding…find investor-friendly lenders who specialize in your deal strategy


Property Managers
Transition to passive investing. Find a trusted property management partnership that lasts.


Tax Pros & Accountants
Taxes and financial reporting made easy—find experts to create tax savings strategies, file taxes, and more
Location
Property Details
Parking
- Description: Attached Garage
- Details: Garage Door Opener, Oversized, Attached
- Garage Spaces: 3
- Spaces Total: 0
Bedroom Information
- # of Bedrooms: 5
Bathroom Information
- # of Baths (Full): 4
- # of Baths (Total): 4.0
Interior Features
- # of Stories: 2
- Fireplace: Yes
Exterior Features
- Foundation: Slab
- Roof Material: Composition
- Pool: Yes
HOA
- Has HOA: Yes
- Association: HASTINGS RIDGE AT KINDER RANCH
- HOA Fee: $315/quarterly
Land Information
- Land Use: Residential
- Land Use Subtype: Single Family Residential
Lot Information
- Parcel ID: 048542240400
- Lot Size: 0 sqft
Property Information
- Property Type: Single Family Residence
- Style: Two Story
- Year Built: 2014
Tax Information
- Annual Tax: $16,679
Utilities
- Heating: Central, Electric
- Cooling: Ceiling Fan(s), Central Air
Location
- County: Bexar
Listing Details
Investment Summary
- Monthly Cash Flow
- -$2,901
- Cap Rate
- 1.8%
- Cash-on-Cash Return
- -16.9%
- Debt Coverage Ratio
- 0.31
- Internal Rate of Return (5 years)
- -12.3%
Cash Flow
Net Operating Income (NOI) minus mortgage payments.
Calculation:
NOI - Mortgage Payments
Cap Rate (Market Value)
Capitalization Rate is a rate of return that compares the yearly Net Operating Income (NOI) to the market value.
Calculation:
NOI / Market Value
Cash-on-Cash Return (CoC)
Annual Cash Flow / Cash Invested
Calculation:
Annual cash flow divided by initial cash invested.
Debt Coverage Ratio (DCR)
Net Operating Income (NOI) divided by total debt payments.
Calculation:
NOI / Total Debt Payments
Internal Rate of Return (IRR)
A metric for assessing profitability over time. IRR is the discount rate at which the net present value (NPV) of all future cash flows (positive and negative) from an investment equals zero — including both periodic cash flow (such as rent) and a projected sale at the end of the holding period. It represents the expected annualized return, accounting for income, expenses, and the recovery of capital through a future sale.
Purchase Details
Purchase PriceThe price paid for the property. Purchase price:
| $895,000 |
|---|---|
Amount FinancedThe amount of the purchase financed through a loan. Amount financed:
| -$716,000 |
Down paymentThe initial payment made towards the purchase. Down payment:
| $179,000 |
Closing CostsFees and expenses associated with purchasing a property, typically ranging from 2% to 5% of the home’s purchase price, paid at the end of a home purchase to cover services like lending, title transfer, and taxes. Closing costs:
| $26,850 |
Rehab CostsCosts incurred to repair or improve the property, including: roof, flooring, exterior siding, kitchen, exterior paint, bathrooms, etc. Rehab costs:
| $0 |
Initial Cash InvestedThe total initial cash invested in the property. Calculation:Down payment + Buying costs + Rehab costs Initial cash invested:
| $205,850 |
Square Feet (SQFT)The total square footage of the property. Square feet:
| 4,319 |
Cost Per Square FootCost per square foot of the property. Calculation:Purchase Price / Square Feet Cost per square foot:
| $207 |
Monthly Rent Per Square FootMonthly rent divided by the number of square feet. This ratio helps investors compare rental income efficiency across properties, markets, and unit sizes Calculation:Monthly Rent / Square Feet Monthly rent per square foot:
| $0.95 |
Financing Details
Loan AmountThe total sum of money borrowed from a lender to finance a property purchase. Calculation:Purchase Price - Down Payment
Loan amount:
| $716,000 |
|---|---|
Loan to Value Ratio (LTV)Loan amount divided by the market value of the property. Calculation:Loan Amount / Market Value
Loan to value ratio:
| 80.0% |
Loan TypeThe type of loan (e.g., fixed, adjustable).
Loan type:
| Amortizing |
TermThe loan repayment period in years.
Term:
| 30 years |
Interest RateThe percentage a lender charges on the borrowed amount of a loan, determining the cost of borrowing money.
Interest rate:
| 5.875% |
Principal & Interest (PI)The principal is the portion of the loan payment that reduces the loan balance. The interest is the lender's charge for borrowing money. Calculation:(P * r * (1 + r) ** n) / ((1 + r) ** n - 1) Where:
P = Loan amount (principal)
Principal & interest:
| $4,235 |
Property TaxesAnnual taxes levied by local governments on real estate properties. These taxes fund public services like schools, roads, and emergency services.
Property tax:
| $1,390 |
InsuranceThe costs for insurance coverage to protect against financial losses due to risks like fire, natural disasters, theft, liability, or tenant-related damages. Calculation:Assumes 7% of gross rental income, unless insurance rates are specified.
Insurance:
| $287 |
Private Mortgage Insurance (PMI)A fee that borrowers pay when they take out a conventional loan with a loan-to-value (LTV) ratio above 80%.
Private mortgage insurance (PMI):
| $0 |
Monthly PaymentThe fixed amount a borrower pays each month to repay a loan. It typically includes principal and interest (P&I) and may also cover property taxes, insurance, HOA fees, and PMI if escrowed. Monthly payment:
| $5,912 |
Operating Income
| % Rent | Monthly | Yearly | |
|---|---|---|---|
Gross RentThe total rental income received from tenants before deducting any expenses. Includes base rent, late fees, pet fees, parking fees, and other recurring charges.
Gross rent:
| $4,100 | $49,200 | |
Vacancy LossExpected loss of rent due to vacancies.
Vacancy loss:
(6%)
| 6% | -$246 | -$2,952 |
Operating IncomeGross rental income minus vacancy loss. Calculation:Gross rent - Vacancy loss
Operating income:
| $3,854 | $46,248 |
Operating Expenses
| % Rent | Monthly | Yearly | |
|---|---|---|---|
Property TaxesAnnual taxes levied by local governments on real estate properties. These taxes fund public services like schools, roads, and emergency services. | 34% | -$1,390 | -$16,679 |
InsuranceThe costs for insurance coverage to protect against financial losses due to risks like fire, natural disasters, theft, liability, or tenant-related damages. Calculation:Assumes 7% of gross rental income, unless insurance rates are specified. | 7% | -$287 | -$3,444 |
Property ManagementThe costs associated with hiring a property manager to handle the day-to-day operations of a rental property. Includes management fees, leasing fes, eviction fees, etc. Calculation:Assumes 8% of gross rental income. | 8% | -$328 | -$3,936 |
Repairs & MaintenanceOngoing costs for routine upkeep and minor fixes needed to keep a property in good working condition. Calculation:Assumes 5% of gross rental income. Varies by property age and condition. | 5% | -$205 | -$2,460 |
Capital ExpensesLarge, infrequent costs for major improvements or replacements, like a new roof, HVAC system, or appliances. Calculation:Assumes 5% of gross rental income. Varies by property age. | 5% | -$205 | -$2,460 |
HOA FeesRegular dues paid to a Homeowners Association for community maintenance, amenities, and management. Similar fees include: Condo Association Fees, Co-op Maintenance Fees, etc. | 3% | -$105 | -$1,260 |
Operating ExpensesRecurring costs required to maintain and manage a rental property, including property taxes, insurance, maintenance, repairs, utilities (if paid by the owner), property management fees, and other day-to-day expenses. Calculation:Insurance + Property Taxes + Property Management + Repairs & Maintenance + Capital Expenditures + HOA Fees | 61% | -$2,520 | -$30,239 |
Cash Flow
| Monthly | Yearly | |
|---|---|---|
Net Operating Income (NOI)The income generated from a property after deducting all operating expenses but before deducting mortgage payments, taxes, and capital expenditures. Calculation:Gross Operating Income - Operating Expenses
Net operating income:
| $1,334 | $16,008 |
Mortgage PaymentThe fixed amount a borrower pays each month to repay a loan. It typically includes principal and interest (P&I) and may also cover property taxes, insurance, HOA fees, and PMI if escrowed. | -$4,235 | -$50,820 |
Cash FlowNet Operating Income (NOI) minus mortgage payments. Calculation:NOI - Mortgage Payments | -$2,901 | -$34,812 |