$1,450,000
Investment Summary
- Monthly Cash Flow
- -$4,436
- Cap Rate
- 2.5%
- Cash-on-Cash Return
- -16.0%
- Debt Coverage Ratio
- 0.40
- Internal Rate of Return (5 years)
- -11.4%
Cash Flow
Net Operating Income (NOI) minus mortgage payments.
Calculation:
NOI - Mortgage Payments
Cap Rate (Market Value)
Capitalization Rate is a rate of return that compares the yearly Net Operating Income (NOI) to the market value.
Calculation:
NOI / Market Value
Cash-on-Cash Return (CoC)
Annual Cash Flow / Cash Invested
Calculation:
Annual cash flow divided by initial cash invested.
Debt Coverage Ratio (DCR)
Net Operating Income (NOI) divided by total debt payments.
Calculation:
NOI / Total Debt Payments
Internal Rate of Return (IRR)
A metric for assessing profitability over time. IRR is the discount rate at which the net present value (NPV) of all future cash flows (positive and negative) from an investment equals zero — including both periodic cash flow (such as rent) and a projected sale at the end of the holding period. It represents the expected annualized return, accounting for income, expenses, and the recovery of capital through a future sale.
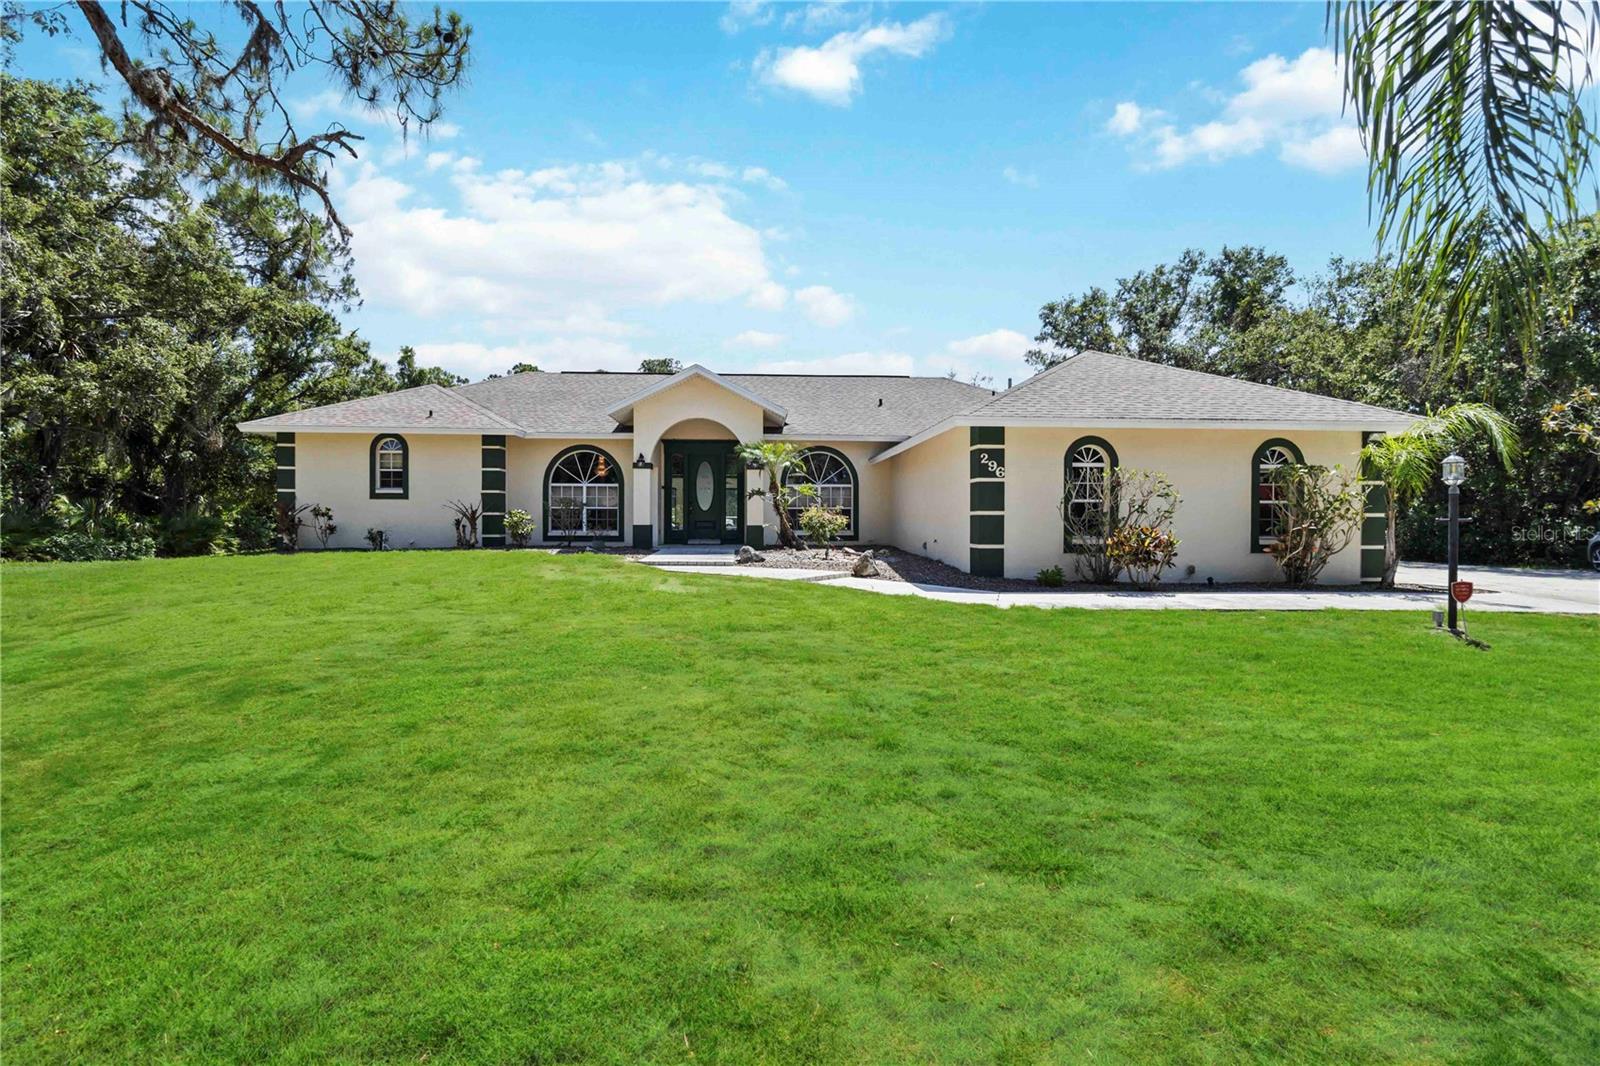
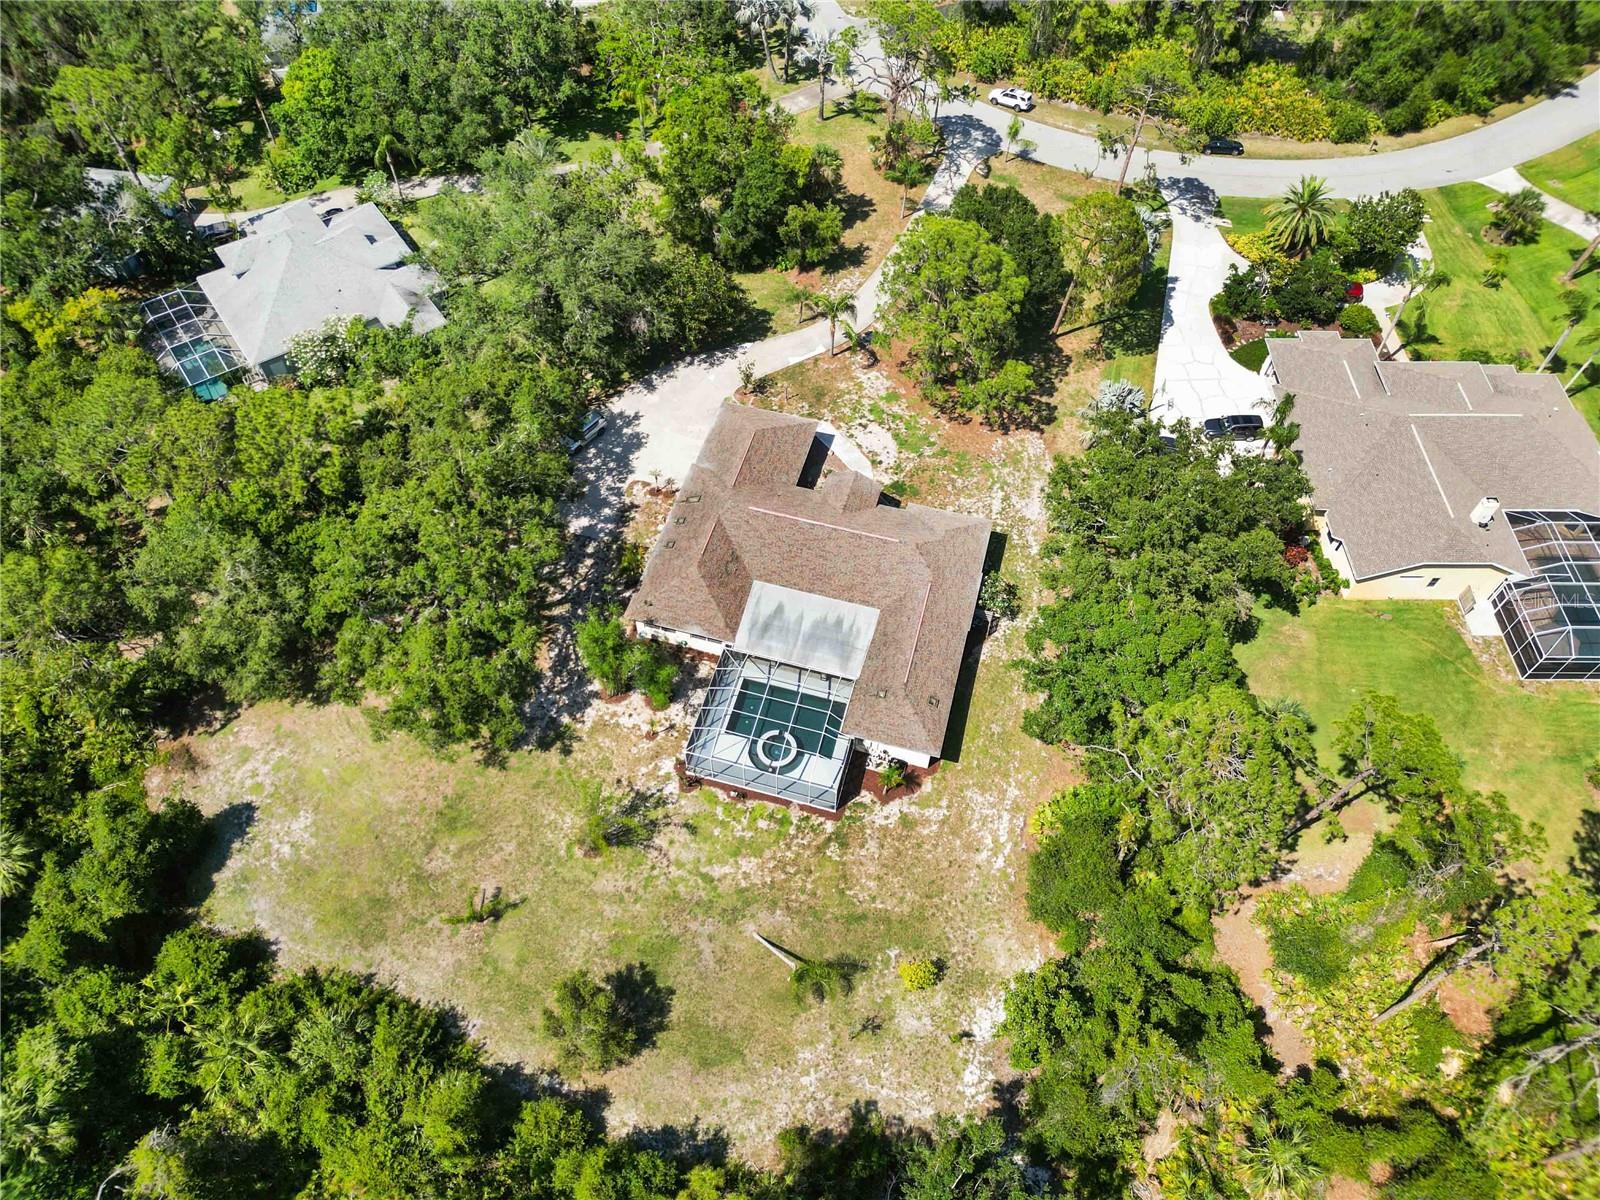
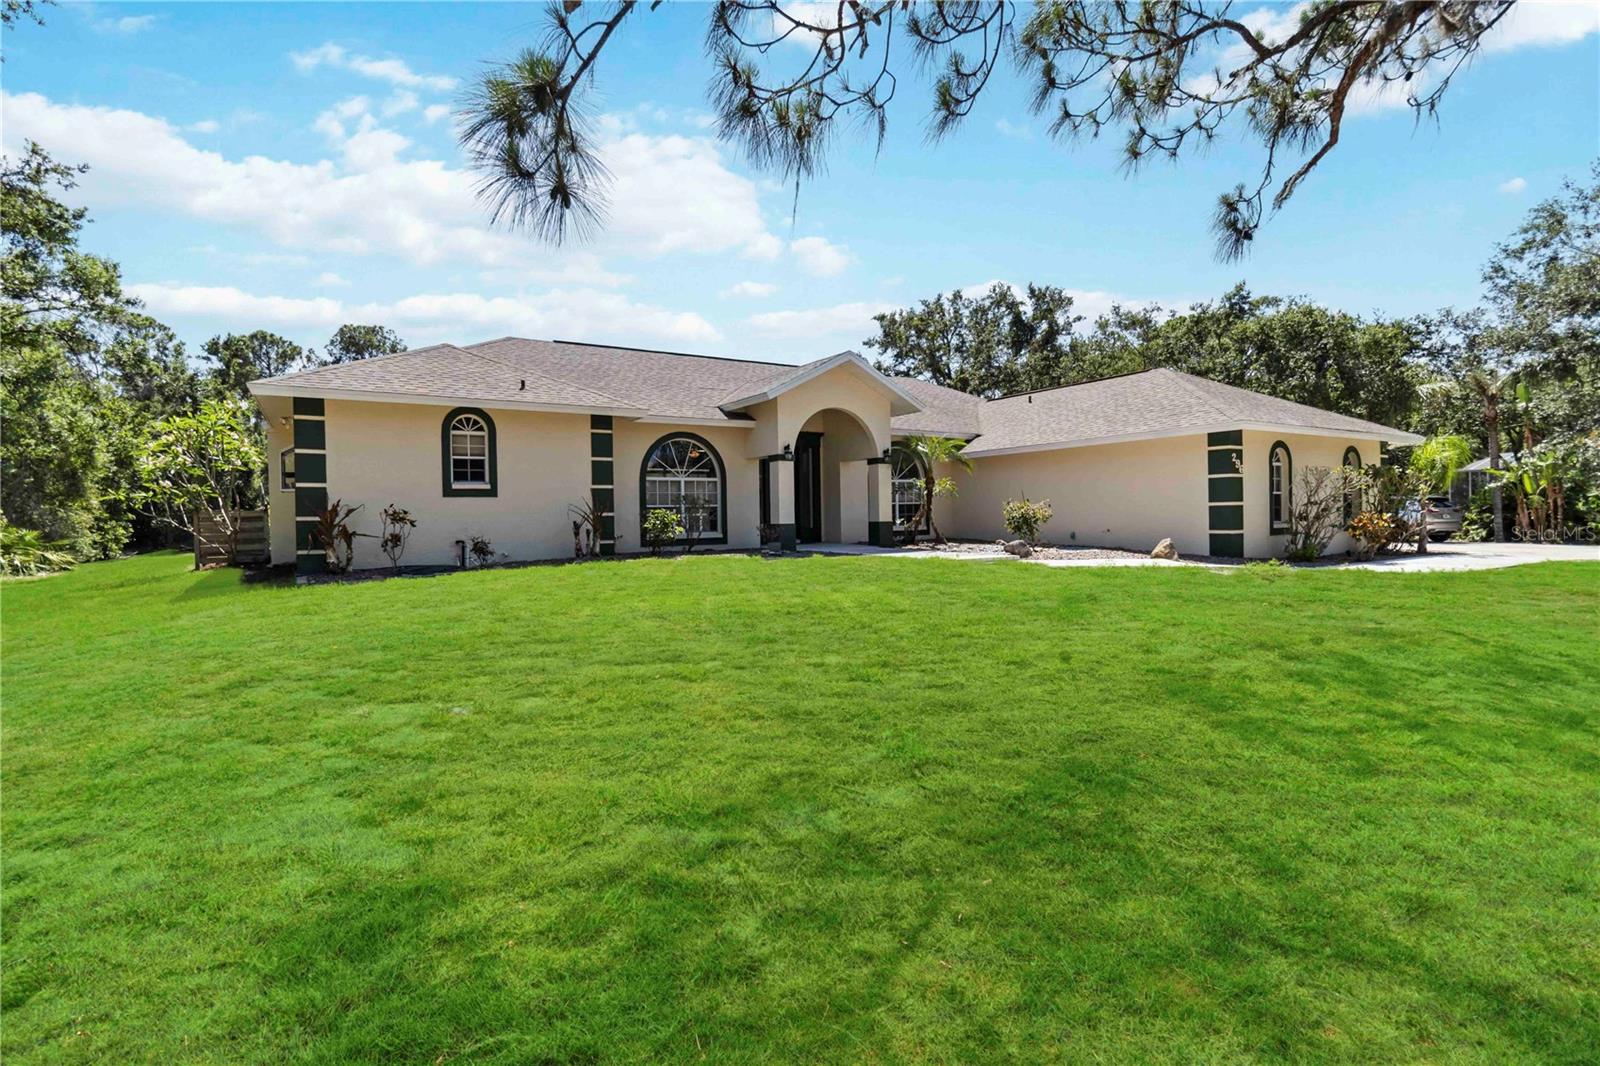
Property Description
**THIS PROPERTY QUALIFIES FOR A LENDER INCENTIVE (up to $8,000) IF USING PREFERRED LENDER. INQUIRE FOR MORE DETAILS.** & SELLER IS OFFERING A $25,000.00 CREDIT toward rate buy down/closing cost with acceptable contract. Welcome to your private retreat nestled in one of Osprey’s most desirable enclaves. This beautifully situated home rests on a lush greenbelt lot that borders the fairways of a nearby golf course, offering tranquil views and peaceful surroundings. With no rear neighbors, you'll enjoy the privacy and serenity that your 1 acre+ lot affords. Have a boat or RV? This community is deed restricted but there is plenty of space to build an oversized garage to house vehicles or create a dream workshop. Inside, you'll find a timeless blend of comfort and sophistication. The spacious interior boasts high ceilings, large windows that fill the rooms with natural light, and an open floorplan that seamlessly connects the living spaces. Nestled amid lush greenery and serene surroundings, this property stands out as more than just a house—it's a haven awaiting its next resident. Designed with both comfort and elegance in mind, every detail speaks to a lifestyle where relaxation and convenience coalesce effortlessly. Step inside, and you'll discover a space that beckons you to make it your own sanctuary. Located in a quiet, upscale neighborhood with a charming, country-like feel, this home is just minutes from everything that makes Sarasota County one of Florida’s most sought-after destinations. The world-renowned Nokomis Beach and Siesta Key, are a short drive away, offering sun, surf, and sand any time you desire. Pine View School, consistently ranked among the top public schools in the nation, is only a few minutes away. Outdoor enthusiasts will love the easy access to the Legacy Trail, a scenic multi-use path perfect for biking, running, and leisurely strolls through nature preserves. Whether you're looking to settle into a peaceful primary residence or seeking a second home close to golf, beaches, and top-tier schools, this home offers the perfect balance of nature, convenience, and lifestyle. The home features 5 bedroom and 3.5 bathrooms, and an oversized 2 car garage. The open concept floorplan and expansive covered patio are perfect for entertaining. The main master suite has vaulted ceilings, sliding glass doors leading to the pool and spa, an oversized walk-in closet, and the bathroom is plumbed for a soaker tub. On the other side of the home there are 4 more bedrooms, one of which also has an en-suite bathroom. For added peace of mind, this home comes with many newer updates such as: Roof 2016, Pool heater 2024, Septic tank 2024. Both HVAC units and Pentair pool Wi-Fi controlled equipment have been updated and home has been replumbed with CPVC. View the virtual tour or call today to schedule a showing before this home is gone!
Build Your Team
Quickly find investor-friendly professionals who can help you succeed in real estate investing at any stage of the investing journey.


Agents
Match with investor-friendly agents who can help you find, analyze, and close your next deal


Lenders
Get the best funding…find investor-friendly lenders who specialize in your deal strategy


Property Managers
Transition to passive investing. Find a trusted property management partnership that lasts.


Tax Pros & Accountants
Taxes and financial reporting made easy—find experts to create tax savings strategies, file taxes, and more
Location
Property Details
Parking
- Description: Attached Garage
- Details: Driveway, Garage Door Opener, Garage Faces Side, Attached
- Garage Spaces: 2
- Spaces Total: 0
Bedroom Information
- # of Bedrooms: 5
Bathroom Information
- # of Baths (Full): 3
- # of Baths (Partial): 1
- # of Baths (Total): 4.0
Interior Features
- # of Rooms: 13
- # of Stories: 1
Exterior Features
- Exterior Walls Materials: Stucco
- Foundation: Slab
- Roof Type: Hip
- Roof Material: Shingle
- Pool: Yes
HOA
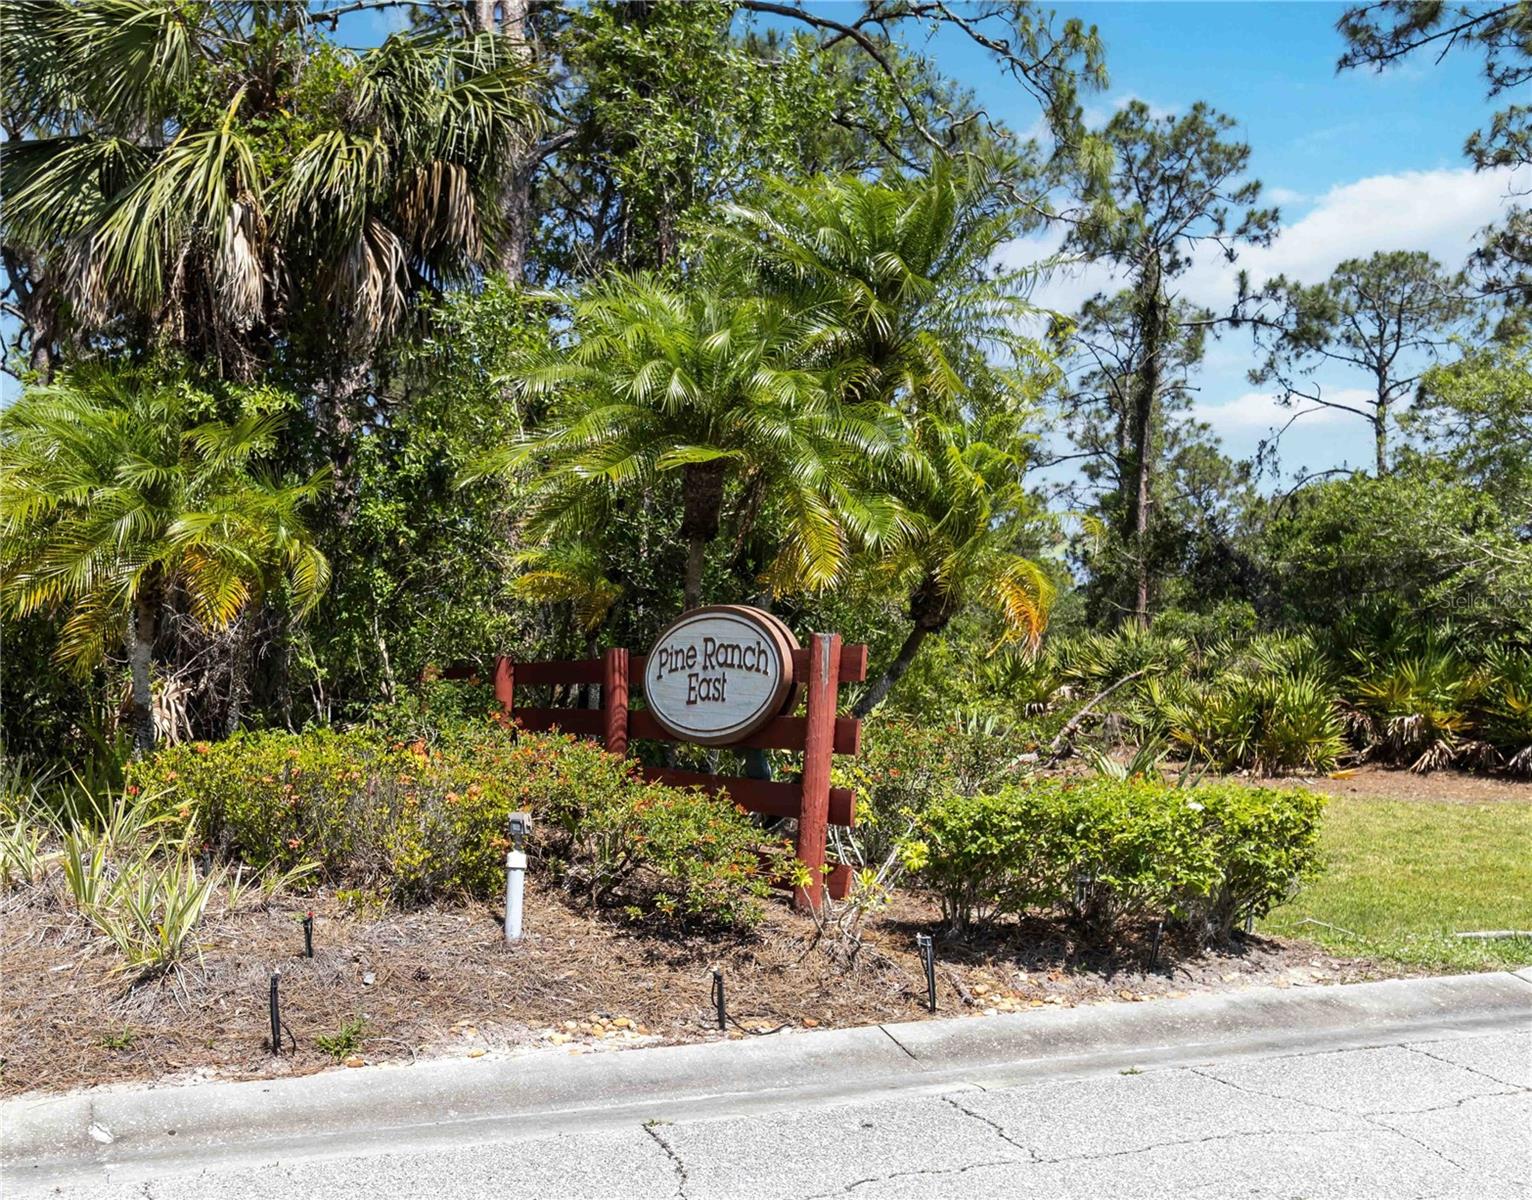
- Association: Pine Ranch East / Pinnacle
Land Information
- Land Use: Residential
- Land Use Subtype: Single Family Residential
Lot Information
- Parcel ID: 0141080010
- Lot Size: 49526 sqft
Property Information
- Property Type: Single Family Residence
- Style: Ranch
- Year Built: 1995
Tax Information
- Annual Tax: $5,492
Utilities
- Water & Sewer: Public
- Heating: Central, Electric
- Cooling: Central Air
Location
- County: Sarasota
Listing Details
Investment Summary
- Monthly Cash Flow
- -$4,436
- Cap Rate
- 2.5%
- Cash-on-Cash Return
- -16.0%
- Debt Coverage Ratio
- 0.40
- Internal Rate of Return (5 years)
- -11.4%
Cash Flow
Net Operating Income (NOI) minus mortgage payments.
Calculation:
NOI - Mortgage Payments
Cap Rate (Market Value)
Capitalization Rate is a rate of return that compares the yearly Net Operating Income (NOI) to the market value.
Calculation:
NOI / Market Value
Cash-on-Cash Return (CoC)
Annual Cash Flow / Cash Invested
Calculation:
Annual cash flow divided by initial cash invested.
Debt Coverage Ratio (DCR)
Net Operating Income (NOI) divided by total debt payments.
Calculation:
NOI / Total Debt Payments
Internal Rate of Return (IRR)
A metric for assessing profitability over time. IRR is the discount rate at which the net present value (NPV) of all future cash flows (positive and negative) from an investment equals zero — including both periodic cash flow (such as rent) and a projected sale at the end of the holding period. It represents the expected annualized return, accounting for income, expenses, and the recovery of capital through a future sale.
Purchase Details
Purchase PriceThe price paid for the property. Purchase price:
| $1,450,000 |
|---|---|
Amount FinancedThe amount of the purchase financed through a loan. Amount financed:
| -$1,160,000 |
Down paymentThe initial payment made towards the purchase. Down payment:
| $290,000 |
Closing CostsFees and expenses associated with purchasing a property, typically ranging from 2% to 5% of the home’s purchase price, paid at the end of a home purchase to cover services like lending, title transfer, and taxes. Closing costs:
| $43,500 |
Rehab CostsCosts incurred to repair or improve the property, including: roof, flooring, exterior siding, kitchen, exterior paint, bathrooms, etc. Rehab costs:
| $0 |
Initial Cash InvestedThe total initial cash invested in the property. Calculation:Down payment + Buying costs + Rehab costs Initial cash invested:
| $333,500 |
Square Feet (SQFT)The total square footage of the property. Square feet:
| 3,481 |
Cost Per Square FootCost per square foot of the property. Calculation:Purchase Price / Square Feet Cost per square foot:
| $417 |
Monthly Rent Per Square FootMonthly rent divided by the number of square feet. This ratio helps investors compare rental income efficiency across properties, markets, and unit sizes Calculation:Monthly Rent / Square Feet Monthly rent per square foot:
| $1.44 |
Financing Details
Loan AmountThe total sum of money borrowed from a lender to finance a property purchase. Calculation:Purchase Price - Down Payment
Loan amount:
| $1,160,000 |
|---|---|
Loan to Value Ratio (LTV)Loan amount divided by the market value of the property. Calculation:Loan Amount / Market Value
Loan to value ratio:
| 80.0% |
Loan TypeThe type of loan (e.g., fixed, adjustable).
Loan type:
| Amortizing |
TermThe loan repayment period in years.
Term:
| 30 years |
Interest RateThe percentage a lender charges on the borrowed amount of a loan, determining the cost of borrowing money.
Interest rate:
| 6.625% |
Principal & Interest (PI)The principal is the portion of the loan payment that reduces the loan balance. The interest is the lender's charge for borrowing money. Calculation:(P * r * (1 + r) ** n) / ((1 + r) ** n - 1) Where:
P = Loan amount (principal)
Principal & interest:
| $7,428 |
Property TaxesAnnual taxes levied by local governments on real estate properties. These taxes fund public services like schools, roads, and emergency services.
Property tax:
| $458 |
InsuranceThe costs for insurance coverage to protect against financial losses due to risks like fire, natural disasters, theft, liability, or tenant-related damages. Calculation:Assumes 7% of gross rental income, unless insurance rates are specified.
Insurance:
| $350 |
Private Mortgage Insurance (PMI)A fee that borrowers pay when they take out a conventional loan with a loan-to-value (LTV) ratio above 80%.
Private mortgage insurance (PMI):
| $0 |
Monthly PaymentThe fixed amount a borrower pays each month to repay a loan. It typically includes principal and interest (P&I) and may also cover property taxes, insurance, HOA fees, and PMI if escrowed. Monthly payment:
| $8,236 |
Operating Income
| % Rent | Monthly | Yearly | |
|---|---|---|---|
Gross RentThe total rental income received from tenants before deducting any expenses. Includes base rent, late fees, pet fees, parking fees, and other recurring charges.
Gross rent:
| $5,000 | $60,000 | |
Vacancy LossExpected loss of rent due to vacancies.
Vacancy loss:
(6%)
| 6% | -$300 | -$3,600 |
Operating IncomeGross rental income minus vacancy loss. Calculation:Gross rent - Vacancy loss
Operating income:
| $4,700 | $56,400 |
Operating Expenses
| % Rent | Monthly | Yearly | |
|---|---|---|---|
Property TaxesAnnual taxes levied by local governments on real estate properties. These taxes fund public services like schools, roads, and emergency services. | 9% | -$458 | -$5,492 |
InsuranceThe costs for insurance coverage to protect against financial losses due to risks like fire, natural disasters, theft, liability, or tenant-related damages. Calculation:Assumes 7% of gross rental income, unless insurance rates are specified. | 7% | -$350 | -$4,200 |
Property ManagementThe costs associated with hiring a property manager to handle the day-to-day operations of a rental property. Includes management fees, leasing fes, eviction fees, etc. Calculation:Assumes 8% of gross rental income. | 8% | -$400 | -$4,800 |
Repairs & MaintenanceOngoing costs for routine upkeep and minor fixes needed to keep a property in good working condition. Calculation:Assumes 5% of gross rental income. Varies by property age and condition. | 5% | -$250 | -$3,000 |
Capital ExpensesLarge, infrequent costs for major improvements or replacements, like a new roof, HVAC system, or appliances. Calculation:Assumes 5% of gross rental income. Varies by property age. | 5% | -$250 | -$3,000 |
HOA FeesRegular dues paid to a Homeowners Association for community maintenance, amenities, and management. Similar fees include: Condo Association Fees, Co-op Maintenance Fees, etc. | n/a | n/a | n/a |
Operating ExpensesRecurring costs required to maintain and manage a rental property, including property taxes, insurance, maintenance, repairs, utilities (if paid by the owner), property management fees, and other day-to-day expenses. Calculation:Insurance + Property Taxes + Property Management + Repairs & Maintenance + Capital Expenditures + HOA Fees | 34% | -$1,708 | -$20,492 |
Cash Flow
| Monthly | Yearly | |
|---|---|---|
Net Operating Income (NOI)The income generated from a property after deducting all operating expenses but before deducting mortgage payments, taxes, and capital expenditures. Calculation:Gross Operating Income - Operating Expenses
Net operating income:
| $2,992 | $35,904 |
Mortgage PaymentThe fixed amount a borrower pays each month to repay a loan. It typically includes principal and interest (P&I) and may also cover property taxes, insurance, HOA fees, and PMI if escrowed. | -$7,428 | -$89,136 |
Cash FlowNet Operating Income (NOI) minus mortgage payments. Calculation:NOI - Mortgage Payments | $4,436 | $53,232 |