$375,000
Investment Summary
- Monthly Cash Flow
- -$1,272
- Cap Rate
- 1.6%
- Cash-on-Cash Return
- -17.7%
- Debt Coverage Ratio
- 0.28
- Internal Rate of Return (5 years)
- -13.1%
Cash Flow
Net Operating Income (NOI) minus mortgage payments.
Calculation:
NOI - Mortgage Payments
Cap Rate (Market Value)
Capitalization Rate is a rate of return that compares the yearly Net Operating Income (NOI) to the market value.
Calculation:
NOI / Market Value
Cash-on-Cash Return (CoC)
Annual Cash Flow / Cash Invested
Calculation:
Annual cash flow divided by initial cash invested.
Debt Coverage Ratio (DCR)
Net Operating Income (NOI) divided by total debt payments.
Calculation:
NOI / Total Debt Payments
Internal Rate of Return (IRR)
A metric for assessing profitability over time. IRR is the discount rate at which the net present value (NPV) of all future cash flows (positive and negative) from an investment equals zero — including both periodic cash flow (such as rent) and a projected sale at the end of the holding period. It represents the expected annualized return, accounting for income, expenses, and the recovery of capital through a future sale.
Property Description
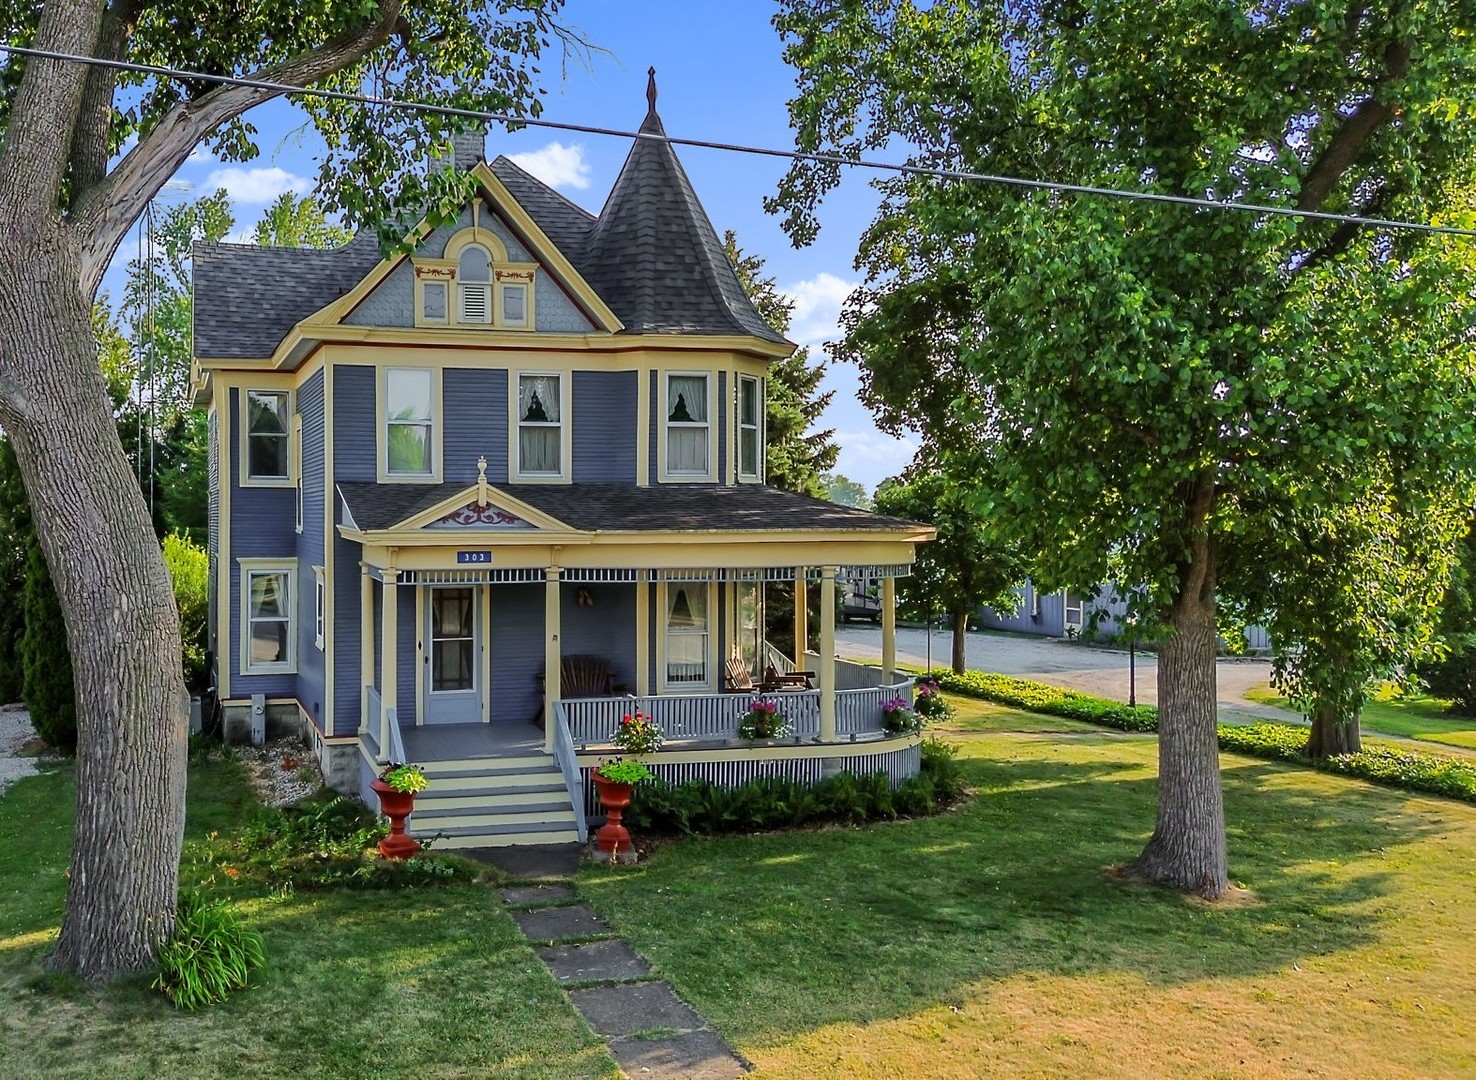
This magnificent 2,262 SqFt, 4-bedroom, 2-bathroom Victorian on nearly 2 acres, complete with two garages (a 2-car and a 1-car) and an 82x36 Morton Building, is more than just a house; it's a piece of history waiting for its next chapter. Don't miss this extraordinary opportunity to own a significant property where classic architecture, timeless character, and enduring charm meet expansive space. A bright, clean, and dry basement with both interior and exterior entrances adds valuable utility and storage. The grand foyer welcomes you into a layout designed for both comfortable living and gracious entertaining. Inside, you'll discover generously proportioned rooms adorned with authentic period details such as intricate custom woodwork, rich hardwood floors, soaring 9.5' ceilings on the main floor, stunning stained-glass accents, amazing built-ins, a classic claw foot tub, elegant pocket and French doors, exposed brick, two staircases, and even a delightful under-stair closet. Beyond the vintage allure, your practical side will appreciate modern conveniences like the fireplace with convective heat and a cleverly hidden dumbwaiter for firewood, a kitchen garbage receptacle with a sliding countertop lid, and discreet pull-out shelves in the pantry. (SEE PICTURES FOR A FEATURE SHEET WITH ADDITIONAL UPDATES). And for added peace of mind, the seller is providing a 1-year home warranty! Beyond its timeless interiors, this property offers a private oasis featuring a wrap around porch (picture watching sunrises and sunsets while sipping your favorite beverages), serene patio, a bubbling Koi pond with waterfall, and lush gardens complete with pergolas and a walking path. It's an ideal setting for cherished moments with loved ones or quiet personal reflection. Adding to its remarkable versatility, the spacious outbuilding boasts a 10x12 overhead door, a 40x13 drywalled shop area with a concrete floor, electricity, and a manufactured wood burner. This estate truly caters to all your indoor and outdoor hobbies, or even a thriving small business venture. No matter your interests, this location has you covered. Enjoy unparalleled convenience with groceries, banks, healthcare, worship, pet care, restaurants, and diverse shopping all within easy reach. Yet, it's quaint small-town charm truly sets the stage for a relaxed lifestyle, away from the hustle and bustle. Outdoor enthusiasts will love the proximity to golf, sports fields, fitness centers, parks, and abundant summer and winter activities including hunting and fishing. For higher education, both a community college and a university are nearby. You're also just 55 minutes from Chicago, 25 minutes from the Metra commuter train, and 20 minutes from the major retail hub of Bourbonnais. Plus, the highly acclaimed Grant Park School District has been consistently recognized by the U.S. News & World Report, Niche and The Kankakee Journal for excelling in academics, athletics, and community engagement. Settle in and prepare for your guests to be impressed!
Build Your Team
Quickly find investor-friendly professionals who can help you succeed in real estate investing at any stage of the investing journey.


Agents
Match with investor-friendly agents who can help you find, analyze, and close your next deal


Lenders
Get the best funding…find investor-friendly lenders who specialize in your deal strategy


Property Managers
Transition to passive investing. Find a trusted property management partnership that lasts.


Tax Pros & Accountants
Taxes and financial reporting made easy—find experts to create tax savings strategies, file taxes, and more
Location
Property Details
Parking
- Details: Gravel, Garage Door Opener, Garage, On Site, Detached, Circular Driveway
- Garage Spaces: 3
- Spaces Total: 28
Bedroom Information
- # of Bedrooms: 4
Bathroom Information
- # of Baths (Full): 2
- # of Baths (Total): 2.0
Interior Features
- # of Rooms: 7
- Basement: Yes
- Basement Description: Sump Pump, Unfinished, Crawl Space, Exterior Entry, Partial
- Fireplace: Yes
Exterior Features
- Foundation: Block, Concrete Perimeter
- Roof Material: Asphalt
Land Information
- Land Use: Residential
- Land Use Subtype: Single Family Residential (Assumed)
Lot Information
- Parcel ID: 010419200002
- Lot Size: 0 sqft
Property Information
- Property Type: Single Family Residence
- Style: Victorian
- Year Built: 1905
Tax Information
- Annual Tax: $8,042
Utilities
- Water & Sewer: Public
- Heating: Natural Gas, Steam
- Cooling: Ceiling Fan(s), Central Air
Location
- County: Kankakee
Listing Details
Investment Summary
- Monthly Cash Flow
- -$1,272
- Cap Rate
- 1.6%
- Cash-on-Cash Return
- -17.7%
- Debt Coverage Ratio
- 0.28
- Internal Rate of Return (5 years)
- -13.1%
Cash Flow
Net Operating Income (NOI) minus mortgage payments.
Calculation:
NOI - Mortgage Payments
Cap Rate (Market Value)
Capitalization Rate is a rate of return that compares the yearly Net Operating Income (NOI) to the market value.
Calculation:
NOI / Market Value
Cash-on-Cash Return (CoC)
Annual Cash Flow / Cash Invested
Calculation:
Annual cash flow divided by initial cash invested.
Debt Coverage Ratio (DCR)
Net Operating Income (NOI) divided by total debt payments.
Calculation:
NOI / Total Debt Payments
Internal Rate of Return (IRR)
A metric for assessing profitability over time. IRR is the discount rate at which the net present value (NPV) of all future cash flows (positive and negative) from an investment equals zero — including both periodic cash flow (such as rent) and a projected sale at the end of the holding period. It represents the expected annualized return, accounting for income, expenses, and the recovery of capital through a future sale.
Purchase Details
Purchase PriceThe price paid for the property. Purchase price:
| $375,000 |
|---|---|
Amount FinancedThe amount of the purchase financed through a loan. Amount financed:
| -$300,000 |
Down paymentThe initial payment made towards the purchase. Down payment:
| $75,000 |
Closing CostsFees and expenses associated with purchasing a property, typically ranging from 2% to 5% of the home’s purchase price, paid at the end of a home purchase to cover services like lending, title transfer, and taxes. Closing costs:
| $11,250 |
Rehab CostsCosts incurred to repair or improve the property, including: roof, flooring, exterior siding, kitchen, exterior paint, bathrooms, etc. Rehab costs:
| $0 |
Initial Cash InvestedThe total initial cash invested in the property. Calculation:Down payment + Buying costs + Rehab costs Initial cash invested:
| $86,250 |
Square Feet (SQFT)The total square footage of the property. Square feet:
| 2,262 |
Cost Per Square FootCost per square foot of the property. Calculation:Purchase Price / Square Feet Cost per square foot:
| $166 |
Monthly Rent Per Square FootMonthly rent divided by the number of square feet. This ratio helps investors compare rental income efficiency across properties, markets, and unit sizes Calculation:Monthly Rent / Square Feet Monthly rent per square foot:
| $0.75 |
Financing Details
Loan AmountThe total sum of money borrowed from a lender to finance a property purchase. Calculation:Purchase Price - Down Payment
Loan amount:
| $300,000 |
|---|---|
Loan to Value Ratio (LTV)Loan amount divided by the market value of the property. Calculation:Loan Amount / Market Value
Loan to value ratio:
| 80.0% |
Loan TypeThe type of loan (e.g., fixed, adjustable).
Loan type:
| Amortizing |
TermThe loan repayment period in years.
Term:
| 30 years |
Interest RateThe percentage a lender charges on the borrowed amount of a loan, determining the cost of borrowing money.
Interest rate:
| 5.875% |
Principal & Interest (PI)The principal is the portion of the loan payment that reduces the loan balance. The interest is the lender's charge for borrowing money. Calculation:(P * r * (1 + r) ** n) / ((1 + r) ** n - 1) Where:
P = Loan amount (principal)
Principal & interest:
| $1,775 |
Property TaxesAnnual taxes levied by local governments on real estate properties. These taxes fund public services like schools, roads, and emergency services.
Property tax:
| $670 |
InsuranceThe costs for insurance coverage to protect against financial losses due to risks like fire, natural disasters, theft, liability, or tenant-related damages. Calculation:Assumes 7% of gross rental income, unless insurance rates are specified.
Insurance:
| $119 |
Private Mortgage Insurance (PMI)A fee that borrowers pay when they take out a conventional loan with a loan-to-value (LTV) ratio above 80%.
Private mortgage insurance (PMI):
| $0 |
Monthly PaymentThe fixed amount a borrower pays each month to repay a loan. It typically includes principal and interest (P&I) and may also cover property taxes, insurance, HOA fees, and PMI if escrowed. Monthly payment:
| $2,564 |
Operating Income
| % Rent | Monthly | Yearly | |
|---|---|---|---|
Gross RentThe total rental income received from tenants before deducting any expenses. Includes base rent, late fees, pet fees, parking fees, and other recurring charges.
Gross rent:
| $1,700 | $20,400 | |
Vacancy LossExpected loss of rent due to vacancies.
Vacancy loss:
(6%)
| 6% | -$102 | -$1,224 |
Operating IncomeGross rental income minus vacancy loss. Calculation:Gross rent - Vacancy loss
Operating income:
| $1,598 | $19,176 |
Operating Expenses
| % Rent | Monthly | Yearly | |
|---|---|---|---|
Property TaxesAnnual taxes levied by local governments on real estate properties. These taxes fund public services like schools, roads, and emergency services. | 39% | -$670 | -$8,042 |
InsuranceThe costs for insurance coverage to protect against financial losses due to risks like fire, natural disasters, theft, liability, or tenant-related damages. Calculation:Assumes 7% of gross rental income, unless insurance rates are specified. | 7% | -$119 | -$1,428 |
Property ManagementThe costs associated with hiring a property manager to handle the day-to-day operations of a rental property. Includes management fees, leasing fes, eviction fees, etc. Calculation:Assumes 8% of gross rental income. | 8% | -$136 | -$1,632 |
Repairs & MaintenanceOngoing costs for routine upkeep and minor fixes needed to keep a property in good working condition. Calculation:Assumes 5% of gross rental income. Varies by property age and condition. | 5% | -$85 | -$1,020 |
Capital ExpensesLarge, infrequent costs for major improvements or replacements, like a new roof, HVAC system, or appliances. Calculation:Assumes 5% of gross rental income. Varies by property age. | 5% | -$85 | -$1,020 |
HOA FeesRegular dues paid to a Homeowners Association for community maintenance, amenities, and management. Similar fees include: Condo Association Fees, Co-op Maintenance Fees, etc. | n/a | n/a | n/a |
Operating ExpensesRecurring costs required to maintain and manage a rental property, including property taxes, insurance, maintenance, repairs, utilities (if paid by the owner), property management fees, and other day-to-day expenses. Calculation:Insurance + Property Taxes + Property Management + Repairs & Maintenance + Capital Expenditures + HOA Fees | 64% | -$1,095 | -$13,142 |
Cash Flow
| Monthly | Yearly | |
|---|---|---|
Net Operating Income (NOI)The income generated from a property after deducting all operating expenses but before deducting mortgage payments, taxes, and capital expenditures. Calculation:Gross Operating Income - Operating Expenses
Net operating income:
| $503 | $6,036 |
Mortgage PaymentThe fixed amount a borrower pays each month to repay a loan. It typically includes principal and interest (P&I) and may also cover property taxes, insurance, HOA fees, and PMI if escrowed. | -$1,775 | -$21,300 |
Cash FlowNet Operating Income (NOI) minus mortgage payments. Calculation:NOI - Mortgage Payments | $1,272 | $15,264 |