$4,600,000
Investment Summary
- Monthly Cash Flow
- -$20,763
- Cap Rate
- 0.7%
- Cash-on-Cash Return
- -23.5%
- Debt Coverage Ratio
- 0.12
- Internal Rate of Return (5 years)
- -18.7%
Cash Flow
Net Operating Income (NOI) minus mortgage payments.
Calculation:
NOI - Mortgage Payments
Cap Rate (Market Value)
Capitalization Rate is a rate of return that compares the yearly Net Operating Income (NOI) to the market value.
Calculation:
NOI / Market Value
Cash-on-Cash Return (CoC)
Annual Cash Flow / Cash Invested
Calculation:
Annual cash flow divided by initial cash invested.
Debt Coverage Ratio (DCR)
Net Operating Income (NOI) divided by total debt payments.
Calculation:
NOI / Total Debt Payments
Internal Rate of Return (IRR)
A metric for assessing profitability over time. IRR is the discount rate at which the net present value (NPV) of all future cash flows (positive and negative) from an investment equals zero — including both periodic cash flow (such as rent) and a projected sale at the end of the holding period. It represents the expected annualized return, accounting for income, expenses, and the recovery of capital through a future sale.
Property Description
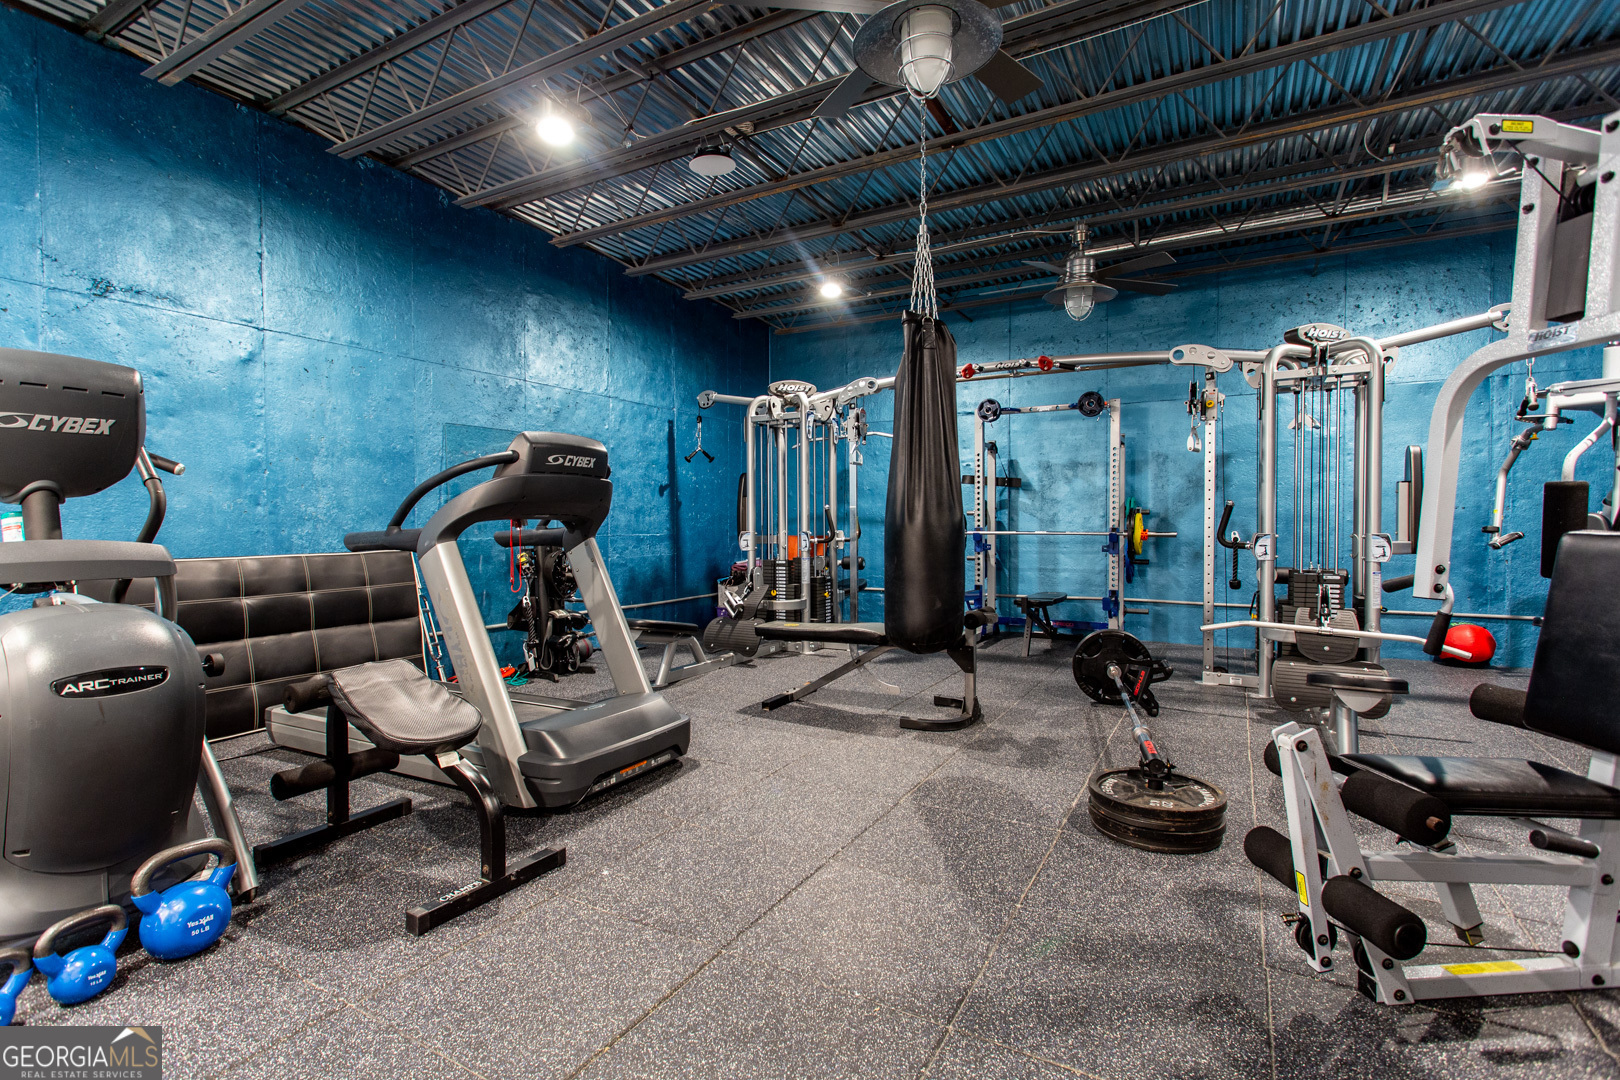
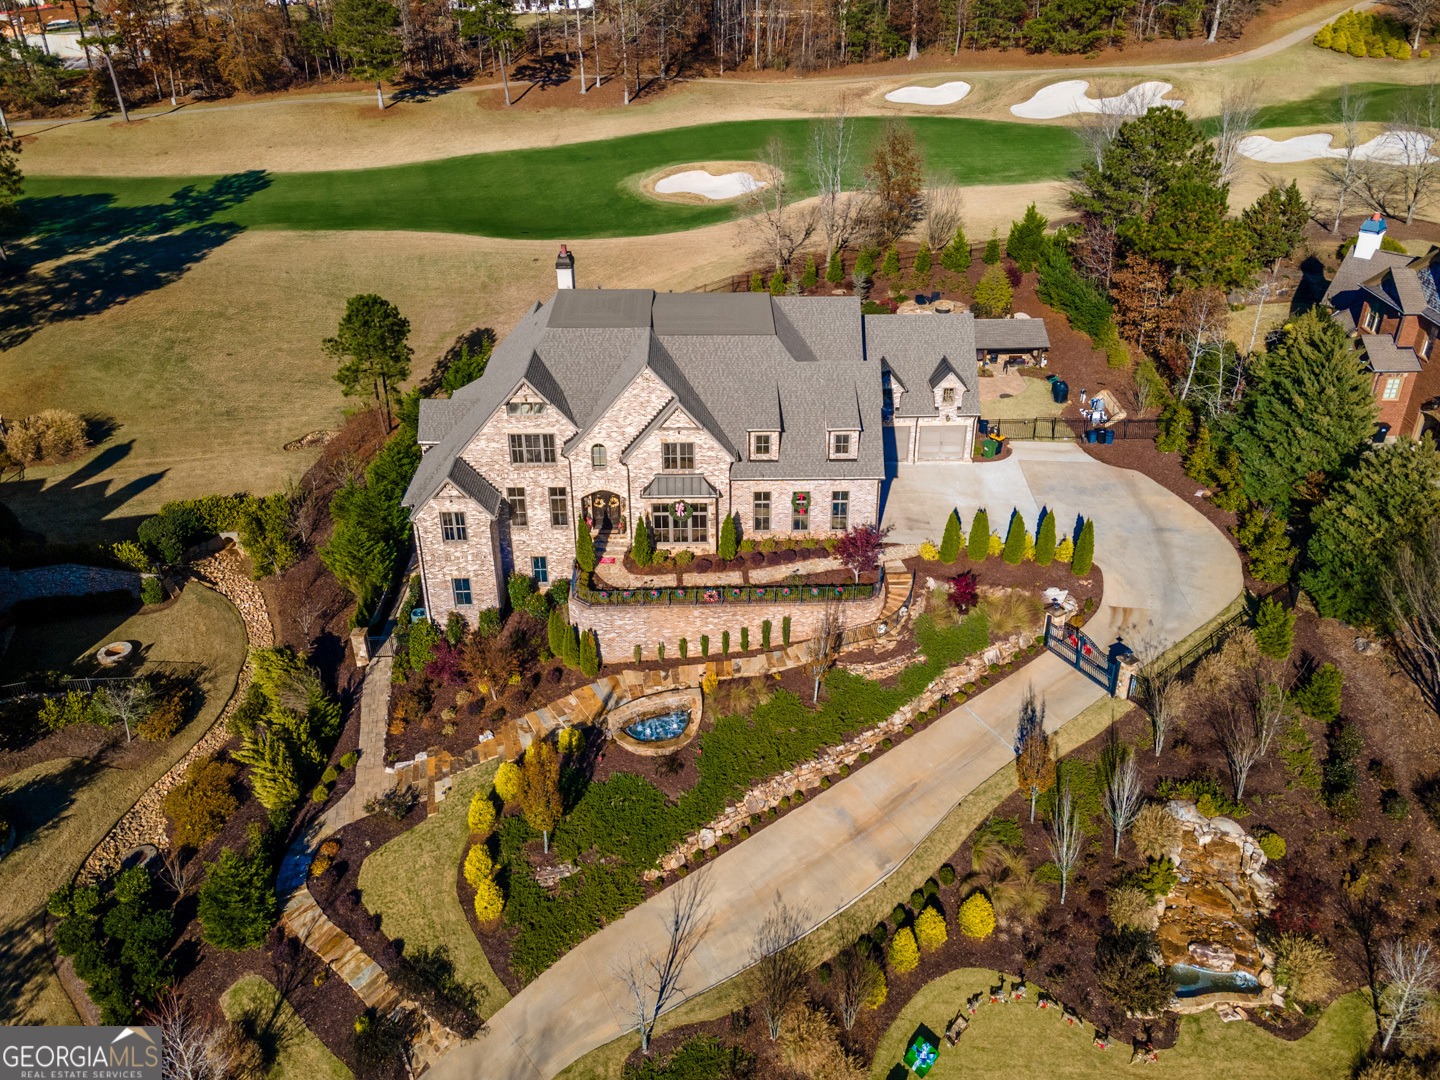
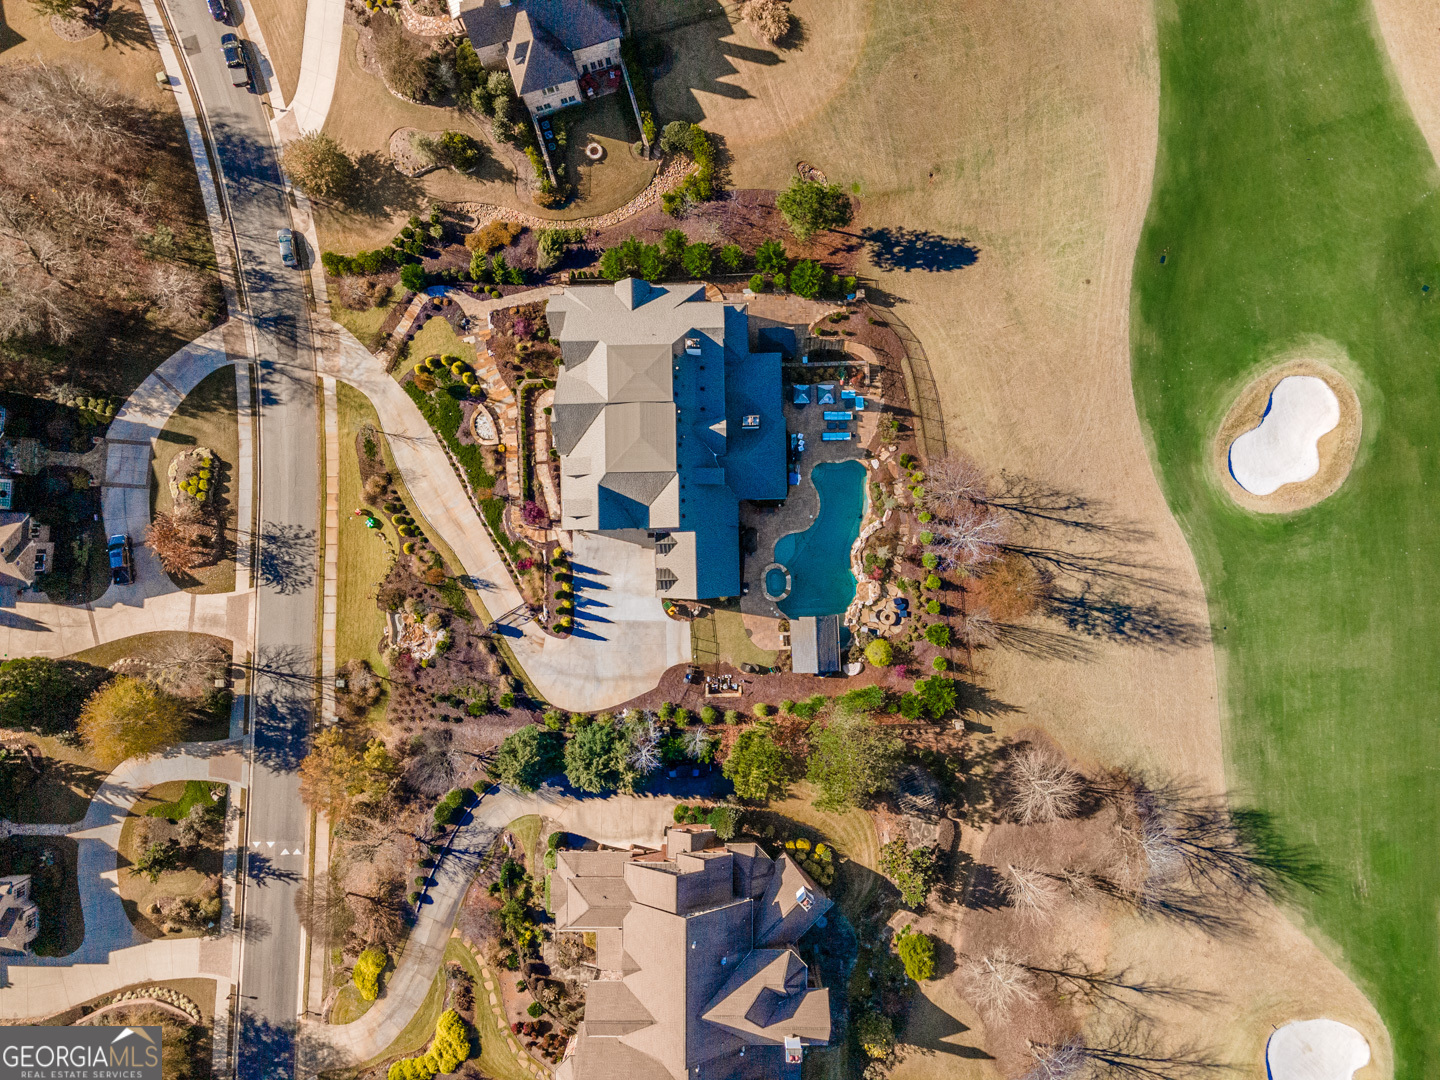
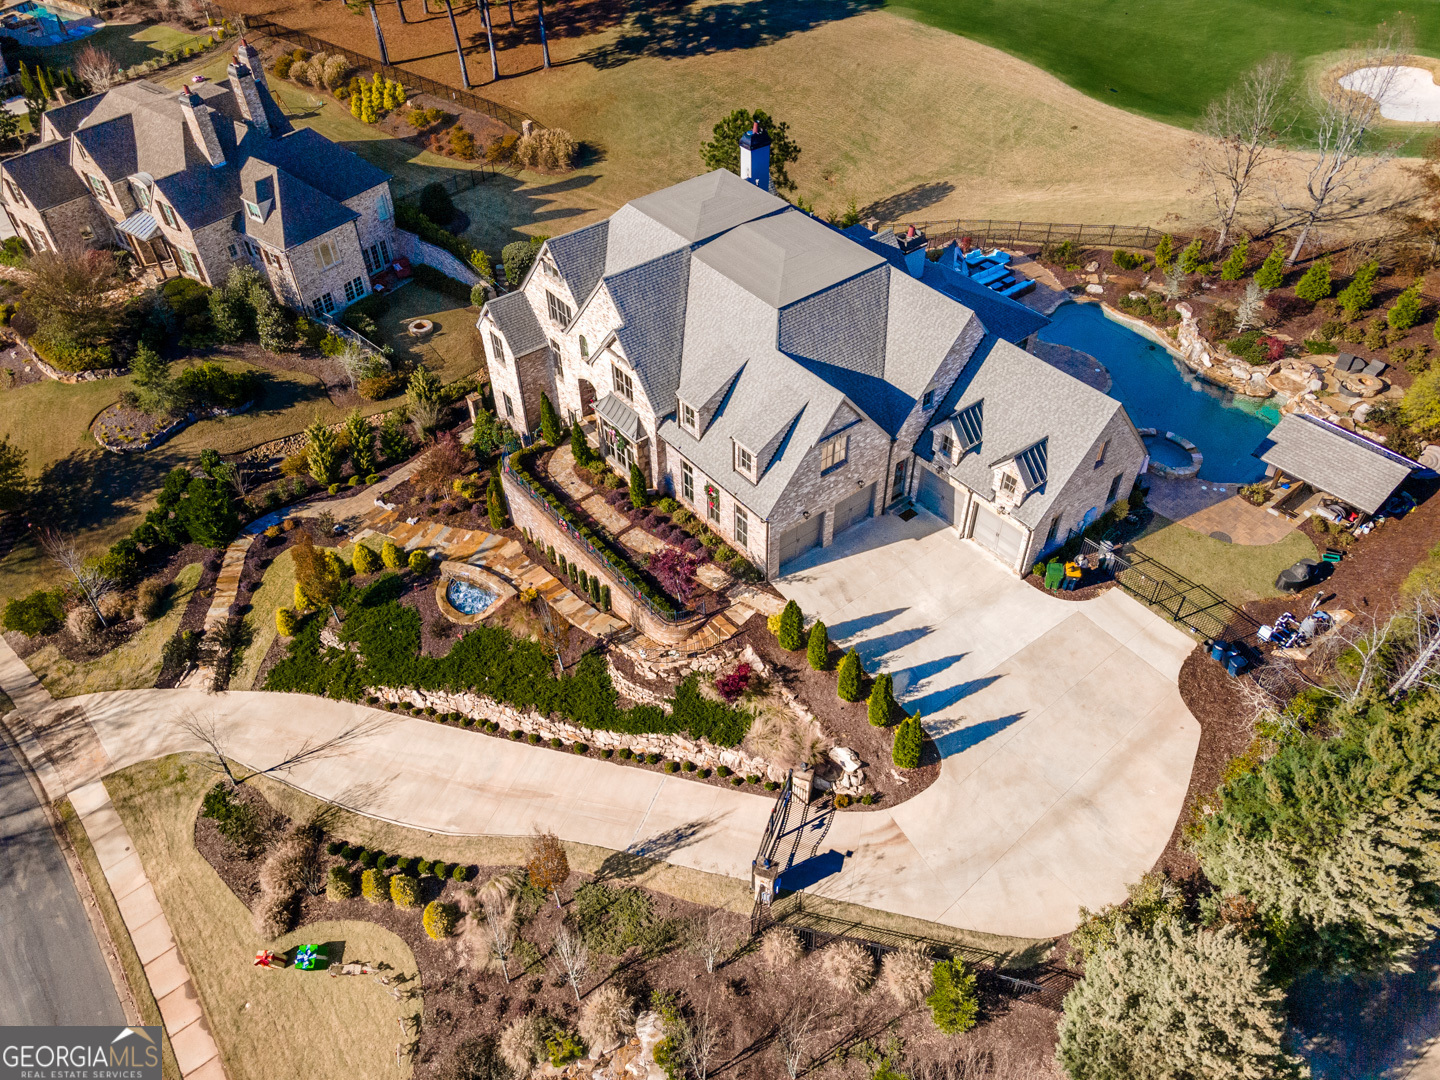
An Unrivaled Showcase of Luxury Living! Welcome to a true masterpiece of design and craftsmanship-this extraordinary custom estate redefines luxury living, perfectly positioned on the 8th hole of the prestigious Manor Golf & Country Club, a 24-hour guard-gated community offering both exclusivity and serenity. From the moment you enter, you're greeted with expansive, light-filled living spaces that blend elegance and comfort. The main level centers around a chef's dream kitchen, featuring two oversized islands, top-of-the-line appliances, a walk-in pantry, and an open layout that seamlessly flows into the grand family and living rooms. Step into the enclosed lanai and take in sweeping golf course views and the stunning resort-style, heated saltwater pool, complete with a swim-up bar,two stone waterfalls, and a spa-your personal oasis of relaxation and entertainment. When it's time to host in style, ride the elevator down to the ultimate 5,100 sq ft terrace level, thoughtfully designed for luxurious entertaining. Highlights include: A 12-seat state-of-the-art theater A massive 800 sq ft fitness center Two bathrooms, 12 seater sauna, 6 seater steam room, Jacuzzi Private guest suite and office, or turn it into a play room. A spacious billiards/recreation area A custom-designed pub-style bar And for the connoisseurs, a cellar crafted with bourbon and whiskey lovers in mind, offering a refined retreat where your collection can be appreciated in style. The main-level primary suite is a true retreat, showcasing soaring double tray ceilings and breathtaking views of the golf course, all bathed in natural light. It opens directly to the covered lanai, blending indoor comfort with outdoor serenity. The spa-inspired en suite bathroom is pure indulgence-featuring a freestanding soaking tub, an oversized walk-in shower spacious enough for the whole family, dual vanities, dual water closets, and dual custom walk-in closets. And for that extra touch of elegance, there's a beautifully appointed glam vanity-perfect for morning routines or evening prep in your own private sanctuary. Every detail has been thoughtfully designed to offer both luxury and functionality in one of the most stunning owner's suites you'll find. Upstairs, you'll find 2 additional master suites, 2 en suite baths in all secondary bedrooms, a massive loft area and office/upstairs family room/office with a picture window overlooking the 8th hole. Additional features include beautiful hardwood flooring throughout and an additional attic closet-ideal for those who crave even more space. and an 8-car garage, perfect for your automotive collection. Already approved are plans for a garage expansion with a two-bedroom, two-bath loft and glam barber studio. This estate isn't just a home-it's a lifestyle, meticulously designed for those who appreciate luxury, privacy, and exceptional living.
Build Your Team
Quickly find investor-friendly professionals who can help you succeed in real estate investing at any stage of the investing journey.


Agents
Match with investor-friendly agents who can help you find, analyze, and close your next deal


Lenders
Get the best funding…find investor-friendly lenders who specialize in your deal strategy


Property Managers
Transition to passive investing. Find a trusted property management partnership that lasts.


Tax Pros & Accountants
Taxes and financial reporting made easy—find experts to create tax savings strategies, file taxes, and more
Location
Property Details
Parking
- Description: Attached, Garage
- Details: Garage, Garage Door Opener, Kitchen Level
- Garage Spaces: 12
- Spaces Total: 12
Bedroom Information
- # of Bedrooms: 6
Bathroom Information
- # of Baths (Full): 6
- # of Baths (Partial): 4
- # of Baths (Total): 8.0
Interior Features
- # of Rooms: 13
- # of Stories: 3
- Basement: Yes
- Basement Description: Concrete, Daylight, Interior Entry, Exterior Entry, Finished, Full
- Fireplace: Yes
Exterior Features
- Exterior Walls Materials: Rock, Stone
- Roof Material: Composition
Land Information
- Land Use: Residential
- Land Use Subtype: Single Family Residential
Lot Information
- Parcel ID: 22534003980267
- Lot Size: 0 sqft
Property Information
- Property Type: Single Family Residence
- Style: Brick 4 Side, French Provincial
- Year Built: 2017
Tax Information
- Annual Tax: $19,394
Utilities
- Water & Sewer: Public
- Heating: Electric, Central
- Cooling: Electric, Central Air
Location
- County: Fulton
Listing Details
Investment Summary
- Monthly Cash Flow
- -$20,763
- Cap Rate
- 0.7%
- Cash-on-Cash Return
- -23.5%
- Debt Coverage Ratio
- 0.12
- Internal Rate of Return (5 years)
- -18.7%
Cash Flow
Net Operating Income (NOI) minus mortgage payments.
Calculation:
NOI - Mortgage Payments
Cap Rate (Market Value)
Capitalization Rate is a rate of return that compares the yearly Net Operating Income (NOI) to the market value.
Calculation:
NOI / Market Value
Cash-on-Cash Return (CoC)
Annual Cash Flow / Cash Invested
Calculation:
Annual cash flow divided by initial cash invested.
Debt Coverage Ratio (DCR)
Net Operating Income (NOI) divided by total debt payments.
Calculation:
NOI / Total Debt Payments
Internal Rate of Return (IRR)
A metric for assessing profitability over time. IRR is the discount rate at which the net present value (NPV) of all future cash flows (positive and negative) from an investment equals zero — including both periodic cash flow (such as rent) and a projected sale at the end of the holding period. It represents the expected annualized return, accounting for income, expenses, and the recovery of capital through a future sale.
Purchase Details
Purchase PriceThe price paid for the property. Purchase price:
| $4,600,000 |
|---|---|
Amount FinancedThe amount of the purchase financed through a loan. Amount financed:
| -$3,680,000 |
Down paymentThe initial payment made towards the purchase. Down payment:
| $920,000 |
Closing CostsFees and expenses associated with purchasing a property, typically ranging from 2% to 5% of the home’s purchase price, paid at the end of a home purchase to cover services like lending, title transfer, and taxes. Closing costs:
| $138,000 |
Rehab CostsCosts incurred to repair or improve the property, including: roof, flooring, exterior siding, kitchen, exterior paint, bathrooms, etc. Rehab costs:
| $0 |
Initial Cash InvestedThe total initial cash invested in the property. Calculation:Down payment + Buying costs + Rehab costs Initial cash invested:
| $1,058,000 |
Square Feet (SQFT)The total square footage of the property. Square feet:
| 12,656 |
Cost Per Square FootCost per square foot of the property. Calculation:Purchase Price / Square Feet Cost per square foot:
| $363 |
Monthly Rent Per Square FootMonthly rent divided by the number of square feet. This ratio helps investors compare rental income efficiency across properties, markets, and unit sizes Calculation:Monthly Rent / Square Feet Monthly rent per square foot:
| $0.51 |
Financing Details
Loan AmountThe total sum of money borrowed from a lender to finance a property purchase. Calculation:Purchase Price - Down Payment
Loan amount:
| $3,680,000 |
|---|---|
Loan to Value Ratio (LTV)Loan amount divided by the market value of the property. Calculation:Loan Amount / Market Value
Loan to value ratio:
| 80.0% |
Loan TypeThe type of loan (e.g., fixed, adjustable).
Loan type:
| Amortizing |
TermThe loan repayment period in years.
Term:
| 30 years |
Interest RateThe percentage a lender charges on the borrowed amount of a loan, determining the cost of borrowing money.
Interest rate:
| 6.625% |
Principal & Interest (PI)The principal is the portion of the loan payment that reduces the loan balance. The interest is the lender's charge for borrowing money. Calculation:(P * r * (1 + r) ** n) / ((1 + r) ** n - 1) Where:
P = Loan amount (principal)
Principal & interest:
| $23,563 |
Property TaxesAnnual taxes levied by local governments on real estate properties. These taxes fund public services like schools, roads, and emergency services.
Property tax:
| $1,616 |
InsuranceThe costs for insurance coverage to protect against financial losses due to risks like fire, natural disasters, theft, liability, or tenant-related damages. Calculation:Assumes 7% of gross rental income, unless insurance rates are specified.
Insurance:
| $448 |
Private Mortgage Insurance (PMI)A fee that borrowers pay when they take out a conventional loan with a loan-to-value (LTV) ratio above 80%.
Private mortgage insurance (PMI):
| $0 |
Monthly PaymentThe fixed amount a borrower pays each month to repay a loan. It typically includes principal and interest (P&I) and may also cover property taxes, insurance, HOA fees, and PMI if escrowed. Monthly payment:
| $25,627 |
Operating Income
| % Rent | Monthly | Yearly | |
|---|---|---|---|
Gross RentThe total rental income received from tenants before deducting any expenses. Includes base rent, late fees, pet fees, parking fees, and other recurring charges.
Gross rent:
| $6,400 | $76,800 | |
Vacancy LossExpected loss of rent due to vacancies.
Vacancy loss:
(6%)
| 6% | -$384 | -$4,608 |
Operating IncomeGross rental income minus vacancy loss. Calculation:Gross rent - Vacancy loss
Operating income:
| $6,016 | $72,192 |
Operating Expenses
| % Rent | Monthly | Yearly | |
|---|---|---|---|
Property TaxesAnnual taxes levied by local governments on real estate properties. These taxes fund public services like schools, roads, and emergency services. | 25% | -$1,616 | -$19,394 |
InsuranceThe costs for insurance coverage to protect against financial losses due to risks like fire, natural disasters, theft, liability, or tenant-related damages. Calculation:Assumes 7% of gross rental income, unless insurance rates are specified. | 7% | -$448 | -$5,376 |
Property ManagementThe costs associated with hiring a property manager to handle the day-to-day operations of a rental property. Includes management fees, leasing fes, eviction fees, etc. Calculation:Assumes 8% of gross rental income. | 8% | -$512 | -$6,144 |
Repairs & MaintenanceOngoing costs for routine upkeep and minor fixes needed to keep a property in good working condition. Calculation:Assumes 5% of gross rental income. Varies by property age and condition. | 5% | -$320 | -$3,840 |
Capital ExpensesLarge, infrequent costs for major improvements or replacements, like a new roof, HVAC system, or appliances. Calculation:Assumes 5% of gross rental income. Varies by property age. | 5% | -$320 | -$3,840 |
HOA FeesRegular dues paid to a Homeowners Association for community maintenance, amenities, and management. Similar fees include: Condo Association Fees, Co-op Maintenance Fees, etc. | n/a | n/a | n/a |
Operating ExpensesRecurring costs required to maintain and manage a rental property, including property taxes, insurance, maintenance, repairs, utilities (if paid by the owner), property management fees, and other day-to-day expenses. Calculation:Insurance + Property Taxes + Property Management + Repairs & Maintenance + Capital Expenditures + HOA Fees | 50% | -$3,216 | -$38,594 |
Cash Flow
| Monthly | Yearly | |
|---|---|---|
Net Operating Income (NOI)The income generated from a property after deducting all operating expenses but before deducting mortgage payments, taxes, and capital expenditures. Calculation:Gross Operating Income - Operating Expenses
Net operating income:
| $2,800 | $33,600 |
Mortgage PaymentThe fixed amount a borrower pays each month to repay a loan. It typically includes principal and interest (P&I) and may also cover property taxes, insurance, HOA fees, and PMI if escrowed. | -$23,563 | -$282,756 |
Cash FlowNet Operating Income (NOI) minus mortgage payments. Calculation:NOI - Mortgage Payments | -$20,763 | -$249,156 |