$1,585,000
Investment Summary
- Monthly Cash Flow
- -$2,875
- Cap Rate
- 4.0%
- Cash-on-Cash Return
- -9.5%
- Debt Coverage Ratio
- 0.65
- Internal Rate of Return (5 years)
- -5.2%
Cash Flow
Net Operating Income (NOI) minus mortgage payments.
Calculation:
NOI - Mortgage Payments
Cap Rate (Market Value)
Capitalization Rate is a rate of return that compares the yearly Net Operating Income (NOI) to the market value.
Calculation:
NOI / Market Value
Cash-on-Cash Return (CoC)
Annual Cash Flow / Cash Invested
Calculation:
Annual cash flow divided by initial cash invested.
Debt Coverage Ratio (DCR)
Net Operating Income (NOI) divided by total debt payments.
Calculation:
NOI / Total Debt Payments
Internal Rate of Return (IRR)
A metric for assessing profitability over time. IRR is the discount rate at which the net present value (NPV) of all future cash flows (positive and negative) from an investment equals zero — including both periodic cash flow (such as rent) and a projected sale at the end of the holding period. It represents the expected annualized return, accounting for income, expenses, and the recovery of capital through a future sale.
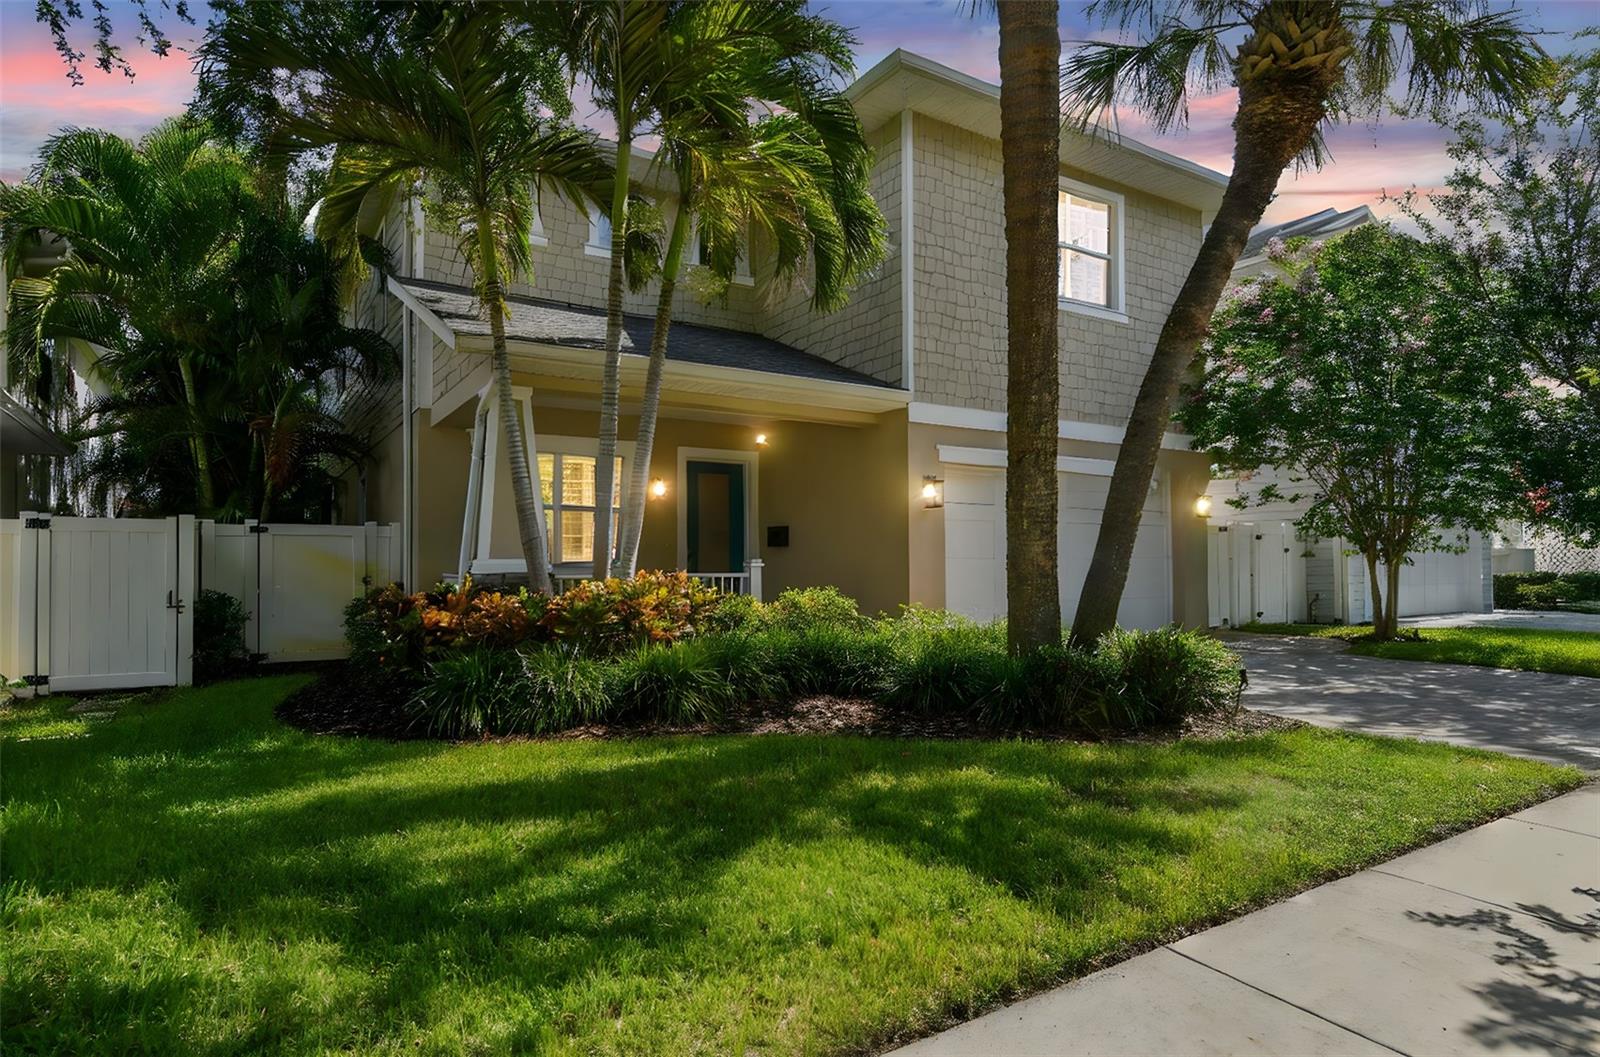
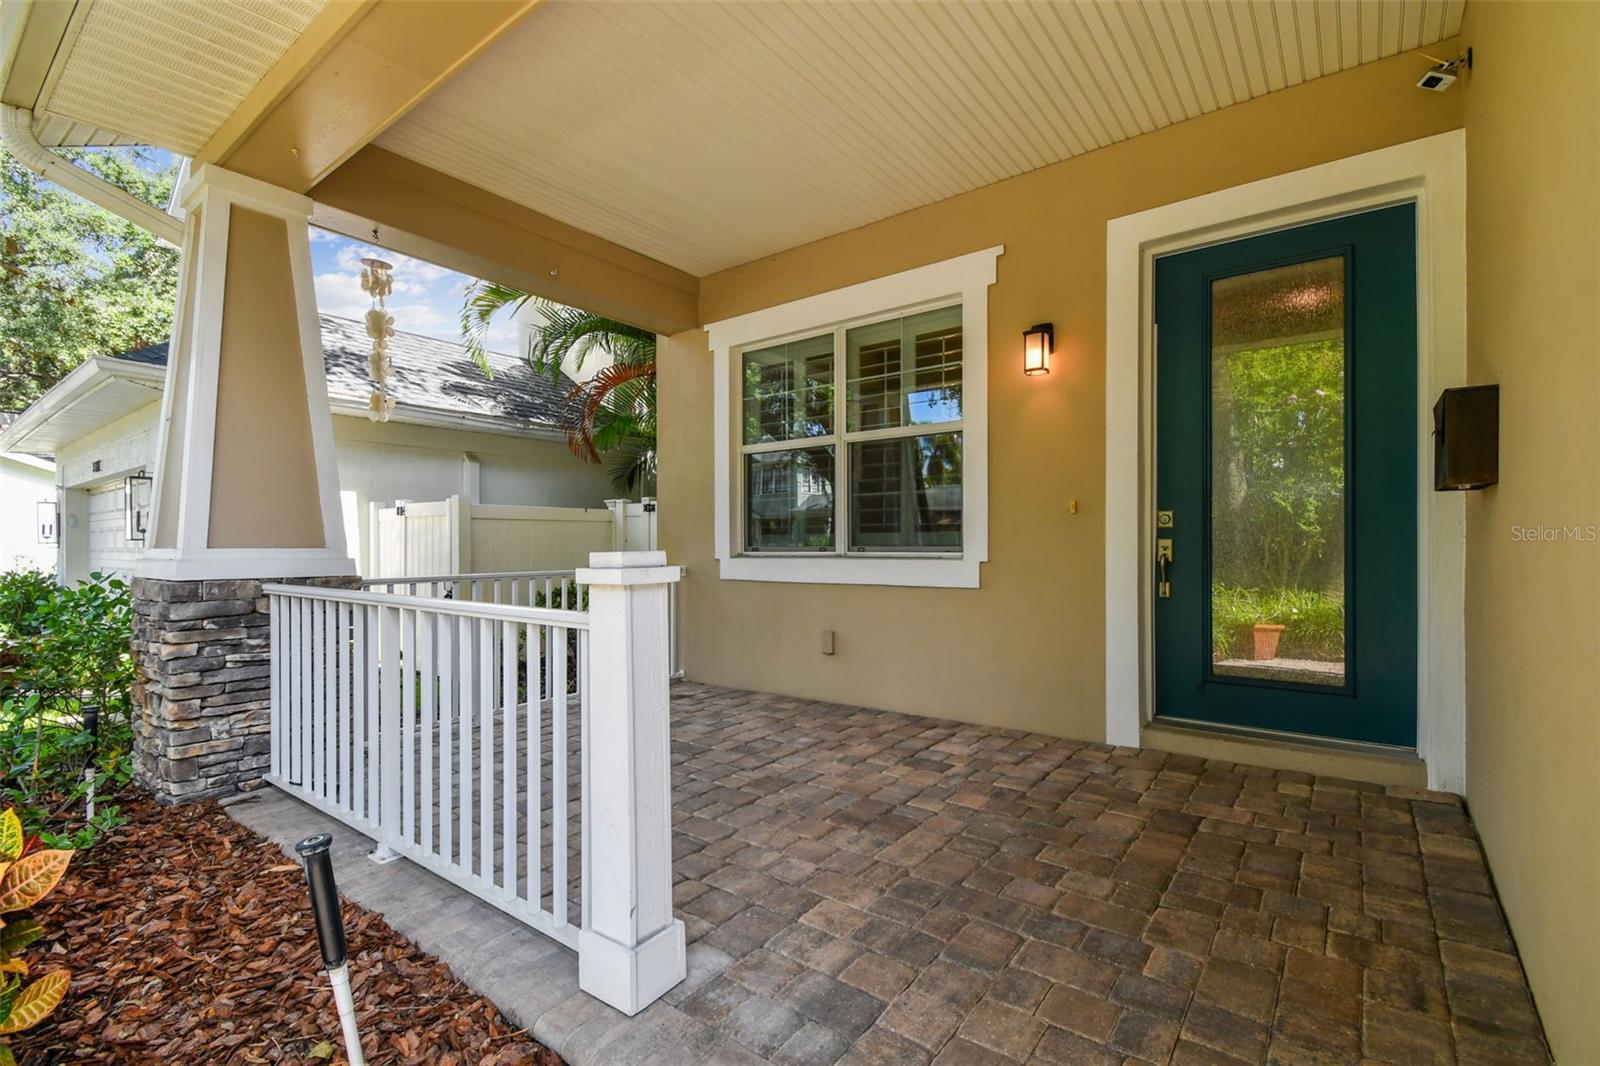
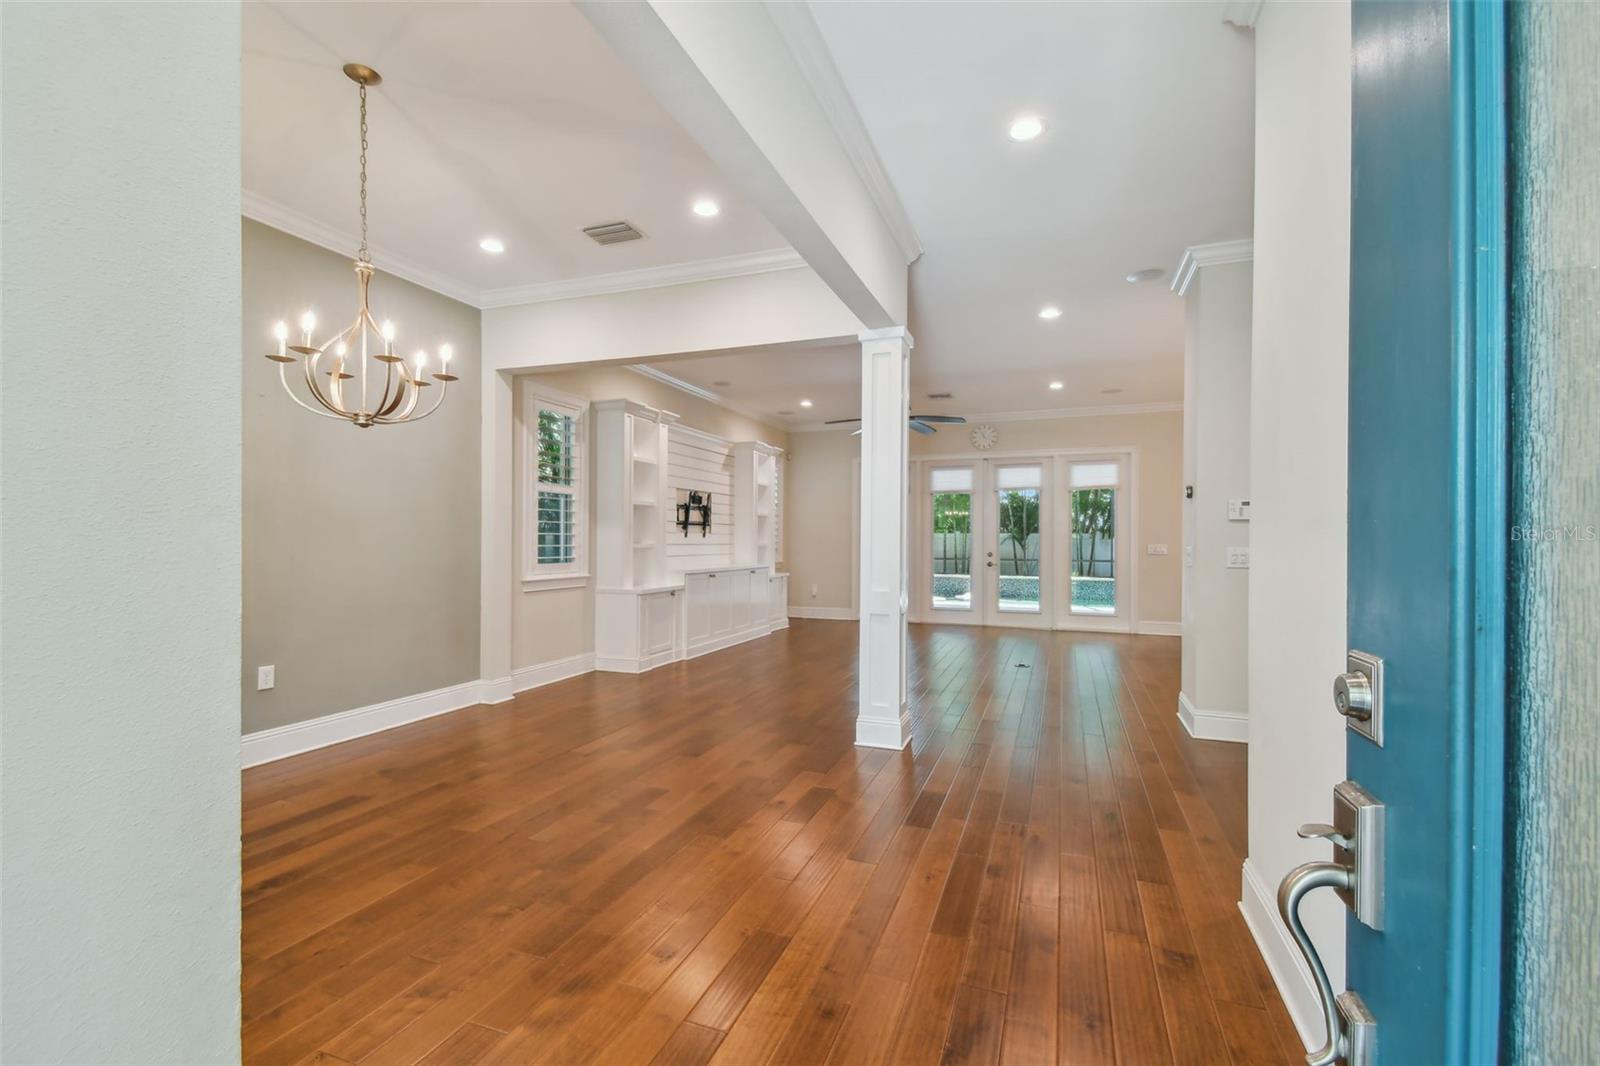
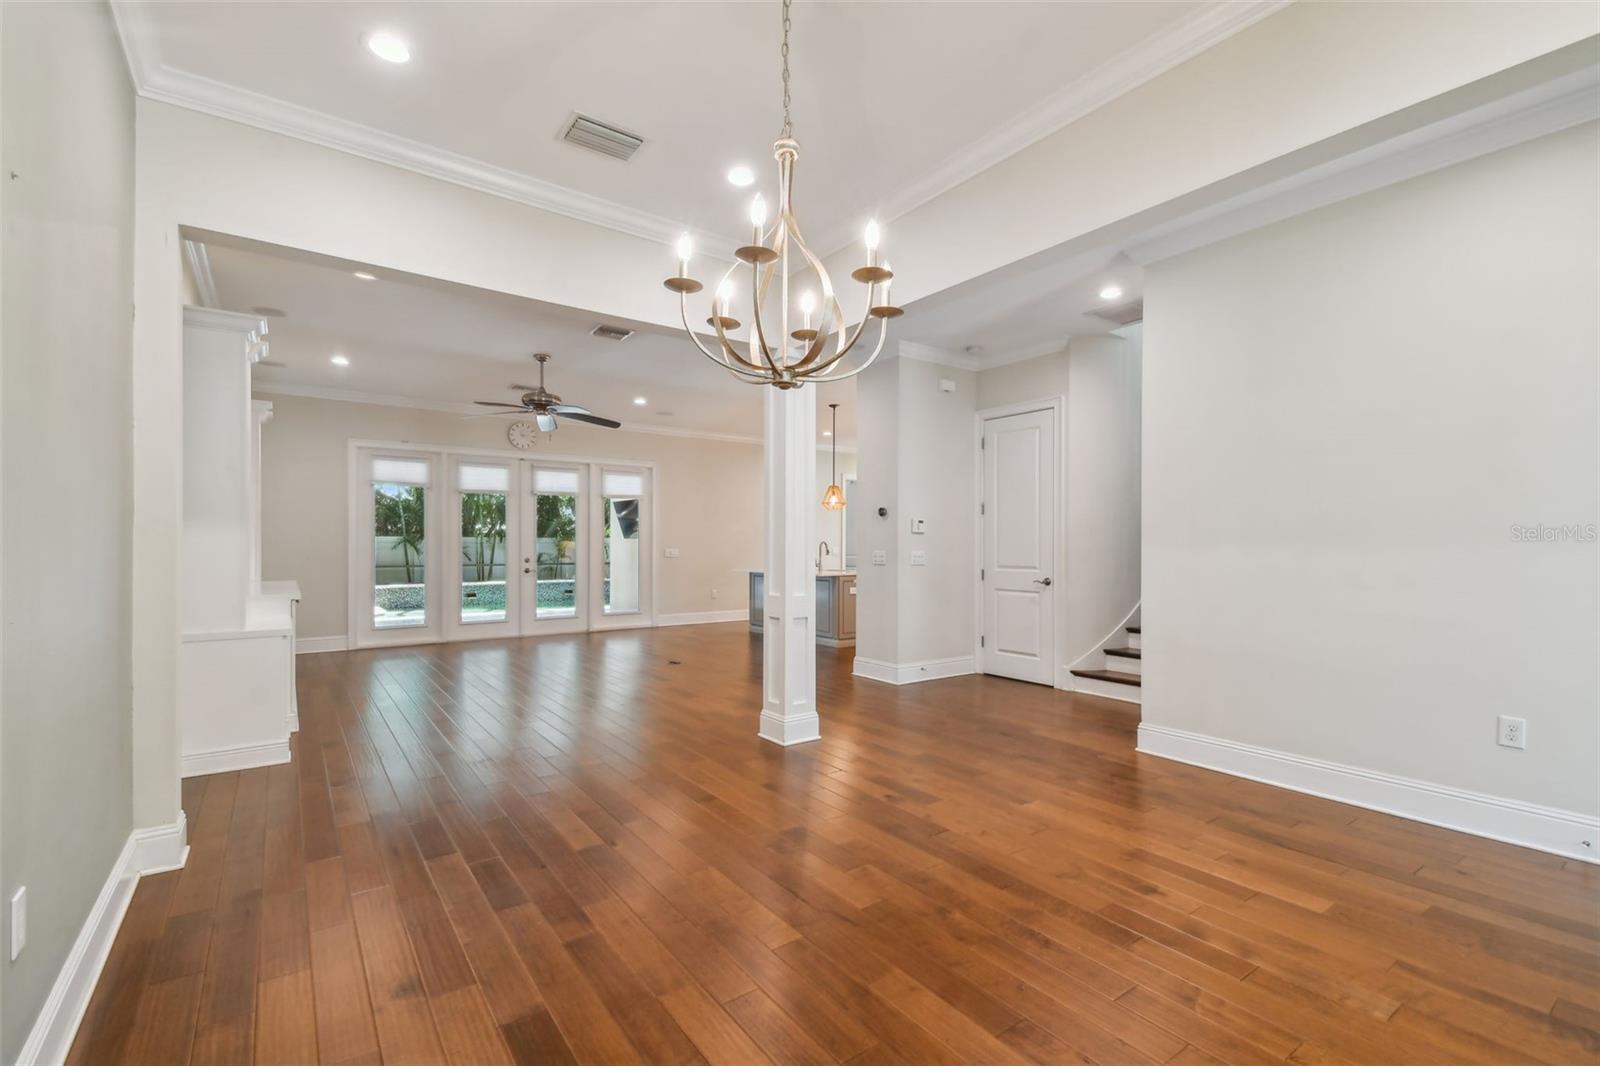
Property Description
Situated just three blocks from iconic Bayshore Boulevard and steps from the lively shops and restaurants along MacDill and Bay to Bay, this beautifully-crafted 5-bedroom, 4-bathroom, 2-car garage home offers timeless style and exceptional comfort in South Tampa’s coveted Palma Ceia neighborhood. Built in 2015 by Barritz Builders, the home welcomes you with a covered front porch and an expansive open floor plan featuring 10-foot ceilings, a formal dining room, and a custom built-in entertainment center. The gourmet kitchen is designed for both entertaining and everyday living, complete with a large quartz island, stainless steel appliances, gas cooktop and oven, auto-close cabinetry, and an oversized walk-in pantry with custom shelving. Glass sliders open to the screened lanai and pool area, where a heated spa, waterfall feature, LED lighting, and lush landscaping create a year-round outdoor oasis. A surround sound system throughout the main floor living areas and lanai enhances the luxurious setting whether entertaining or unwinding. A first-floor guest suite or office offers private access to the pool through French doors and is conveniently located next to a full bath with high-end porcelain tile and generous glass-enclosed walk-in shower. The wet bar/coffee station with beverage fridge and cabinet storage offers additional high-end refinements and functionality. The second floor includes four spacious bedrooms with custom closets, three full baths, and a large laundry room with built-in cabinetry and utility sink. The primary suite boasts a spa-like 5 piece bath with a soaking tub for relaxing, a glass-enclosed shower, split vanities, and a expansive custom walk-in closet and dressing area with a built-in shelving system. Built with quality and durability for peace of mind, the home features block construction, a hurricane-rated garage door, Hardie shake cement fiber siding, brick paver driveway and porches, and a full security system with cameras at both the front and rear of the home. Interior finishes include hand-scraped hardwood floors, 8-foot solid wood doors, maple stairs, and elegant crown molding throughout. Additional amenities include two tankless gas water heaters, a dedicated electronics closet, and a whole-home water softener system. Located in a non-flood zone and zoned for Plant High, Coleman Middle, and Roosevelt Elementary, this move-in ready residence offers both elegance and practicality. Enjoy the best of the Tampa Bay lifestyle—just a 15-minute drive to Tampa International Airport, with easy access to professional sports venues, Palma Ceia Country Club, Hyde Park Village, award-winning restaurants, and year-round waterfront recreation including boating, fishing, and beach-going. Also available for immediate LEASE.
Build Your Team
Quickly find investor-friendly professionals who can help you succeed in real estate investing at any stage of the investing journey.


Agents
Match with investor-friendly agents who can help you find, analyze, and close your next deal


Lenders
Get the best funding…find investor-friendly lenders who specialize in your deal strategy


Property Managers
Transition to passive investing. Find a trusted property management partnership that lasts.


Tax Pros & Accountants
Taxes and financial reporting made easy—find experts to create tax savings strategies, file taxes, and more
Location
Property Details
Parking
- Description: Garage
- Details: Covered, Driveway, Garage Door Opener, Attached
- Garage Spaces: 2
- Spaces Total: 0
Bedroom Information
- # of Bedrooms: 5
Bathroom Information
- # of Baths (Full): 4
- # of Baths (Total): 4.0
Interior Features
- # of Rooms: 9
- # of Stories: 2
Exterior Features
- Exterior Walls Materials: Stucco
- Foundation: Slab
- Roof Type: Gable or Hip
- Roof Material: Shingle
- Pool: Yes
HOA
- Association: None
Land Information
- Land Use: Residential
- Land Use Subtype: Single Family Residential
Lot Information
- Parcel ID: A3429183U4000044000160
- Lot Size: 5000 sqft
Property Information
- Property Type: Single Family Residence
- Style: Craftsman
- Year Built: 2015
Tax Information
- Annual Tax: $12,420
Utilities
- Water & Sewer: Public
- Heating: Central, Electric, Natural Gas, Zoned
- Cooling: Central Air, Zoned
Location
- County: Hillsborough
Listing Details
Investment Summary
- Monthly Cash Flow
- -$2,875
- Cap Rate
- 4.0%
- Cash-on-Cash Return
- -9.5%
- Debt Coverage Ratio
- 0.65
- Internal Rate of Return (5 years)
- -5.2%
Cash Flow
Net Operating Income (NOI) minus mortgage payments.
Calculation:
NOI - Mortgage Payments
Cap Rate (Market Value)
Capitalization Rate is a rate of return that compares the yearly Net Operating Income (NOI) to the market value.
Calculation:
NOI / Market Value
Cash-on-Cash Return (CoC)
Annual Cash Flow / Cash Invested
Calculation:
Annual cash flow divided by initial cash invested.
Debt Coverage Ratio (DCR)
Net Operating Income (NOI) divided by total debt payments.
Calculation:
NOI / Total Debt Payments
Internal Rate of Return (IRR)
A metric for assessing profitability over time. IRR is the discount rate at which the net present value (NPV) of all future cash flows (positive and negative) from an investment equals zero — including both periodic cash flow (such as rent) and a projected sale at the end of the holding period. It represents the expected annualized return, accounting for income, expenses, and the recovery of capital through a future sale.
Purchase Details
Purchase PriceThe price paid for the property. Purchase price:
| $1,585,000 |
|---|---|
Amount FinancedThe amount of the purchase financed through a loan. Amount financed:
| -$1,268,000 |
Down paymentThe initial payment made towards the purchase. Down payment:
| $317,000 |
Closing CostsFees and expenses associated with purchasing a property, typically ranging from 2% to 5% of the home’s purchase price, paid at the end of a home purchase to cover services like lending, title transfer, and taxes. Closing costs:
| $47,550 |
Rehab CostsCosts incurred to repair or improve the property, including: roof, flooring, exterior siding, kitchen, exterior paint, bathrooms, etc. Rehab costs:
| $0 |
Initial Cash InvestedThe total initial cash invested in the property. Calculation:Down payment + Buying costs + Rehab costs Initial cash invested:
| $364,550 |
Square Feet (SQFT)The total square footage of the property. Square feet:
| 3,235 |
Cost Per Square FootCost per square foot of the property. Calculation:Purchase Price / Square Feet Cost per square foot:
| $490 |
Monthly Rent Per Square FootMonthly rent divided by the number of square feet. This ratio helps investors compare rental income efficiency across properties, markets, and unit sizes Calculation:Monthly Rent / Square Feet Monthly rent per square foot:
| $2.81 |
Financing Details
Loan AmountThe total sum of money borrowed from a lender to finance a property purchase. Calculation:Purchase Price - Down Payment
Loan amount:
| $1,268,000 |
|---|---|
Loan to Value Ratio (LTV)Loan amount divided by the market value of the property. Calculation:Loan Amount / Market Value
Loan to value ratio:
| 80.0% |
Loan TypeThe type of loan (e.g., fixed, adjustable).
Loan type:
| Amortizing |
TermThe loan repayment period in years.
Term:
| 30 years |
Interest RateThe percentage a lender charges on the borrowed amount of a loan, determining the cost of borrowing money.
Interest rate:
| 6.625% |
Principal & Interest (PI)The principal is the portion of the loan payment that reduces the loan balance. The interest is the lender's charge for borrowing money. Calculation:(P * r * (1 + r) ** n) / ((1 + r) ** n - 1) Where:
P = Loan amount (principal)
Principal & interest:
| $8,119 |
Property TaxesAnnual taxes levied by local governments on real estate properties. These taxes fund public services like schools, roads, and emergency services.
Property tax:
| $1,035 |
InsuranceThe costs for insurance coverage to protect against financial losses due to risks like fire, natural disasters, theft, liability, or tenant-related damages. Calculation:Assumes 7% of gross rental income, unless insurance rates are specified.
Insurance:
| $637 |
Private Mortgage Insurance (PMI)A fee that borrowers pay when they take out a conventional loan with a loan-to-value (LTV) ratio above 80%.
Private mortgage insurance (PMI):
| $0 |
Monthly PaymentThe fixed amount a borrower pays each month to repay a loan. It typically includes principal and interest (P&I) and may also cover property taxes, insurance, HOA fees, and PMI if escrowed. Monthly payment:
| $9,791 |
Operating Income
| % Rent | Monthly | Yearly | |
|---|---|---|---|
Gross RentThe total rental income received from tenants before deducting any expenses. Includes base rent, late fees, pet fees, parking fees, and other recurring charges.
Gross rent:
| $9,100 | $109,200 | |
Vacancy LossExpected loss of rent due to vacancies.
Vacancy loss:
(6%)
| 6% | -$546 | -$6,552 |
Operating IncomeGross rental income minus vacancy loss. Calculation:Gross rent - Vacancy loss
Operating income:
| $8,554 | $102,648 |
Operating Expenses
| % Rent | Monthly | Yearly | |
|---|---|---|---|
Property TaxesAnnual taxes levied by local governments on real estate properties. These taxes fund public services like schools, roads, and emergency services. | 11% | -$1,035 | -$12,421 |
InsuranceThe costs for insurance coverage to protect against financial losses due to risks like fire, natural disasters, theft, liability, or tenant-related damages. Calculation:Assumes 7% of gross rental income, unless insurance rates are specified. | 7% | -$637 | -$7,644 |
Property ManagementThe costs associated with hiring a property manager to handle the day-to-day operations of a rental property. Includes management fees, leasing fes, eviction fees, etc. Calculation:Assumes 8% of gross rental income. | 8% | -$728 | -$8,736 |
Repairs & MaintenanceOngoing costs for routine upkeep and minor fixes needed to keep a property in good working condition. Calculation:Assumes 5% of gross rental income. Varies by property age and condition. | 5% | -$455 | -$5,460 |
Capital ExpensesLarge, infrequent costs for major improvements or replacements, like a new roof, HVAC system, or appliances. Calculation:Assumes 5% of gross rental income. Varies by property age. | 5% | -$455 | -$5,460 |
HOA FeesRegular dues paid to a Homeowners Association for community maintenance, amenities, and management. Similar fees include: Condo Association Fees, Co-op Maintenance Fees, etc. | n/a | n/a | n/a |
Operating ExpensesRecurring costs required to maintain and manage a rental property, including property taxes, insurance, maintenance, repairs, utilities (if paid by the owner), property management fees, and other day-to-day expenses. Calculation:Insurance + Property Taxes + Property Management + Repairs & Maintenance + Capital Expenditures + HOA Fees | 36% | -$3,310 | -$39,721 |
Cash Flow
| Monthly | Yearly | |
|---|---|---|
Net Operating Income (NOI)The income generated from a property after deducting all operating expenses but before deducting mortgage payments, taxes, and capital expenditures. Calculation:Gross Operating Income - Operating Expenses
Net operating income:
| $5,244 | $62,928 |
Mortgage PaymentThe fixed amount a borrower pays each month to repay a loan. It typically includes principal and interest (P&I) and may also cover property taxes, insurance, HOA fees, and PMI if escrowed. | -$8,119 | -$97,428 |
Cash FlowNet Operating Income (NOI) minus mortgage payments. Calculation:NOI - Mortgage Payments | -$2,875 | -$34,500 |