
$1,440,000
Investment Summary
- Monthly Cash Flow
- -$1,844
- Cap Rate
- 4.6%
- Cash-on-Cash Return
- -6.7%
- Debt Coverage Ratio
- 0.75
- Internal Rate of Return (5 years)
- -2.5%
Cash Flow
Net Operating Income (NOI) minus mortgage payments.
Calculation:
NOI - Mortgage Payments
Cap Rate (Market Value)
Capitalization Rate is a rate of return that compares the yearly Net Operating Income (NOI) to the market value.
Calculation:
NOI / Market Value
Cash-on-Cash Return (CoC)
Annual Cash Flow / Cash Invested
Calculation:
Annual cash flow divided by initial cash invested.
Debt Coverage Ratio (DCR)
Net Operating Income (NOI) divided by total debt payments.
Calculation:
NOI / Total Debt Payments
Internal Rate of Return (IRR)
A metric for assessing profitability over time. IRR is the discount rate at which the net present value (NPV) of all future cash flows (positive and negative) from an investment equals zero — including both periodic cash flow (such as rent) and a projected sale at the end of the holding period. It represents the expected annualized return, accounting for income, expenses, and the recovery of capital through a future sale.
Property Description
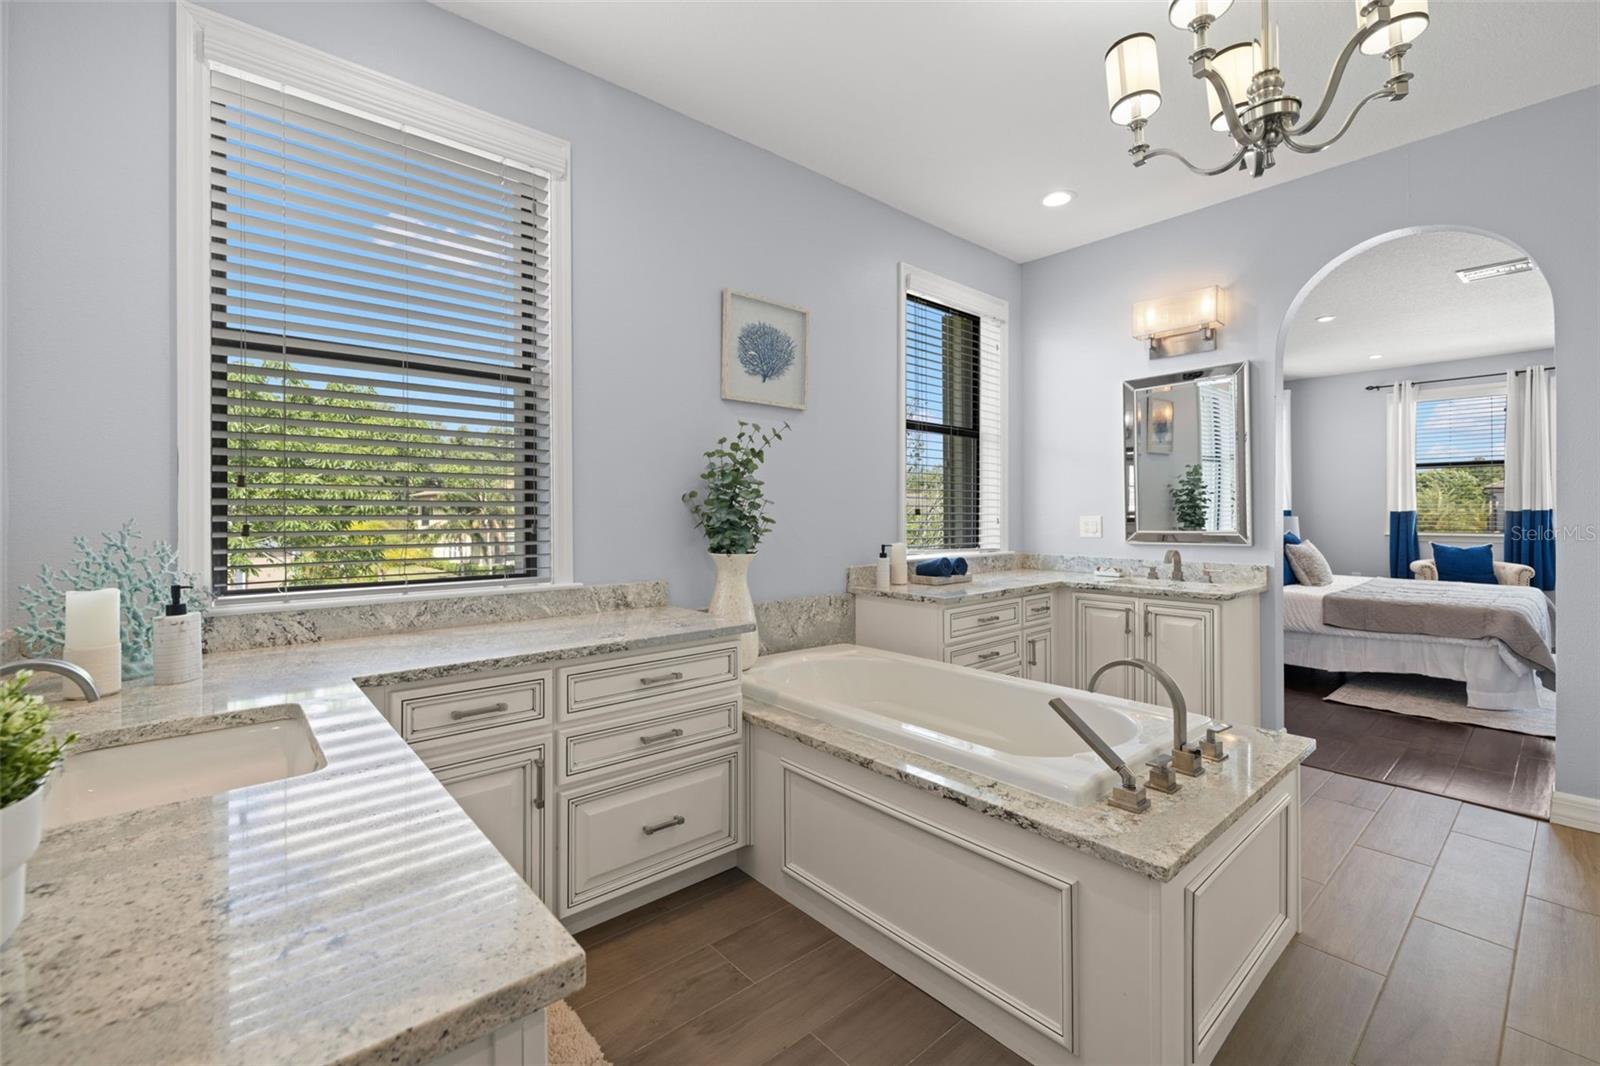
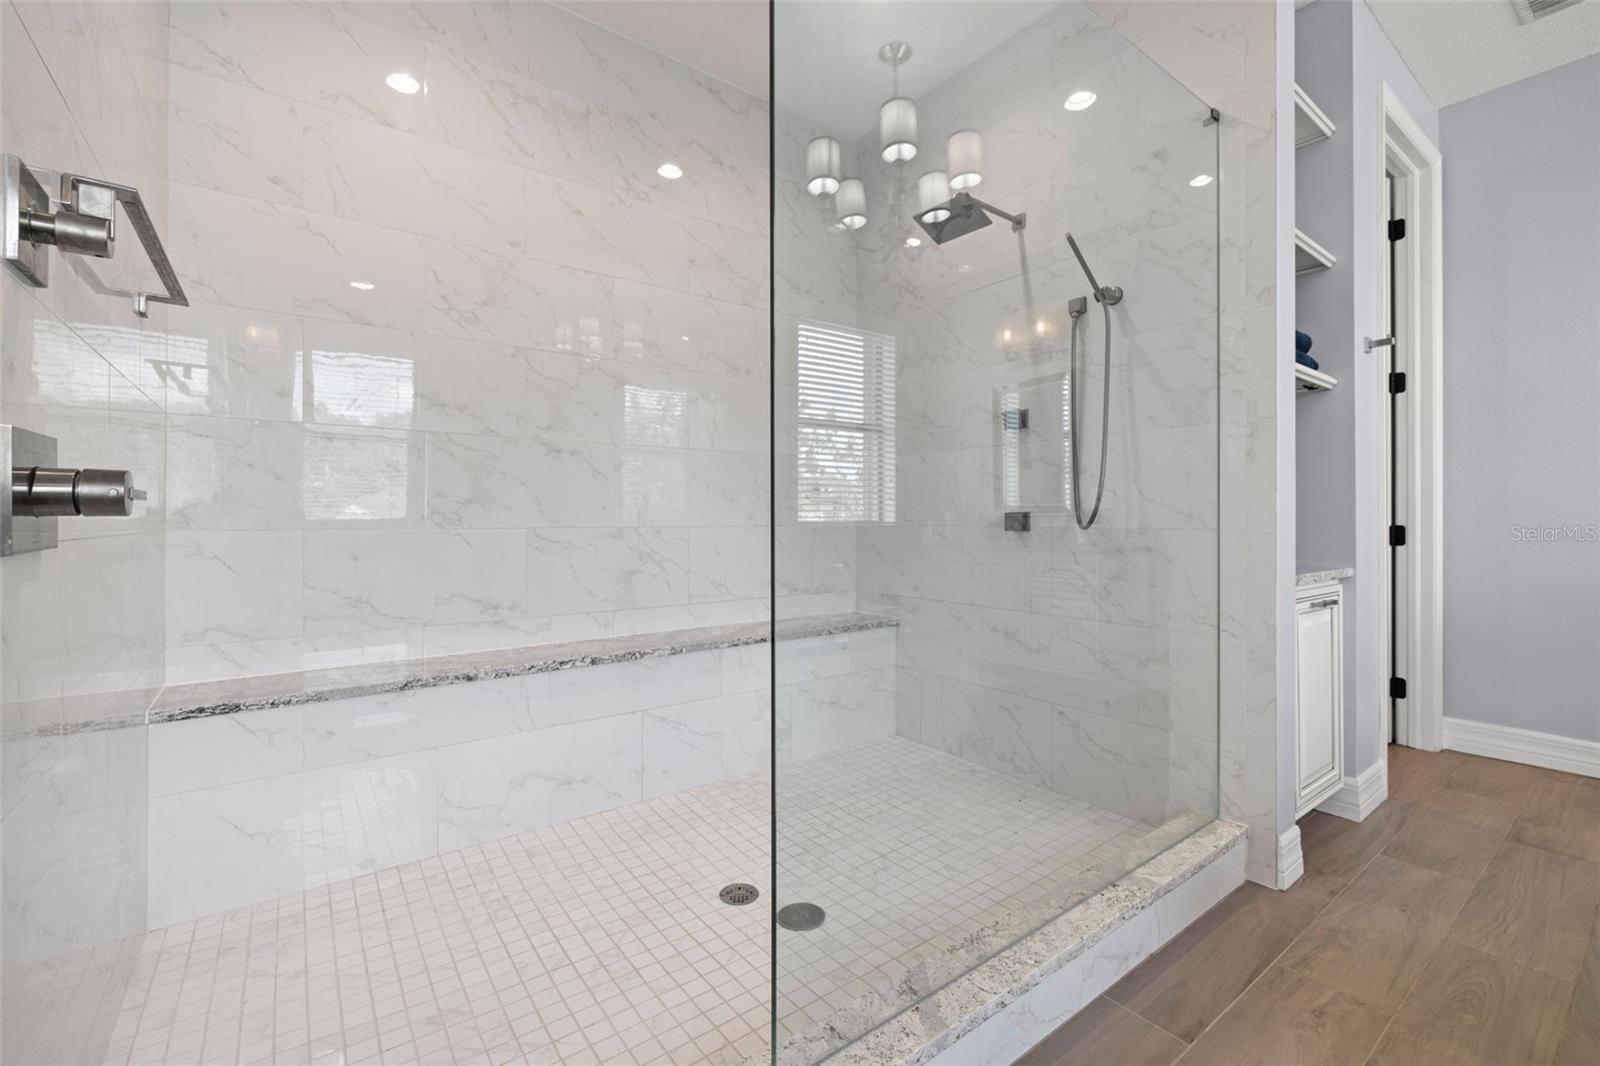
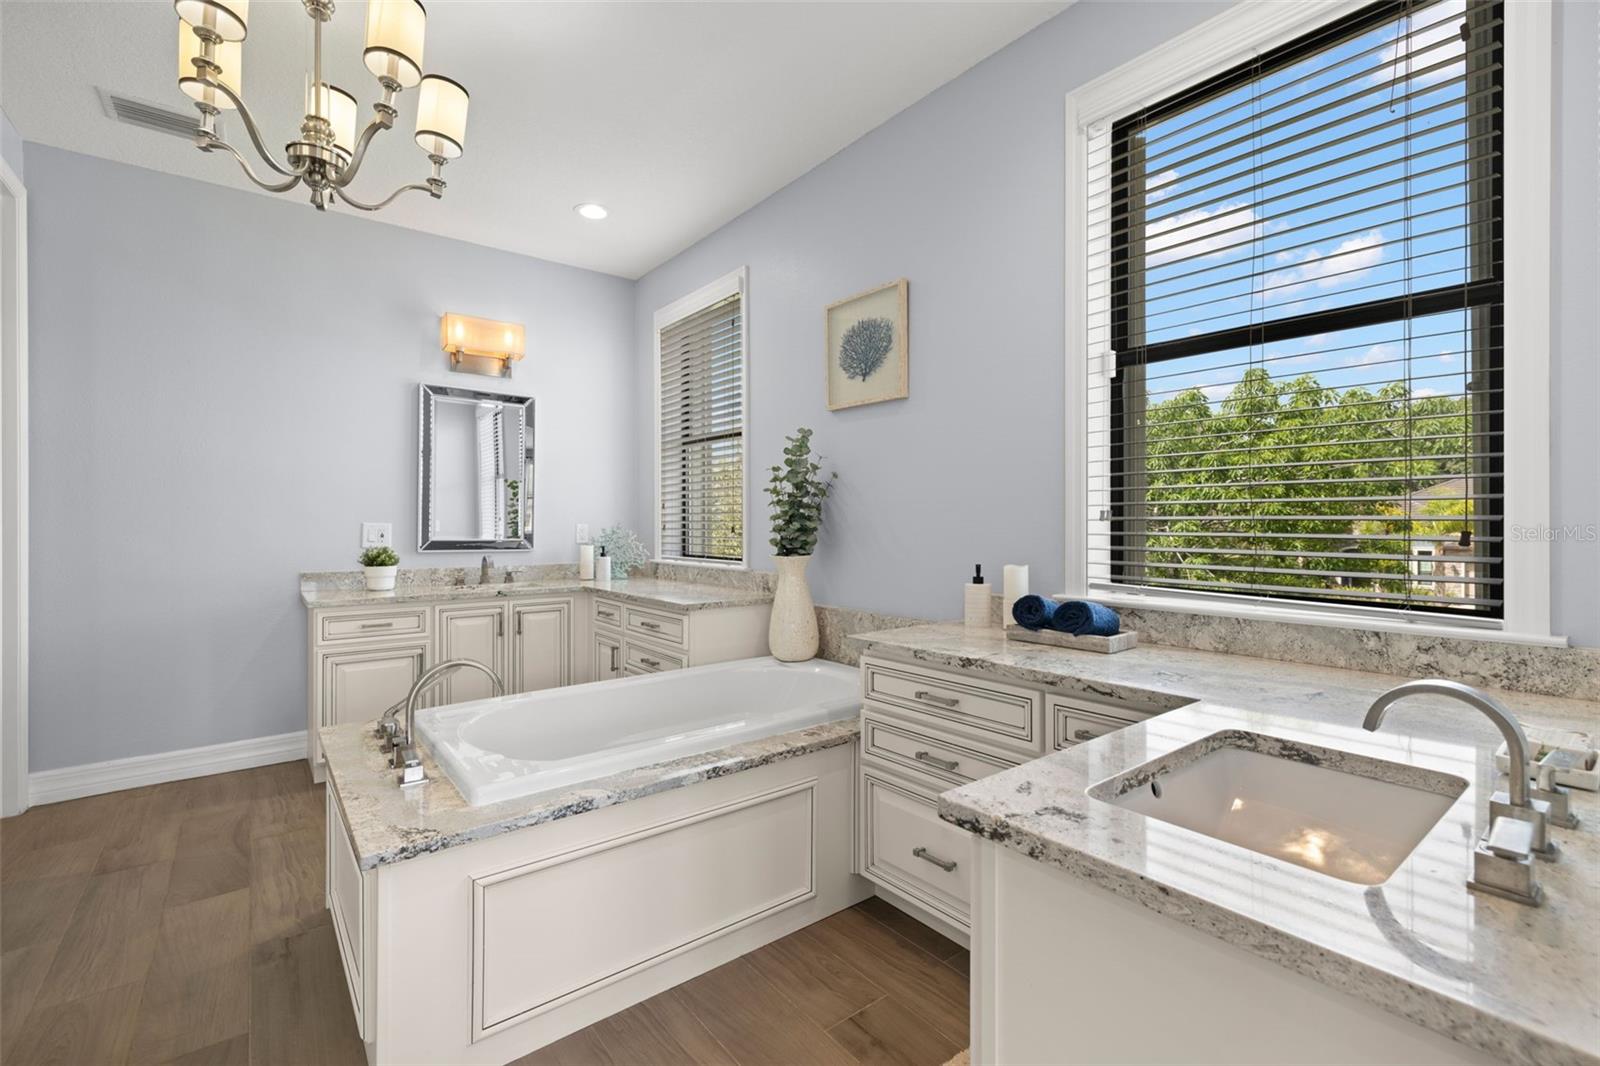
We are pleased to present this Magnificent Two Story Pool Home Built by Standard Pacific, The Alexandria Model located in the Desirable Cordoba Estates Gated Community! This Fabulous home offers 5364 sq ft of living space and is situated on a SPECTACULAR fully fenced (PVC Fence) Corner Massive Sized Lot- .63 acres- 27,436 sq ft. You will enjoy the privacy! This highly upgraded property features 5 SPACIOUS BEDROOMS - 2 TRUE Primary Bedrooms each with Ensuite Spa Like Baths (1 on 1st floor & 2nd on 2nd level)+ OFFICE/DEN, ENORMOUS BONUS ROOM + Florida Room- 5 FULL BATHS & 1 half pool bath. The Primary Ensuite Baths are super luxurious! Double Vanities, Garden Tubs & Oversized Showers in both! 4 Very Spacious Bedrooms each with an ensuite bath~ Elegant 1st Floor DEN/OFFICE with double entry French Doors & Coffered Ceilings. You will appreciate the open floor plan, Custom Crown/Chair Molding, Coffered & Volume Ceilings! The GOURMET KITCHEN offers plenty of cabinet storage, a huge center island with pendant lighting, granite countertops, glass tile backsplash, 5 Burner Gas Thermador Cooktop/Thermador Range Hood, Bosch Dishwasher, Double Wall Ovens, Pot Filler, dual stainless sink with upgraded faucet & huge walk-in pantry with wood shelving. Enjoy the comfortable breakfast room with charming Chicago Brick Accent Wall & custom built-in overlooking the Resort Style Pool. The Amazing Resort Style Salt Chlorinated Heated Pool features a wide Sun Shelf, 2 side benches with jacuzzi jets on each side, programmable fountains/bubblers, color changing pool lighting with Aqua Link control phone app & Travertine Pool Tiles. You will enjoy the large Master Forge Grill + 2 burners w/griddle & covered patio with Travertine Tiles are all great for entertaining or just relaxing with family & friends. Additional Features/Upgrades Included: Fresh Exterior Paint March 2025, Hurricane Shutters, Generac Gas Generator, Maple Flooring at Stairs & 2nd Floor, Front Windows Miami Dade Hurricane Proof Windows, Wall Sconces, Recessed Lighting & upgraded lighting, driveway pavers, PVC Vinyl Privacy Fence, tile plank flooring, exterior gutters, 3 loft garage storage racks, 3 Car Garage with 2 side automatic openers, V-Line Wall Security Safe, Transom Windows, Water Softener/Sulfur System & LG Refrigerator 2022. The fabulous amenity center has a beach-entry swimming pool, a kid-friendly splash area, playground with swings, slides and climbing equipment, Basketball, Racquet Ball & Tennis Courts, picnic area, something for everyone including a dog park for your furry family member to play off the leash. This location offers a wealth of convenience to the finest activities; Tampa Premium Outlets, Dining, Shopping, Entertainment, Tampa Intl Airport, Moffitt, sports venues, & access to major highways, I-75, I-275. X Flood Zone-No flood insurance required! 17 Miles to Downtown Tampa.
Build Your Team
Quickly find investor-friendly professionals who can help you succeed in real estate investing at any stage of the investing journey.


Agents
Match with investor-friendly agents who can help you find, analyze, and close your next deal


Lenders
Get the best funding…find investor-friendly lenders who specialize in your deal strategy


Property Managers
Transition to passive investing. Find a trusted property management partnership that lasts.


Tax Pros & Accountants
Taxes and financial reporting made easy—find experts to create tax savings strategies, file taxes, and more
Location
Property Details
Parking
- Description: Off Street
- Details: Driveway, Garage Door Opener, Oversized, Attached
- Garage Spaces: 3
- Spaces Total: 0
Bedroom Information
- # of Bedrooms: 5
Bathroom Information
- # of Baths (Full): 5
- # of Baths (Partial): 1
- # of Baths (Total): 6.0
Interior Features
- # of Rooms: 14
- # of Stories: 2
Exterior Features
- Exterior Walls Materials: Stucco
- Foundation: Slab
- Roof Type: Gable or Hip
- Roof Material: Shingle
- Pool: Yes
HOA
- Has HOA: Yes
- Association: Richard Schrutt- HomeRiver
- HOA Fee: $385/semi-annually
Land Information
- Land Use: Residential
- Land Use Subtype: Single Family Residential
Lot Information
- Parcel ID: U1727199SI000008000020
- Lot Size: 27436 sqft
Property Information
- Property Type: Single Family Residence
- Style: Contemporary, Florida, Mediterranean, Traditional
- Year Built: 2014
Tax Information
- Annual Tax: $14,822
Utilities
- Water & Sewer: Private, Well
- Heating: Central, Electric
- Cooling: Central Air
Location
- County: Hillsborough
Listing Details
Investment Summary
- Monthly Cash Flow
- -$1,844
- Cap Rate
- 4.6%
- Cash-on-Cash Return
- -6.7%
- Debt Coverage Ratio
- 0.75
- Internal Rate of Return (5 years)
- -2.5%
Cash Flow
Net Operating Income (NOI) minus mortgage payments.
Calculation:
NOI - Mortgage Payments
Cap Rate (Market Value)
Capitalization Rate is a rate of return that compares the yearly Net Operating Income (NOI) to the market value.
Calculation:
NOI / Market Value
Cash-on-Cash Return (CoC)
Annual Cash Flow / Cash Invested
Calculation:
Annual cash flow divided by initial cash invested.
Debt Coverage Ratio (DCR)
Net Operating Income (NOI) divided by total debt payments.
Calculation:
NOI / Total Debt Payments
Internal Rate of Return (IRR)
A metric for assessing profitability over time. IRR is the discount rate at which the net present value (NPV) of all future cash flows (positive and negative) from an investment equals zero — including both periodic cash flow (such as rent) and a projected sale at the end of the holding period. It represents the expected annualized return, accounting for income, expenses, and the recovery of capital through a future sale.
Purchase Details
Purchase PriceThe price paid for the property. Purchase price:
| $1,440,000 |
|---|---|
Amount FinancedThe amount of the purchase financed through a loan. Amount financed:
| -$1,152,000 |
Down paymentThe initial payment made towards the purchase. Down payment:
| $288,000 |
Closing CostsFees and expenses associated with purchasing a property, typically ranging from 2% to 5% of the home’s purchase price, paid at the end of a home purchase to cover services like lending, title transfer, and taxes. Closing costs:
| $43,200 |
Rehab CostsCosts incurred to repair or improve the property, including: roof, flooring, exterior siding, kitchen, exterior paint, bathrooms, etc. Rehab costs:
| $0 |
Initial Cash InvestedThe total initial cash invested in the property. Calculation:Down payment + Buying costs + Rehab costs Initial cash invested:
| $331,200 |
Square Feet (SQFT)The total square footage of the property. Square feet:
| 5,364 |
Cost Per Square FootCost per square foot of the property. Calculation:Purchase Price / Square Feet Cost per square foot:
| $268 |
Monthly Rent Per Square FootMonthly rent divided by the number of square feet. This ratio helps investors compare rental income efficiency across properties, markets, and unit sizes Calculation:Monthly Rent / Square Feet Monthly rent per square foot:
| $1.85 |
Financing Details
Loan AmountThe total sum of money borrowed from a lender to finance a property purchase. Calculation:Purchase Price - Down Payment
Loan amount:
| $1,152,000 |
|---|---|
Loan to Value Ratio (LTV)Loan amount divided by the market value of the property. Calculation:Loan Amount / Market Value
Loan to value ratio:
| 80.0% |
Loan TypeThe type of loan (e.g., fixed, adjustable).
Loan type:
| Amortizing |
TermThe loan repayment period in years.
Term:
| 30 years |
Interest RateThe percentage a lender charges on the borrowed amount of a loan, determining the cost of borrowing money.
Interest rate:
| 6.625% |
Principal & Interest (PI)The principal is the portion of the loan payment that reduces the loan balance. The interest is the lender's charge for borrowing money. Calculation:(P * r * (1 + r) ** n) / ((1 + r) ** n - 1) Where:
P = Loan amount (principal)
Principal & interest:
| $7,376 |
Property TaxesAnnual taxes levied by local governments on real estate properties. These taxes fund public services like schools, roads, and emergency services.
Property tax:
| $1,235 |
InsuranceThe costs for insurance coverage to protect against financial losses due to risks like fire, natural disasters, theft, liability, or tenant-related damages. Calculation:Assumes 7% of gross rental income, unless insurance rates are specified.
Insurance:
| $693 |
Private Mortgage Insurance (PMI)A fee that borrowers pay when they take out a conventional loan with a loan-to-value (LTV) ratio above 80%.
Private mortgage insurance (PMI):
| $0 |
Monthly PaymentThe fixed amount a borrower pays each month to repay a loan. It typically includes principal and interest (P&I) and may also cover property taxes, insurance, HOA fees, and PMI if escrowed. Monthly payment:
| $9,304 |
Operating Income
| % Rent | Monthly | Yearly | |
|---|---|---|---|
Gross RentThe total rental income received from tenants before deducting any expenses. Includes base rent, late fees, pet fees, parking fees, and other recurring charges.
Gross rent:
| $9,900 | $118,800 | |
Vacancy LossExpected loss of rent due to vacancies.
Vacancy loss:
(6%)
| 6% | -$594 | -$7,128 |
Operating IncomeGross rental income minus vacancy loss. Calculation:Gross rent - Vacancy loss
Operating income:
| $9,306 | $111,672 |
Operating Expenses
| % Rent | Monthly | Yearly | |
|---|---|---|---|
Property TaxesAnnual taxes levied by local governments on real estate properties. These taxes fund public services like schools, roads, and emergency services. | 12% | -$1,235 | -$14,822 |
InsuranceThe costs for insurance coverage to protect against financial losses due to risks like fire, natural disasters, theft, liability, or tenant-related damages. Calculation:Assumes 7% of gross rental income, unless insurance rates are specified. | 7% | -$693 | -$8,316 |
Property ManagementThe costs associated with hiring a property manager to handle the day-to-day operations of a rental property. Includes management fees, leasing fes, eviction fees, etc. Calculation:Assumes 8% of gross rental income. | 8% | -$792 | -$9,504 |
Repairs & MaintenanceOngoing costs for routine upkeep and minor fixes needed to keep a property in good working condition. Calculation:Assumes 5% of gross rental income. Varies by property age and condition. | 5% | -$495 | -$5,940 |
Capital ExpensesLarge, infrequent costs for major improvements or replacements, like a new roof, HVAC system, or appliances. Calculation:Assumes 5% of gross rental income. Varies by property age. | 5% | -$495 | -$5,940 |
HOA FeesRegular dues paid to a Homeowners Association for community maintenance, amenities, and management. Similar fees include: Condo Association Fees, Co-op Maintenance Fees, etc. | 1% | -$64 | -$768 |
Operating ExpensesRecurring costs required to maintain and manage a rental property, including property taxes, insurance, maintenance, repairs, utilities (if paid by the owner), property management fees, and other day-to-day expenses. Calculation:Insurance + Property Taxes + Property Management + Repairs & Maintenance + Capital Expenditures + HOA Fees | 38% | -$3,774 | -$45,290 |
Cash Flow
| Monthly | Yearly | |
|---|---|---|
Net Operating Income (NOI)The income generated from a property after deducting all operating expenses but before deducting mortgage payments, taxes, and capital expenditures. Calculation:Gross Operating Income - Operating Expenses
Net operating income:
| $5,532 | $66,384 |
Mortgage PaymentThe fixed amount a borrower pays each month to repay a loan. It typically includes principal and interest (P&I) and may also cover property taxes, insurance, HOA fees, and PMI if escrowed. | -$7,376 | -$88,512 |
Cash FlowNet Operating Income (NOI) minus mortgage payments. Calculation:NOI - Mortgage Payments | $1,844 | $22,128 |