$1,475,000
Investment Summary
We noticed that property taxes are missing—this is a standard expense and should be considered in your estimate.
- Monthly Cash Flow
- -$7,353
- Cap Rate
- 0.2%
- Cash-on-Cash Return
- -26.0%
- Debt Coverage Ratio
- 0.03
- Internal Rate of Return (5 years)
- -21.1%
Cash Flow
Net Operating Income (NOI) minus mortgage payments.
Calculation:
NOI - Mortgage Payments
Cap Rate (Market Value)
Capitalization Rate is a rate of return that compares the yearly Net Operating Income (NOI) to the market value.
Calculation:
NOI / Market Value
Cash-on-Cash Return (CoC)
Annual Cash Flow / Cash Invested
Calculation:
Annual cash flow divided by initial cash invested.
Debt Coverage Ratio (DCR)
Net Operating Income (NOI) divided by total debt payments.
Calculation:
NOI / Total Debt Payments
Internal Rate of Return (IRR)
A metric for assessing profitability over time. IRR is the discount rate at which the net present value (NPV) of all future cash flows (positive and negative) from an investment equals zero — including both periodic cash flow (such as rent) and a projected sale at the end of the holding period. It represents the expected annualized return, accounting for income, expenses, and the recovery of capital through a future sale.
Property Description
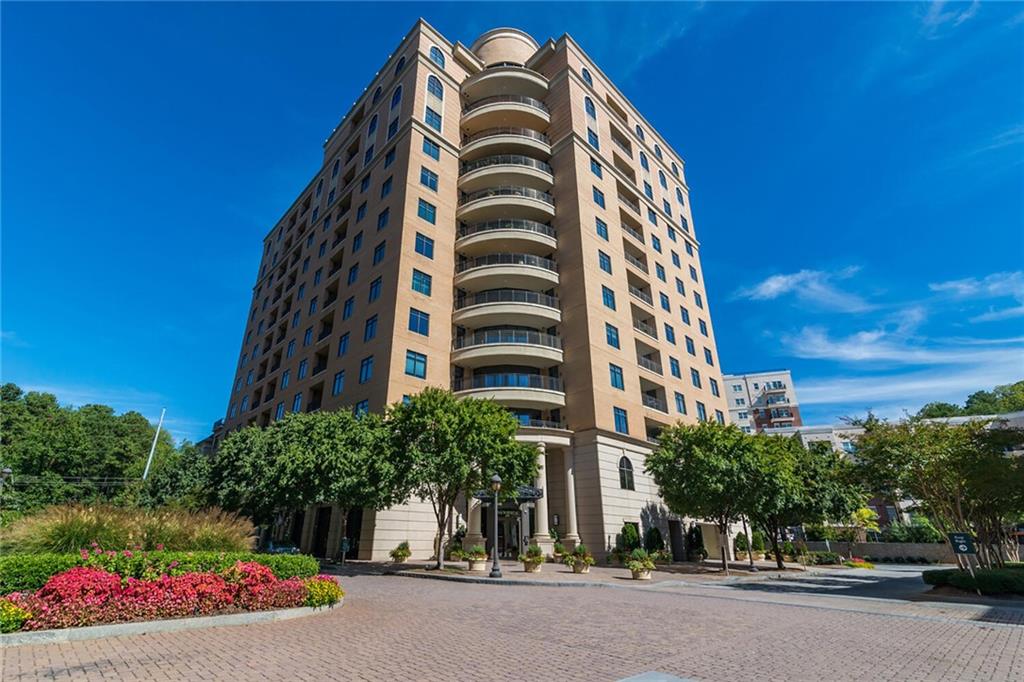
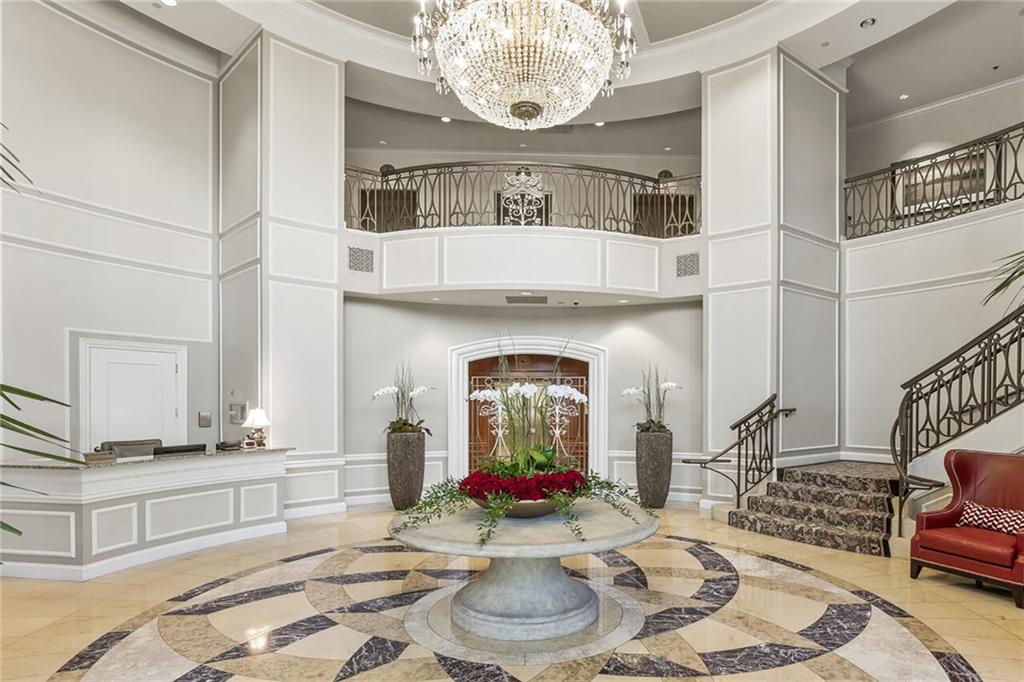
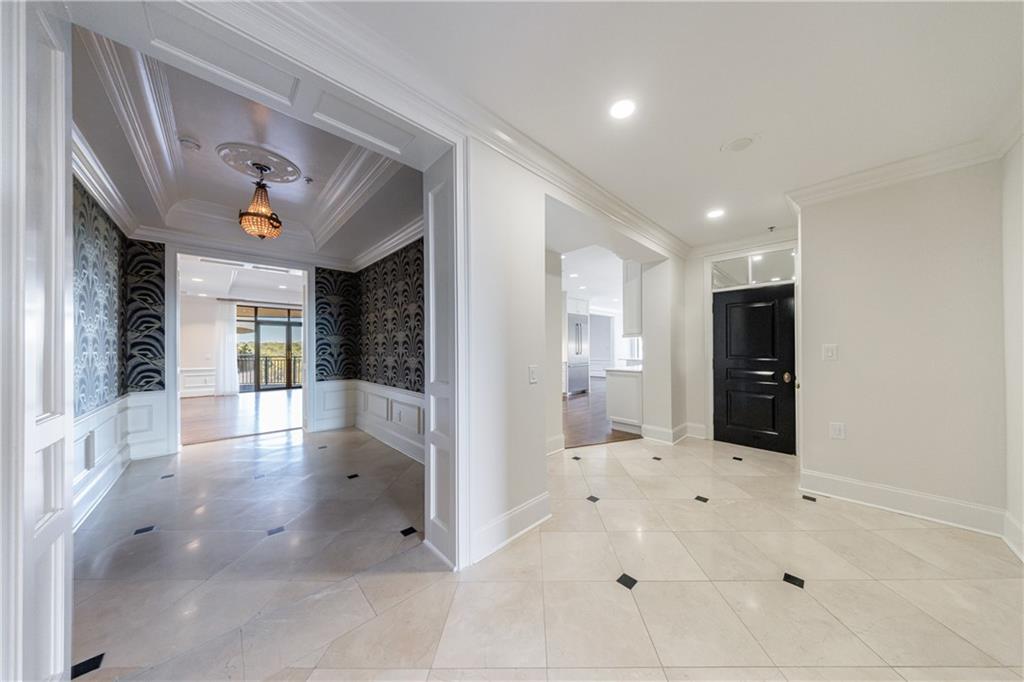
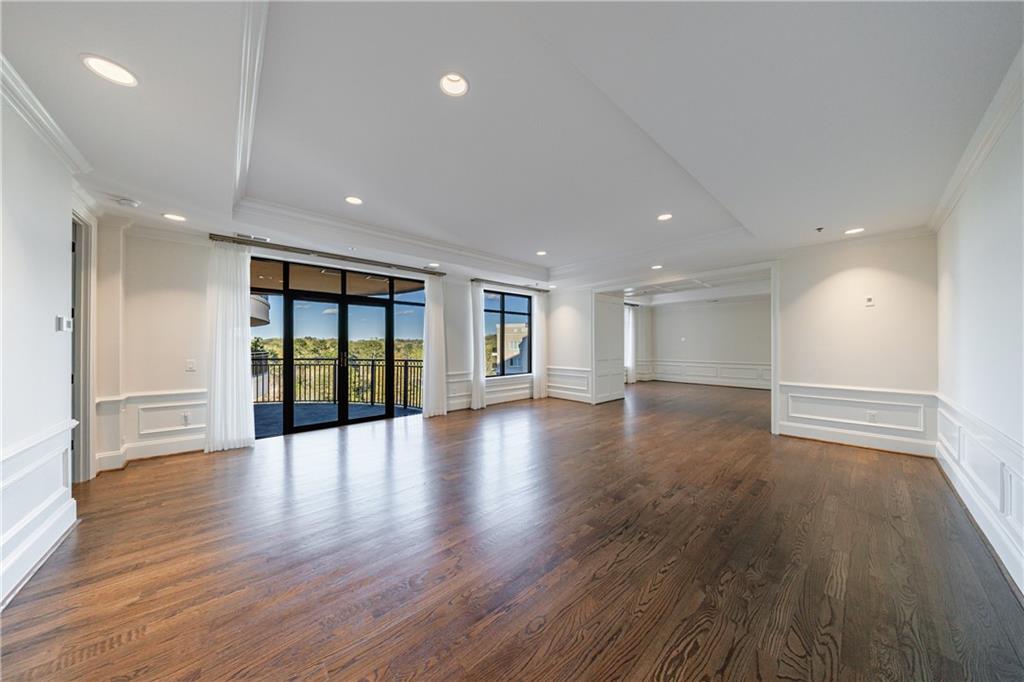
Step into a world of refined elegance and timeless sophistication at The Borghese, where luxury living reaches new heights in this extraordinary residence boasting more than 4,000 square feet of single-level perfection. This is not only one of the largest single-level condominiums in the city, but also one of the rarest opportunities, a home of grand scale and exclusivity in a building with only fifty-five residences, no rentals permitted, and many owners enjoying their homes as seasonal retreats. From the moment you enter, light pours through floor-to-ceiling windows, illuminating soaring ceilings, limestone and hardwood floors, and exquisite moldings that frame every room with quiet grandeur. The expansive living room opens seamlessly to a private balcony and a formal dining room, creating a dramatic stage for elegant entertaining. A chef’s kitchen designed for both beauty and function dazzles with marble countertops, a commanding island, custom cabinetry, and a walk-in pantry, setting the scene for intimate dinners or lavish gatherings. Beyond the gracious entry hall, a richly appointed library lined with built-ins invites quiet moments of retreat, while a warm and inviting family room provides the perfect balance of comfort and style. The primary suite is a sanctuary of indulgence, offering an opulent en-suite bath and an immense custom-designed closet that feels more like a private boutique. A secondary suite, large enough to rival the primary, opens to its own balcony, creating a secluded haven for guests or residents alike. A third room offers the space for overnight guests, an additional office, or a den. Life at The Borghese extends far beyond the walls of this remarkable home, where beautifully landscaped grounds and white-glove services redefine everyday living. A 24/7 concierge ensures peace of mind, while a saltwater pool, state-of-the-art fitness center with sauna and massage room, conference facilities, catering kitchen, guest suites, and vibrant weekly social gatherings offer a lifestyle that is as effortless as it is luxurious. Perfectly situated near Buckhead, Vinings, and Downtown Atlanta, with premier shopping and dining just steps from your door, this residence includes three assigned parking spaces, two balconies, and a private storage unit. HOA includes all amenities along with gas, cable, internet, water, reserve fund and a water based heat pump for lower energy bills, and with the assurance of a warrantable condominium, this home represents not just a place to live, but a rare opportunity to embrace the very best of Atlanta’s luxury lifestyle.
Build Your Team
Quickly find investor-friendly professionals who can help you succeed in real estate investing at any stage of the investing journey.


Agents
Match with investor-friendly agents who can help you find, analyze, and close your next deal


Lenders
Get the best funding…find investor-friendly lenders who specialize in your deal strategy


Property Managers
Transition to passive investing. Find a trusted property management partnership that lasts.


Tax Pros & Accountants
Taxes and financial reporting made easy—find experts to create tax savings strategies, file taxes, and more
Location
Property Details
Parking
- Description: Assigned, Attached, Covered, Deeded, Garage, Garage Door Opener
- Details: Assigned, Attached, Covered, Deeded, Garage, Garage Door Opener
- Garage Spaces: 3
- Spaces Total: 3
Bedroom Information
- # of Bedrooms: 3
Bathroom Information
- # of Baths (Full): 2
- # of Baths (Total): 3.0
Interior Features
- # of Rooms: 7
- # of Stories: 1
- Basement Description: None
Exterior Features
- Exterior Walls Materials: Rock, Stone
- Foundation: See Remarks
- Roof Material: Composition
HOA
- Has HOA: Yes
- Association: CMA
- HOA Fee: $3,799/monthly
Land Information
- Land Use: Residential
- Land Use Subtype: Condominium Unit
Lot Information
- Parcel ID: 170182LL1904
- Lot Size: 0 sqft
Property Information
- Property Type: Condominium
- Style: Contemporary, European, High Rise (6 or more stories), Traditional
- Year Built: 2001
Tax Information
- Annual Tax: $0
Utilities
- Water & Sewer: Public
- Heating: Central, Electric
- Cooling: Electric, Zoned
Location
- County: Fulton
Listing Details
Investment Summary
We noticed that property taxes are missing—this is a standard expense and should be considered in your estimate.
- Monthly Cash Flow
- -$7,353
- Cap Rate
- 0.2%
- Cash-on-Cash Return
- -26.0%
- Debt Coverage Ratio
- 0.03
- Internal Rate of Return (5 years)
- -21.1%
Cash Flow
Net Operating Income (NOI) minus mortgage payments.
Calculation:
NOI - Mortgage Payments
Cap Rate (Market Value)
Capitalization Rate is a rate of return that compares the yearly Net Operating Income (NOI) to the market value.
Calculation:
NOI / Market Value
Cash-on-Cash Return (CoC)
Annual Cash Flow / Cash Invested
Calculation:
Annual cash flow divided by initial cash invested.
Debt Coverage Ratio (DCR)
Net Operating Income (NOI) divided by total debt payments.
Calculation:
NOI / Total Debt Payments
Internal Rate of Return (IRR)
A metric for assessing profitability over time. IRR is the discount rate at which the net present value (NPV) of all future cash flows (positive and negative) from an investment equals zero — including both periodic cash flow (such as rent) and a projected sale at the end of the holding period. It represents the expected annualized return, accounting for income, expenses, and the recovery of capital through a future sale.
Purchase Details
Purchase PriceThe price paid for the property. Purchase price:
| $1,475,000 |
|---|---|
Amount FinancedThe amount of the purchase financed through a loan. Amount financed:
| -$1,180,000 |
Down paymentThe initial payment made towards the purchase. Down payment:
| $295,000 |
Closing CostsFees and expenses associated with purchasing a property, typically ranging from 2% to 5% of the home’s purchase price, paid at the end of a home purchase to cover services like lending, title transfer, and taxes. Closing costs:
| $44,250 |
Rehab CostsCosts incurred to repair or improve the property, including: roof, flooring, exterior siding, kitchen, exterior paint, bathrooms, etc. Rehab costs:
| $0 |
Initial Cash InvestedThe total initial cash invested in the property. Calculation:Down payment + Buying costs + Rehab costs Initial cash invested:
| $339,250 |
Square Feet (SQFT)The total square footage of the property. Square feet:
| 4,055 |
Cost Per Square FootCost per square foot of the property. Calculation:Purchase Price / Square Feet Cost per square foot:
| $364 |
Monthly Rent Per Square FootMonthly rent divided by the number of square feet. This ratio helps investors compare rental income efficiency across properties, markets, and unit sizes Calculation:Monthly Rent / Square Feet Monthly rent per square foot:
| $1.43 |
Financing Details
Loan AmountThe total sum of money borrowed from a lender to finance a property purchase. Calculation:Purchase Price - Down Payment
Loan amount:
| $1,180,000 |
|---|---|
Loan to Value Ratio (LTV)Loan amount divided by the market value of the property. Calculation:Loan Amount / Market Value
Loan to value ratio:
| 80.0% |
Loan TypeThe type of loan (e.g., fixed, adjustable).
Loan type:
| Amortizing |
TermThe loan repayment period in years.
Term:
| 30 years |
Interest RateThe percentage a lender charges on the borrowed amount of a loan, determining the cost of borrowing money.
Interest rate:
| 6.625% |
Principal & Interest (PI)The principal is the portion of the loan payment that reduces the loan balance. The interest is the lender's charge for borrowing money. Calculation:(P * r * (1 + r) ** n) / ((1 + r) ** n - 1) Where:
P = Loan amount (principal)
Principal & interest:
| $7,556 |
Property TaxesAnnual taxes levied by local governments on real estate properties. These taxes fund public services like schools, roads, and emergency services.
Property tax:
| $0 |
InsuranceThe costs for insurance coverage to protect against financial losses due to risks like fire, natural disasters, theft, liability, or tenant-related damages. Calculation:Assumes 7% of gross rental income, unless insurance rates are specified.
Insurance:
| $406 |
Private Mortgage Insurance (PMI)A fee that borrowers pay when they take out a conventional loan with a loan-to-value (LTV) ratio above 80%.
Private mortgage insurance (PMI):
| $0 |
Monthly PaymentThe fixed amount a borrower pays each month to repay a loan. It typically includes principal and interest (P&I) and may also cover property taxes, insurance, HOA fees, and PMI if escrowed. Monthly payment:
| $7,962 |
Operating Income
| % Rent | Monthly | Yearly | |
|---|---|---|---|
Gross RentThe total rental income received from tenants before deducting any expenses. Includes base rent, late fees, pet fees, parking fees, and other recurring charges.
Gross rent:
| $5,800 | $69,600 | |
Vacancy LossExpected loss of rent due to vacancies.
Vacancy loss:
(6%)
| 6% | -$348 | -$4,176 |
Operating IncomeGross rental income minus vacancy loss. Calculation:Gross rent - Vacancy loss
Operating income:
| $5,452 | $65,424 |
Operating Expenses
| % Rent | Monthly | Yearly | |
|---|---|---|---|
Property TaxesAnnual taxes levied by local governments on real estate properties. These taxes fund public services like schools, roads, and emergency services.
We noticed that property taxes are missing—these are standard expenses and should be considered in your estimate. | n/a | n/a | n/a |
InsuranceThe costs for insurance coverage to protect against financial losses due to risks like fire, natural disasters, theft, liability, or tenant-related damages. Calculation:Assumes 7% of gross rental income, unless insurance rates are specified. | 7% | -$406 | -$4,872 |
Property ManagementThe costs associated with hiring a property manager to handle the day-to-day operations of a rental property. Includes management fees, leasing fes, eviction fees, etc. Calculation:Assumes 8% of gross rental income. | 8% | -$464 | -$5,568 |
Repairs & MaintenanceOngoing costs for routine upkeep and minor fixes needed to keep a property in good working condition. Calculation:Assumes 5% of gross rental income. Varies by property age and condition. | 5% | -$290 | -$3,480 |
Capital ExpensesLarge, infrequent costs for major improvements or replacements, like a new roof, HVAC system, or appliances. Calculation:Assumes 5% of gross rental income. Varies by property age. | 5% | -$290 | -$3,480 |
HOA FeesRegular dues paid to a Homeowners Association for community maintenance, amenities, and management. Similar fees include: Condo Association Fees, Co-op Maintenance Fees, etc. | 66% | -$3,799 | -$45,588 |
Operating ExpensesRecurring costs required to maintain and manage a rental property, including property taxes, insurance, maintenance, repairs, utilities (if paid by the owner), property management fees, and other day-to-day expenses. Calculation:Insurance + Property Taxes + Property Management + Repairs & Maintenance + Capital Expenditures + HOA Fees | 91% | -$5,249 | -$62,988 |
Cash Flow
| Monthly | Yearly | |
|---|---|---|
Net Operating Income (NOI)The income generated from a property after deducting all operating expenses but before deducting mortgage payments, taxes, and capital expenditures. Calculation:Gross Operating Income - Operating Expenses
Net operating income:
| $203 | $2,436 |
Mortgage PaymentThe fixed amount a borrower pays each month to repay a loan. It typically includes principal and interest (P&I) and may also cover property taxes, insurance, HOA fees, and PMI if escrowed. | -$7,556 | -$90,672 |
Cash FlowNet Operating Income (NOI) minus mortgage payments. Calculation:NOI - Mortgage Payments | $7,353 | $88,236 |