$1,500,000
Investment Summary
- Monthly Cash Flow
- -$4,758
- Cap Rate
- 2.3%
- Cash-on-Cash Return
- -16.5%
- Debt Coverage Ratio
- 0.38
- Internal Rate of Return (5 years)
- -12.0%
Cash Flow
Net Operating Income (NOI) minus mortgage payments.
Calculation:
NOI - Mortgage Payments
Cap Rate (Market Value)
Capitalization Rate is a rate of return that compares the yearly Net Operating Income (NOI) to the market value.
Calculation:
NOI / Market Value
Cash-on-Cash Return (CoC)
Annual Cash Flow / Cash Invested
Calculation:
Annual cash flow divided by initial cash invested.
Debt Coverage Ratio (DCR)
Net Operating Income (NOI) divided by total debt payments.
Calculation:
NOI / Total Debt Payments
Internal Rate of Return (IRR)
A metric for assessing profitability over time. IRR is the discount rate at which the net present value (NPV) of all future cash flows (positive and negative) from an investment equals zero — including both periodic cash flow (such as rent) and a projected sale at the end of the holding period. It represents the expected annualized return, accounting for income, expenses, and the recovery of capital through a future sale.
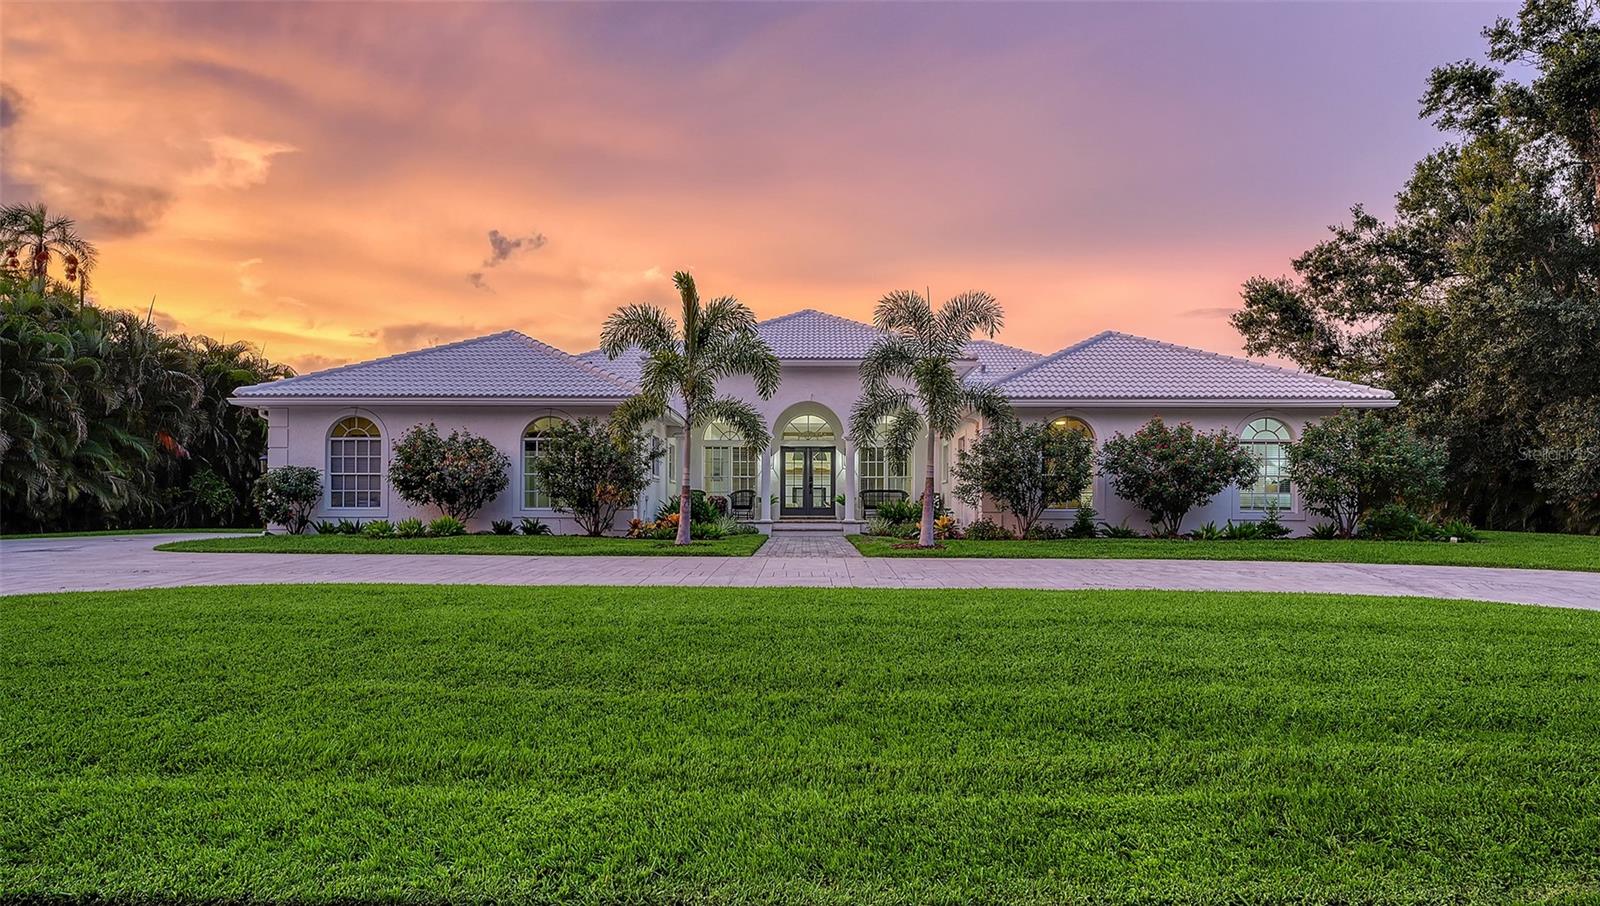
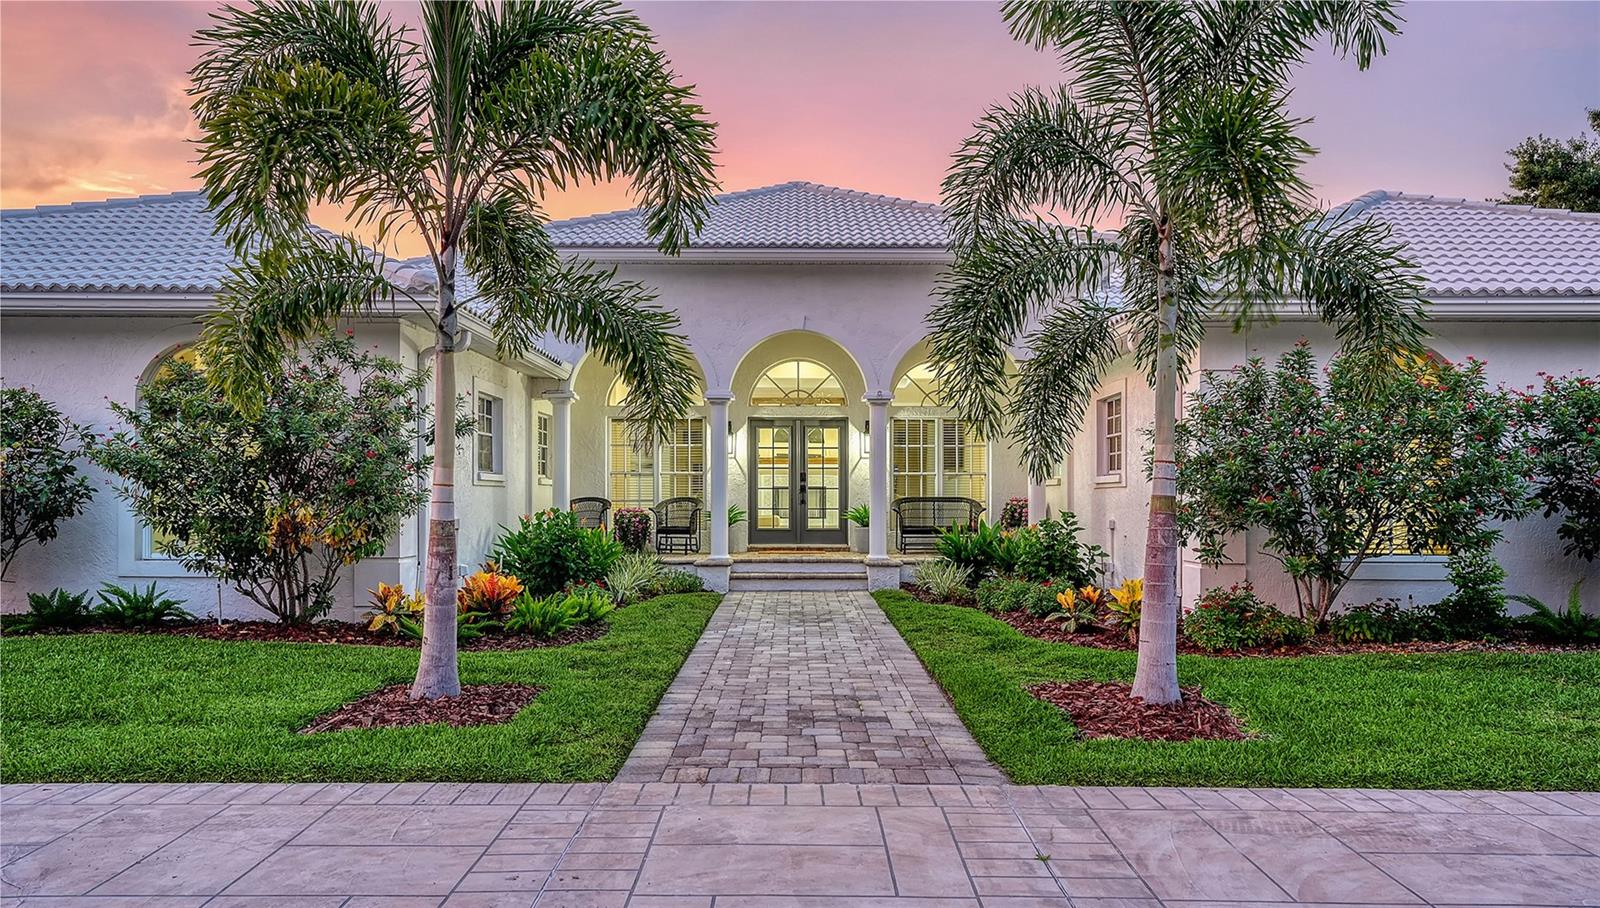
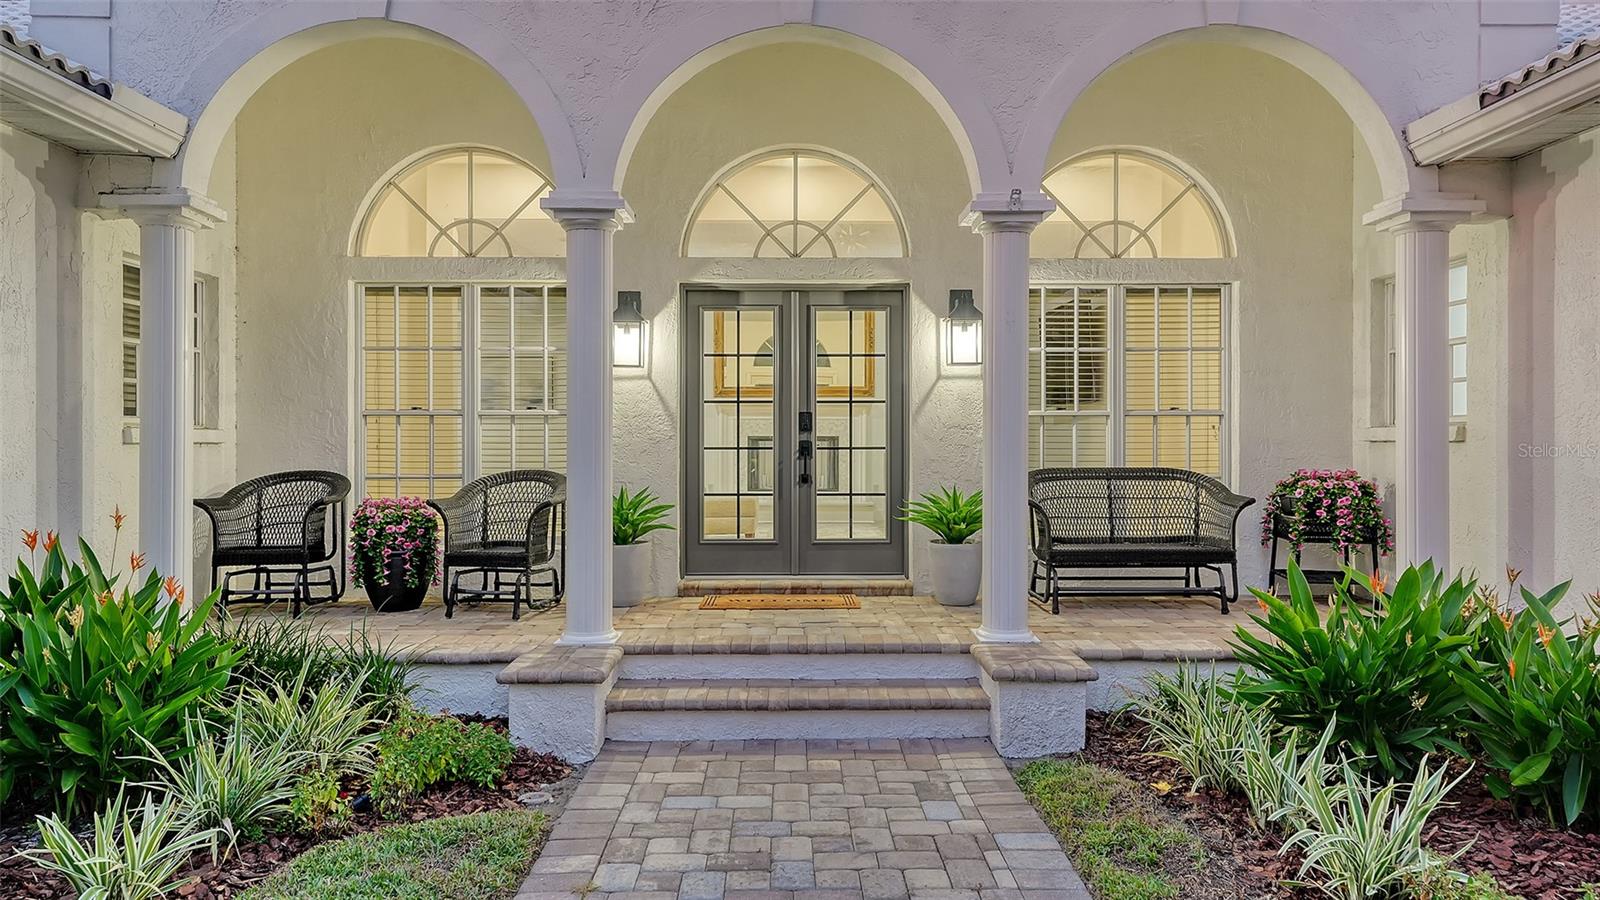
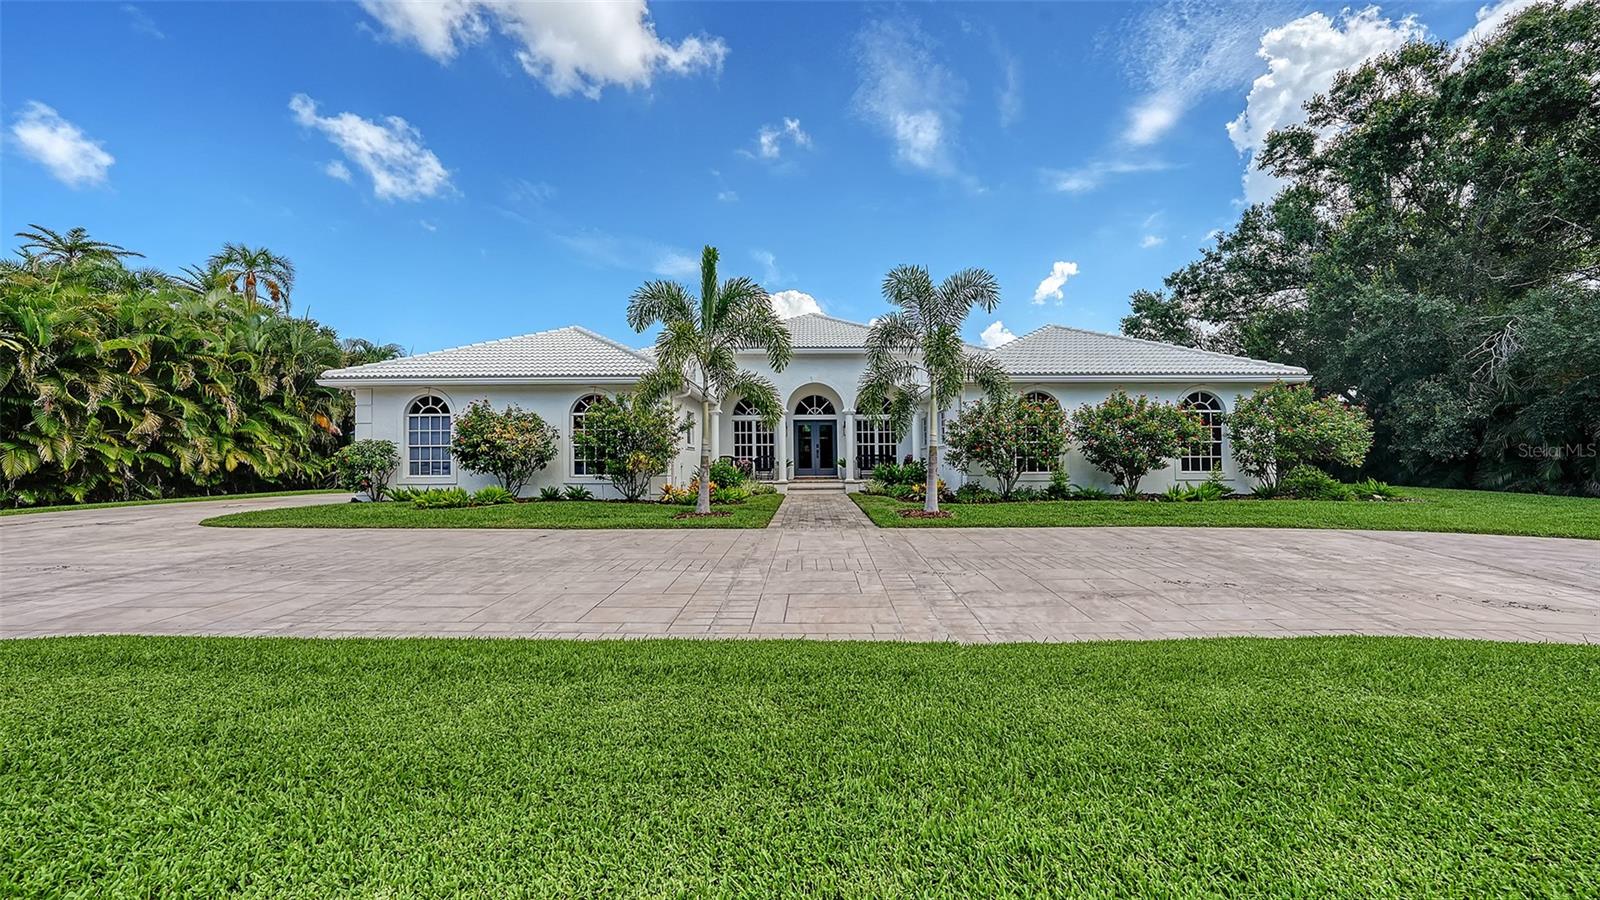
Property Description
Tucked within the prestigious, gated enclave of Beneva Oaks, where centuries-old live oaks line meandering streets, this masterfully renovated home on a ½ acre lot offers incredible 2025 updates and a wonderful 4-bedroom, 3.5-bath, 1-story floor plan providing both grandeur and comfort across the expansive space. A circular drive framed by lush landscaping leads to the elegant entry of this modern residence, where refined upgrades blend seamlessly with timeless architectural features. Inside, travertine floors flow through the main living areas, while new designer carpet enhances the comfort of the bedrooms. The heart of the home is the extraordinary new eat-in kitchen featuring gleaming quartz countertops, crisp white wood cabinetry, stainless appliances including an induction cooktop, wide plank porcelain tile floor, and a custom tile backsplash. Accents like gold hardware, designer lighting, crown molding, and wide baseboards add the feel of luxury, while four sets of French doors connect the interior seamlessly with the lush exterior surroundings. An elegant dual-sided wood-burning fireplace with brick and tile surround and quartz and travertine hearths anchors the living and sitting areas, creating inviting spaces for conversation or quiet moments. With multiple entertaining areas designed for both intimate gatherings, grand-scale events or even a game of pool, the home's layout flows effortlessly from indoors to the screened lanai with paver deck, where a heated pool enhanced by Iconic Pools with sparkling new glass tile surface invites year-round enjoyment. The spacious primary suite, is a sanctuary unto itself, offering three walk-in closets with custom closet systems, and an extraordinary spa-inspired bath with bespoke tile work, frameless glass shower, gold fixtures, and a quartz-topped dual-sink vanity that exudes luxury. Two additional guest bedrooms enjoy new carpet, large closets, and generous natural light, while the newly redesigned guest bath impresses with design-forward flooring, quartz dual-sink vanity, and clean, modern finishes. The 4th bedroom can also be used as in-law suite, enjoying its own private French door entry and full bath with walk-in shower. The office with a custom built-in loft, closet, and a front facing window is ideal as a workspace, study, play, or creative escape. A chic updated powder bath adds further convenience. The thoughtfully designed laundry room features quartz countertops, utility sink, abundant cabinetry, and front-load GE Whirlpool washer/dryer. The oversized 2-car garage and beautifully landscaped grounds complete this exceptional property in one of Sarasota’s most serene and sought-after neighborhoods. Located in a top rated school district, X flood zone and within close proximity to Sarasota's dining, shopping, culture, and the pristine Gulf of Mexico beaches, this exceptional property offers an unparalleled combination of design and craftsmanship in one of Sarasota’s best-kept secret neighborhoods, presenting a rare opportunity to experience refined Florida living at its finest!
Build Your Team
Quickly find investor-friendly professionals who can help you succeed in real estate investing at any stage of the investing journey.


Agents
Match with investor-friendly agents who can help you find, analyze, and close your next deal


Lenders
Get the best funding…find investor-friendly lenders who specialize in your deal strategy


Property Managers
Transition to passive investing. Find a trusted property management partnership that lasts.


Tax Pros & Accountants
Taxes and financial reporting made easy—find experts to create tax savings strategies, file taxes, and more
Location
Property Details
Parking
- Description: Garage
- Details: Circular Driveway, Garage Door Opener, Guest, Attached
- Garage Spaces: 2
- Spaces Total: 0
Bedroom Information
- # of Bedrooms: 4
Bathroom Information
- # of Baths (Full): 3
- # of Baths (Total): 4.0
Interior Features
- # of Rooms: 12
- # of Stories: 1
- Fireplace: Yes
Exterior Features
- Exterior Walls Materials: Stucco
- Foundation: Slab
- Roof Type: Hip
- Roof Material: Tile
- Pool: Yes
HOA
- Has HOA: Yes
- Association: Vince Pflug
- HOA Fee: $1,150/annually
Land Information
- Land Use: Residential
- Land Use Subtype: Single Family Residential
Lot Information
- Parcel ID: 0100040004
- Lot Size: 22868 sqft
Property Information
- Property Type: Single Family Residence
- Style: Coastal
- Year Built: 1988
Tax Information
- Annual Tax: $10,101
Utilities
- Water & Sewer: Public
- Heating: Electric, Zoned
- Cooling: Central Air, Zoned
Location
- County: Sarasota
Listing Details
Investment Summary
- Monthly Cash Flow
- -$4,758
- Cap Rate
- 2.3%
- Cash-on-Cash Return
- -16.5%
- Debt Coverage Ratio
- 0.38
- Internal Rate of Return (5 years)
- -12.0%
Cash Flow
Net Operating Income (NOI) minus mortgage payments.
Calculation:
NOI - Mortgage Payments
Cap Rate (Market Value)
Capitalization Rate is a rate of return that compares the yearly Net Operating Income (NOI) to the market value.
Calculation:
NOI / Market Value
Cash-on-Cash Return (CoC)
Annual Cash Flow / Cash Invested
Calculation:
Annual cash flow divided by initial cash invested.
Debt Coverage Ratio (DCR)
Net Operating Income (NOI) divided by total debt payments.
Calculation:
NOI / Total Debt Payments
Internal Rate of Return (IRR)
A metric for assessing profitability over time. IRR is the discount rate at which the net present value (NPV) of all future cash flows (positive and negative) from an investment equals zero — including both periodic cash flow (such as rent) and a projected sale at the end of the holding period. It represents the expected annualized return, accounting for income, expenses, and the recovery of capital through a future sale.
Purchase Details
Purchase PriceThe price paid for the property. Purchase price:
| $1,500,000 |
|---|---|
Amount FinancedThe amount of the purchase financed through a loan. Amount financed:
| -$1,200,000 |
Down paymentThe initial payment made towards the purchase. Down payment:
| $300,000 |
Closing CostsFees and expenses associated with purchasing a property, typically ranging from 2% to 5% of the home’s purchase price, paid at the end of a home purchase to cover services like lending, title transfer, and taxes. Closing costs:
| $45,000 |
Rehab CostsCosts incurred to repair or improve the property, including: roof, flooring, exterior siding, kitchen, exterior paint, bathrooms, etc. Rehab costs:
| $0 |
Initial Cash InvestedThe total initial cash invested in the property. Calculation:Down payment + Buying costs + Rehab costs Initial cash invested:
| $345,000 |
Square Feet (SQFT)The total square footage of the property. Square feet:
| 3,302 |
Cost Per Square FootCost per square foot of the property. Calculation:Purchase Price / Square Feet Cost per square foot:
| $454 |
Monthly Rent Per Square FootMonthly rent divided by the number of square feet. This ratio helps investors compare rental income efficiency across properties, markets, and unit sizes Calculation:Monthly Rent / Square Feet Monthly rent per square foot:
| $1.70 |
Financing Details
Loan AmountThe total sum of money borrowed from a lender to finance a property purchase. Calculation:Purchase Price - Down Payment
Loan amount:
| $1,200,000 |
|---|---|
Loan to Value Ratio (LTV)Loan amount divided by the market value of the property. Calculation:Loan Amount / Market Value
Loan to value ratio:
| 80.0% |
Loan TypeThe type of loan (e.g., fixed, adjustable).
Loan type:
| Amortizing |
TermThe loan repayment period in years.
Term:
| 30 years |
Interest RateThe percentage a lender charges on the borrowed amount of a loan, determining the cost of borrowing money.
Interest rate:
| 6.625% |
Principal & Interest (PI)The principal is the portion of the loan payment that reduces the loan balance. The interest is the lender's charge for borrowing money. Calculation:(P * r * (1 + r) ** n) / ((1 + r) ** n - 1) Where:
P = Loan amount (principal)
Principal & interest:
| $7,684 |
Property TaxesAnnual taxes levied by local governments on real estate properties. These taxes fund public services like schools, roads, and emergency services.
Property tax:
| $842 |
InsuranceThe costs for insurance coverage to protect against financial losses due to risks like fire, natural disasters, theft, liability, or tenant-related damages. Calculation:Assumes 7% of gross rental income, unless insurance rates are specified.
Insurance:
| $392 |
Private Mortgage Insurance (PMI)A fee that borrowers pay when they take out a conventional loan with a loan-to-value (LTV) ratio above 80%.
Private mortgage insurance (PMI):
| $0 |
Monthly PaymentThe fixed amount a borrower pays each month to repay a loan. It typically includes principal and interest (P&I) and may also cover property taxes, insurance, HOA fees, and PMI if escrowed. Monthly payment:
| $8,918 |
Operating Income
| % Rent | Monthly | Yearly | |
|---|---|---|---|
Gross RentThe total rental income received from tenants before deducting any expenses. Includes base rent, late fees, pet fees, parking fees, and other recurring charges.
Gross rent:
| $5,600 | $67,200 | |
Vacancy LossExpected loss of rent due to vacancies.
Vacancy loss:
(6%)
| 6% | -$336 | -$4,032 |
Operating IncomeGross rental income minus vacancy loss. Calculation:Gross rent - Vacancy loss
Operating income:
| $5,264 | $63,168 |
Operating Expenses
| % Rent | Monthly | Yearly | |
|---|---|---|---|
Property TaxesAnnual taxes levied by local governments on real estate properties. These taxes fund public services like schools, roads, and emergency services. | 15% | -$842 | -$10,101 |
InsuranceThe costs for insurance coverage to protect against financial losses due to risks like fire, natural disasters, theft, liability, or tenant-related damages. Calculation:Assumes 7% of gross rental income, unless insurance rates are specified. | 7% | -$392 | -$4,704 |
Property ManagementThe costs associated with hiring a property manager to handle the day-to-day operations of a rental property. Includes management fees, leasing fes, eviction fees, etc. Calculation:Assumes 8% of gross rental income. | 8% | -$448 | -$5,376 |
Repairs & MaintenanceOngoing costs for routine upkeep and minor fixes needed to keep a property in good working condition. Calculation:Assumes 5% of gross rental income. Varies by property age and condition. | 5% | -$280 | -$3,360 |
Capital ExpensesLarge, infrequent costs for major improvements or replacements, like a new roof, HVAC system, or appliances. Calculation:Assumes 5% of gross rental income. Varies by property age. | 5% | -$280 | -$3,360 |
HOA FeesRegular dues paid to a Homeowners Association for community maintenance, amenities, and management. Similar fees include: Condo Association Fees, Co-op Maintenance Fees, etc. | 2% | -$96 | -$1,152 |
Operating ExpensesRecurring costs required to maintain and manage a rental property, including property taxes, insurance, maintenance, repairs, utilities (if paid by the owner), property management fees, and other day-to-day expenses. Calculation:Insurance + Property Taxes + Property Management + Repairs & Maintenance + Capital Expenditures + HOA Fees | 42% | -$2,338 | -$28,053 |
Cash Flow
| Monthly | Yearly | |
|---|---|---|
Net Operating Income (NOI)The income generated from a property after deducting all operating expenses but before deducting mortgage payments, taxes, and capital expenditures. Calculation:Gross Operating Income - Operating Expenses
Net operating income:
| $2,926 | $35,112 |
Mortgage PaymentThe fixed amount a borrower pays each month to repay a loan. It typically includes principal and interest (P&I) and may also cover property taxes, insurance, HOA fees, and PMI if escrowed. | -$7,684 | -$92,208 |
Cash FlowNet Operating Income (NOI) minus mortgage payments. Calculation:NOI - Mortgage Payments | $4,758 | $57,096 |