$1,795,000
Investment Summary
We noticed that HOA fees are missing—this is a standard expense and should be considered in your estimate.
- Monthly Cash Flow
- -$6,383
- Cap Rate
- 1.9%
- Cash-on-Cash Return
- -18.6%
- Debt Coverage Ratio
- 0.31
- Internal Rate of Return (5 years)
- -13.9%
Cash Flow
Net Operating Income (NOI) minus mortgage payments.
Calculation:
NOI - Mortgage Payments
Cap Rate (Market Value)
Capitalization Rate is a rate of return that compares the yearly Net Operating Income (NOI) to the market value.
Calculation:
NOI / Market Value
Cash-on-Cash Return (CoC)
Annual Cash Flow / Cash Invested
Calculation:
Annual cash flow divided by initial cash invested.
Debt Coverage Ratio (DCR)
Net Operating Income (NOI) divided by total debt payments.
Calculation:
NOI / Total Debt Payments
Internal Rate of Return (IRR)
A metric for assessing profitability over time. IRR is the discount rate at which the net present value (NPV) of all future cash flows (positive and negative) from an investment equals zero — including both periodic cash flow (such as rent) and a projected sale at the end of the holding period. It represents the expected annualized return, accounting for income, expenses, and the recovery of capital through a future sale.
Property Description
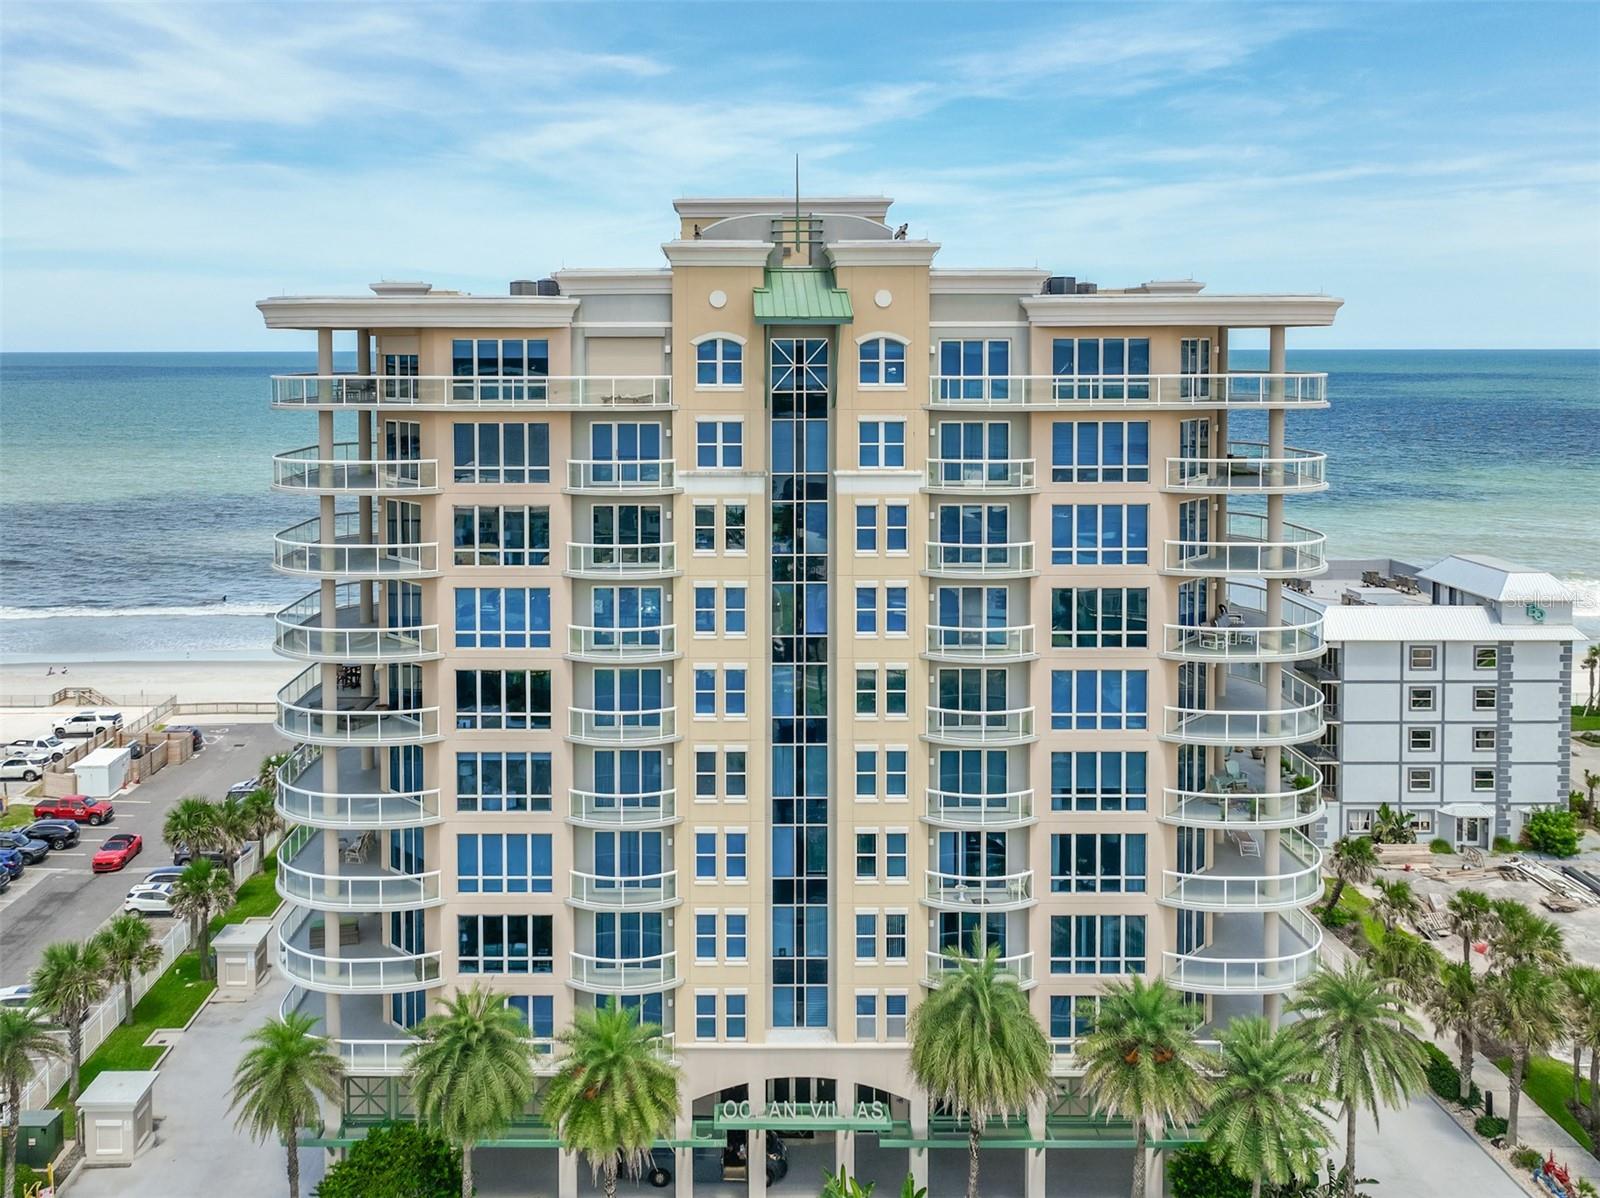
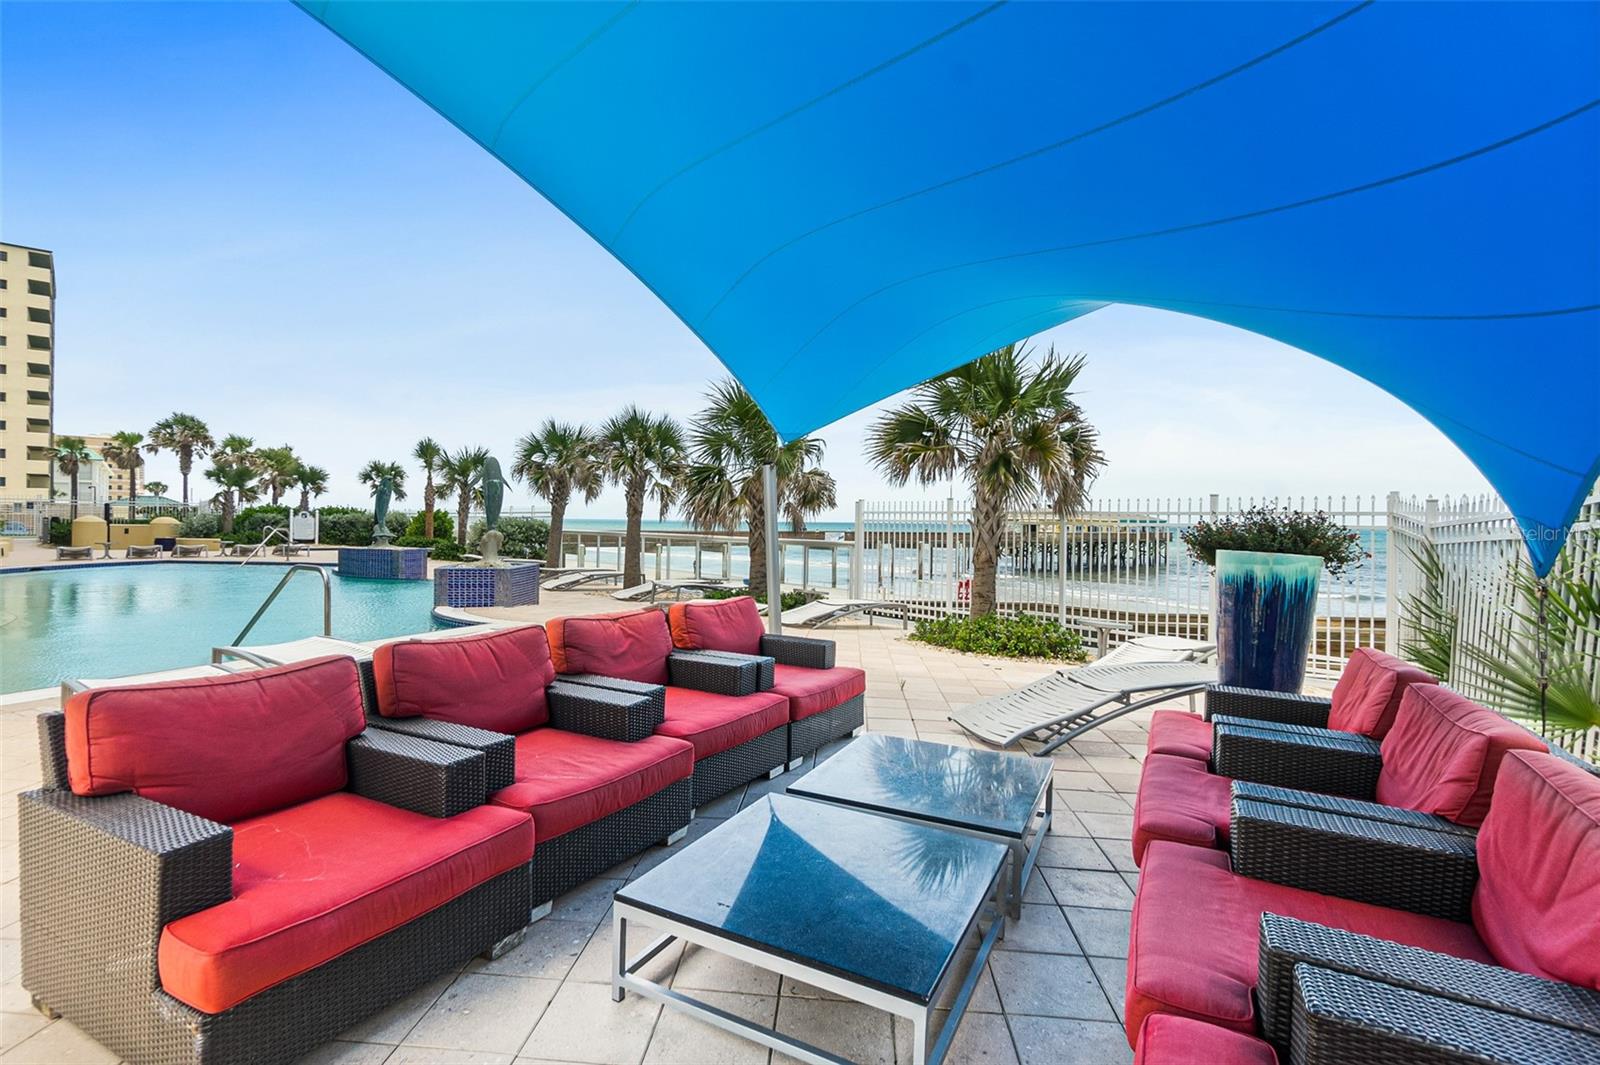
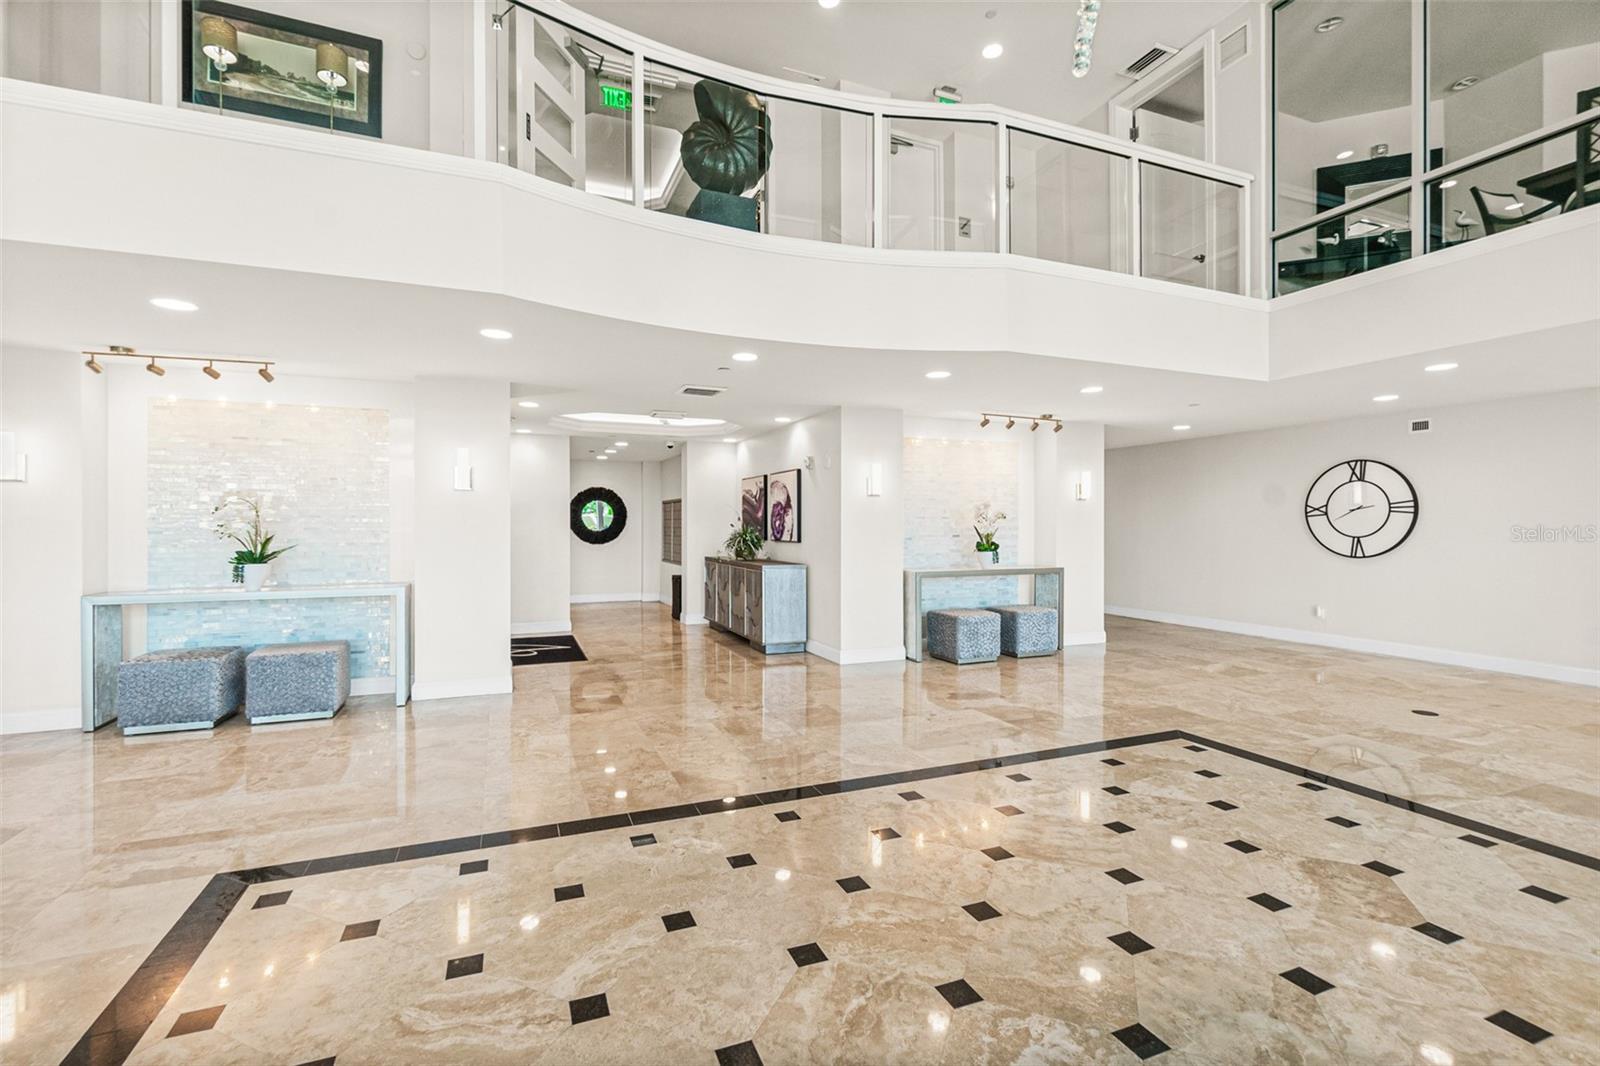
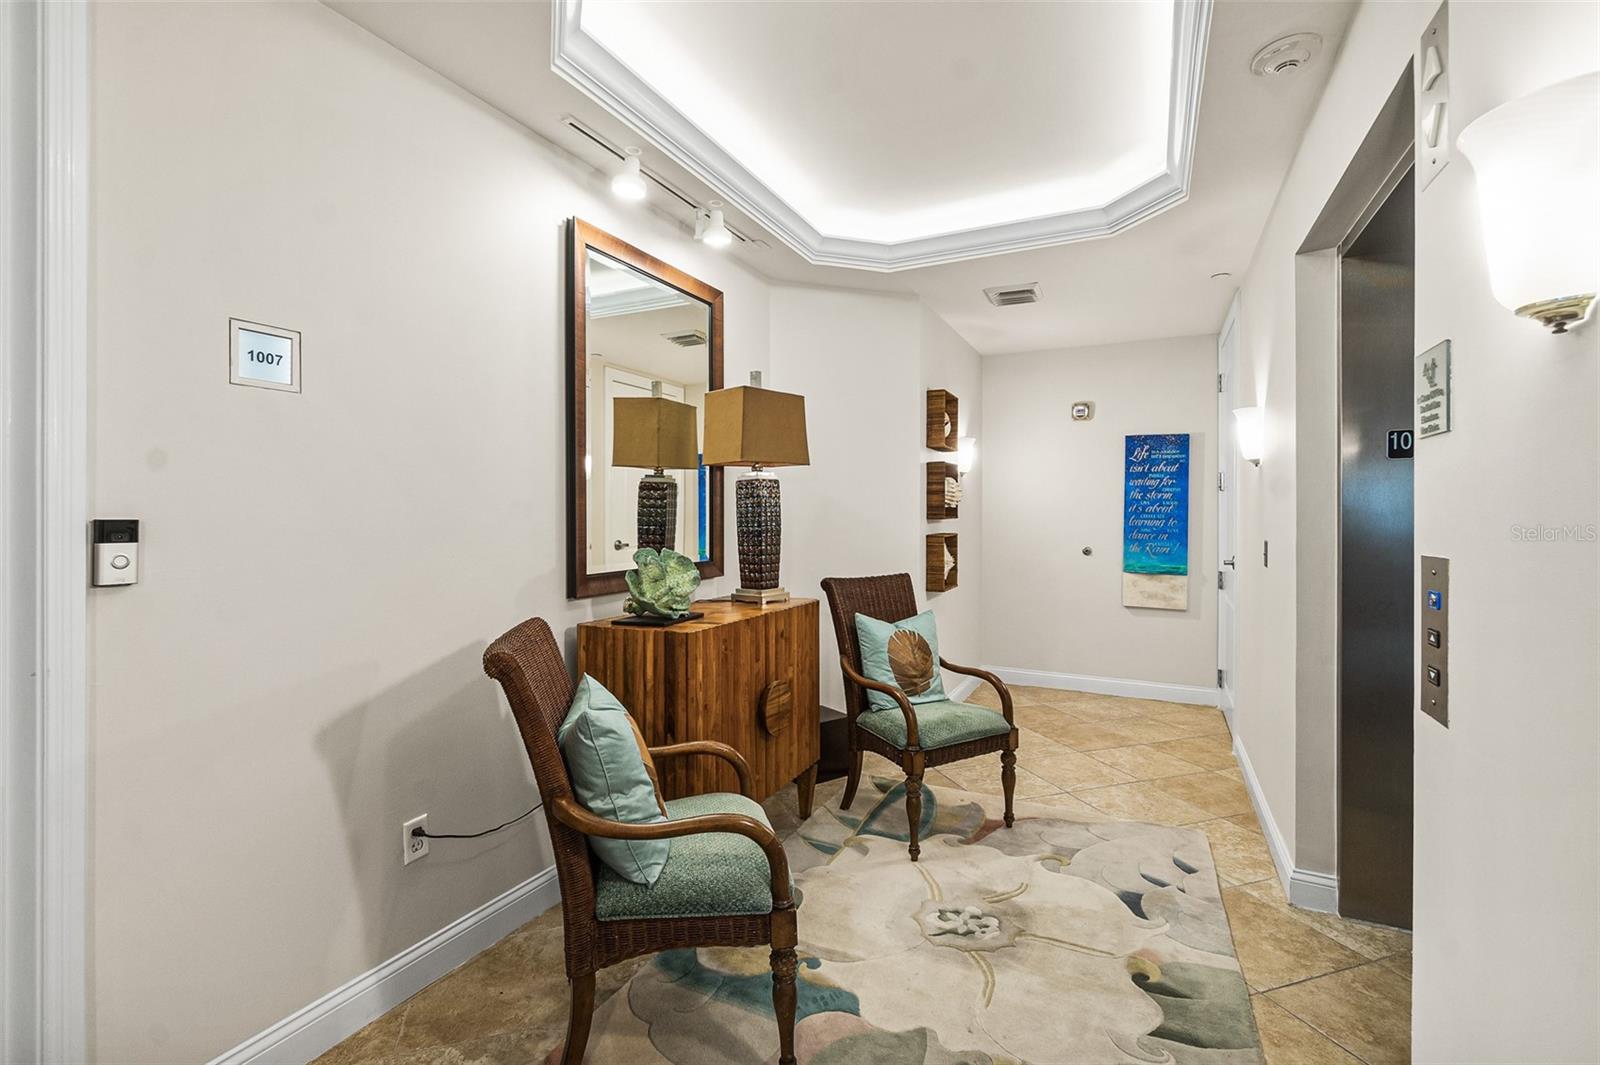
SOUTH-SIDE DIRECT OCEANFRONT IN OCEAN VILLAS. 10TH FLOOR. HASN'T BEEN OFFERED IN ALMOST A DECADE. THIS IS A RARE OPPORTUNITY IN ONE OF THE MOST ICONIC BUILDINGS IN DAYTONA BEACH SHORES. ENTER YOUR PRIVATE SANCTUARY. A SEMI-PRIVATE ELEVATOR OPENS TO YOUR EXCLUSIVE VESTIBULE, WHERE TRANQUILITY TAKES CENTER STAGE. THE MOMENT THE PRESIDENTIAL DOUBLE DOORS SWING OPEN, YOU ARE MET WITH A BREATHTAKING, DIRECT OCEAN VIEW. FROM THIS 10TH-FLOOR VANTAGE POINT, THE VISTAS ARE NOTHING SHORT OF STUNNING. A STATELY ROTUNDA ENTRY, ADORNED WITH ELEGANT MOULDING AND ILLUMINATED BY CHANDELIERS, SETS THE TONE FOR THIS COASTAL CHARMER. SPANNING 2,474 SQUARE FEET, THIS RESIDENCE INCLUDES THREE BEDROOMS, THREE BATHROOMS, OCEAN VIEWS FROM EVERY ROOM! ALSO OFFERING THE MOST SPACIOUS BALCONIES. (2 underground parking spaces). THE EXPANSIVE WALL-OF-GLASS IN THE LIVING ROOM SEAMLESSLY SPANS THE ENTIRE SPACE OFFERING UNFORGETTABLE VIEWS FROM EVERY CORNER. WHILE THE SOOTHING AQUA-COLORED WALLS BRINGS THE ENERGY OF BEACHFRONT LIVING INSIDE. EQUALLY ENTHRALLING IS THE WHIMSICAL CUSTOM-PAINTED PILLAR WITH MERMAID AND UNDERWATER TAPESTRY. THE COZY GAS FIREPLACE ADD’S A BEAUTIFUL ELEMENT. OVERALL, THIS IS MORE THAN A HOME; IT'S AN EXPERIENCE. THE OVERSIZED KITCHEN IS A CULINARY MASTERPIECE, FEATURING IMPORTED ITALIAN CABINETRY IN A DARK HUE. IT'S EQUIPPED WITH A LARGE ISLAND WITH A DOUBLE-TIERED BREAKFAST BAR, AN OVERSIZED CUSTOM PANTRY WITH DRAWERS AND SHELVES AND GLASS-FRONT CABINETS. ENJOY THE CONVENIENCE OF ROLL-OUT SHELVES IN THE LOWER CABINETS, A STAINLESS DESIGNER VENT HOOD, VEGETABLE SINK, A REFRIGERATED WINE COOLER, AND HIGH-END STAINLESS-STEEL APPLIANCES. THE PRIMARY SUITE IS A PRIVATE RETREAT, COMPLETE WITH BALCONY ACCESS AND OCEAN VIEWS. TWO CLOSETS WITH FURNITURE GRADE CUSTOM ORGANIZERS. THE SPA-INSPIRED BATHROOM OFFERS A JETTED TUB, A SEPARATE DUAL-HEAD SHOWER, DOUBLE-SINK VANITY, AND HIGH-END FINISHES. THE EXPANSIVE 436-SQUARE-FOOT VERANDA IS DESIGNED FOR EFFORTLESS OCEAN VIEWING. IT FEATURES TRANSLUCENT, CURVED GLASS RAILINGS THAT CAPTURE PANORAMIC VISTAS UNLIKE ANY OTHER BUILDING IN THE SHORES. THE VERANDA IS COMPLETE WITH A SUMMER KITCHEN. PERFECT FOR SAVORING BEACHFRONT LIVING. OCEAN VILLAS PROVIDES EXCEPTIONAL AMENITIES DESIGNED FOR YOUR COMFORT AND ENJOYMENT. BASK IN THE SUN ON THE DECK OF OUR GAS-HEATED, OCEANFRONT POOL, SET AMIDST BEAUTIFUL, LUSH LANDSCAPING. FOR A QUIETER MOMENT, FIND A PEACEFUL, SHADED AREA THAT OFFERS A TRUE RESORT-STYLE ESCAPE. INSIDE, A BEAUTIFULLY APPOINTED CLUBROOM, FEATURING A KITCHEN AND BUTLER'S PANTRY, PROVIDES A PERFECT SPACE TO ENTERTAIN. YOU CAN ALSO STAY ACTIVE IN THE STATE-OF-THE-ART FITNESS CENTER, AND BUSINESS CENTER. All information intended to be accurate but should be independently verified.
Build Your Team
Quickly find investor-friendly professionals who can help you succeed in real estate investing at any stage of the investing journey.


Agents
Match with investor-friendly agents who can help you find, analyze, and close your next deal


Lenders
Get the best funding…find investor-friendly lenders who specialize in your deal strategy


Property Managers
Transition to passive investing. Find a trusted property management partnership that lasts.


Tax Pros & Accountants
Taxes and financial reporting made easy—find experts to create tax savings strategies, file taxes, and more
Location
Property Details
Parking
- Description: Assigned, Secured, Underground
- Details: Assigned, Garage Door Opener, Basement, Attached
- Garage Spaces: 2
- Spaces Total: 0
Bedroom Information
- # of Bedrooms: 3
Bathroom Information
- # of Baths (Full): 3
- # of Baths (Total): 3.0
Interior Features
- # of Rooms: 6
- # of Stories: 11
- Fireplace: Yes
Exterior Features
- Foundation: Block, Pillar/Post/Pier
- Roof Material: Built-Up
- Pool: Yes
HOA
- Association: Jeff Edwards
Land Information
- Land Use: Residential
- Land Use Subtype: Condominium Unit
Lot Information
- Parcel ID: 630242001007
- Lot Size: 56223 sqft
Property Information
- Property Type: Condominium
- Style: Contemporary
- Year Built: 2006
Tax Information
- Annual Tax: $11,793
Utilities
- Water & Sewer: Public
- Heating: Central, Electric
- Cooling: Central Air
Location
- County: Volusia
Listing Details
Investment Summary
We noticed that HOA fees are missing—this is a standard expense and should be considered in your estimate.
- Monthly Cash Flow
- -$6,383
- Cap Rate
- 1.9%
- Cash-on-Cash Return
- -18.6%
- Debt Coverage Ratio
- 0.31
- Internal Rate of Return (5 years)
- -13.9%
Cash Flow
Net Operating Income (NOI) minus mortgage payments.
Calculation:
NOI - Mortgage Payments
Cap Rate (Market Value)
Capitalization Rate is a rate of return that compares the yearly Net Operating Income (NOI) to the market value.
Calculation:
NOI / Market Value
Cash-on-Cash Return (CoC)
Annual Cash Flow / Cash Invested
Calculation:
Annual cash flow divided by initial cash invested.
Debt Coverage Ratio (DCR)
Net Operating Income (NOI) divided by total debt payments.
Calculation:
NOI / Total Debt Payments
Internal Rate of Return (IRR)
A metric for assessing profitability over time. IRR is the discount rate at which the net present value (NPV) of all future cash flows (positive and negative) from an investment equals zero — including both periodic cash flow (such as rent) and a projected sale at the end of the holding period. It represents the expected annualized return, accounting for income, expenses, and the recovery of capital through a future sale.
Purchase Details
Purchase PriceThe price paid for the property. Purchase price:
| $1,795,000 |
|---|---|
Amount FinancedThe amount of the purchase financed through a loan. Amount financed:
| -$1,436,000 |
Down paymentThe initial payment made towards the purchase. Down payment:
| $359,000 |
Closing CostsFees and expenses associated with purchasing a property, typically ranging from 2% to 5% of the home’s purchase price, paid at the end of a home purchase to cover services like lending, title transfer, and taxes. Closing costs:
| $53,850 |
Rehab CostsCosts incurred to repair or improve the property, including: roof, flooring, exterior siding, kitchen, exterior paint, bathrooms, etc. Rehab costs:
| $0 |
Initial Cash InvestedThe total initial cash invested in the property. Calculation:Down payment + Buying costs + Rehab costs Initial cash invested:
| $412,850 |
Square Feet (SQFT)The total square footage of the property. Square feet:
| 2,471 |
Cost Per Square FootCost per square foot of the property. Calculation:Purchase Price / Square Feet Cost per square foot:
| $726 |
Monthly Rent Per Square FootMonthly rent divided by the number of square feet. This ratio helps investors compare rental income efficiency across properties, markets, and unit sizes Calculation:Monthly Rent / Square Feet Monthly rent per square foot:
| $2.23 |
Financing Details
Loan AmountThe total sum of money borrowed from a lender to finance a property purchase. Calculation:Purchase Price - Down Payment
Loan amount:
| $1,436,000 |
|---|---|
Loan to Value Ratio (LTV)Loan amount divided by the market value of the property. Calculation:Loan Amount / Market Value
Loan to value ratio:
| 80.0% |
Loan TypeThe type of loan (e.g., fixed, adjustable).
Loan type:
| Amortizing |
TermThe loan repayment period in years.
Term:
| 30 years |
Interest RateThe percentage a lender charges on the borrowed amount of a loan, determining the cost of borrowing money.
Interest rate:
| 6.625% |
Principal & Interest (PI)The principal is the portion of the loan payment that reduces the loan balance. The interest is the lender's charge for borrowing money. Calculation:(P * r * (1 + r) ** n) / ((1 + r) ** n - 1) Where:
P = Loan amount (principal)
Principal & interest:
| $9,195 |
Property TaxesAnnual taxes levied by local governments on real estate properties. These taxes fund public services like schools, roads, and emergency services.
Property tax:
| $983 |
InsuranceThe costs for insurance coverage to protect against financial losses due to risks like fire, natural disasters, theft, liability, or tenant-related damages. Calculation:Assumes 7% of gross rental income, unless insurance rates are specified.
Insurance:
| $385 |
Private Mortgage Insurance (PMI)A fee that borrowers pay when they take out a conventional loan with a loan-to-value (LTV) ratio above 80%.
Private mortgage insurance (PMI):
| $0 |
Monthly PaymentThe fixed amount a borrower pays each month to repay a loan. It typically includes principal and interest (P&I) and may also cover property taxes, insurance, HOA fees, and PMI if escrowed. Monthly payment:
| $10,563 |
Operating Income
| % Rent | Monthly | Yearly | |
|---|---|---|---|
Gross RentThe total rental income received from tenants before deducting any expenses. Includes base rent, late fees, pet fees, parking fees, and other recurring charges.
Gross rent:
| $5,500 | $66,000 | |
Vacancy LossExpected loss of rent due to vacancies.
Vacancy loss:
(6%)
| 6% | -$330 | -$3,960 |
Operating IncomeGross rental income minus vacancy loss. Calculation:Gross rent - Vacancy loss
Operating income:
| $5,170 | $62,040 |
Operating Expenses
| % Rent | Monthly | Yearly | |
|---|---|---|---|
Property TaxesAnnual taxes levied by local governments on real estate properties. These taxes fund public services like schools, roads, and emergency services. | 18% | -$983 | -$11,793 |
InsuranceThe costs for insurance coverage to protect against financial losses due to risks like fire, natural disasters, theft, liability, or tenant-related damages. Calculation:Assumes 7% of gross rental income, unless insurance rates are specified. | 7% | -$385 | -$4,620 |
Property ManagementThe costs associated with hiring a property manager to handle the day-to-day operations of a rental property. Includes management fees, leasing fes, eviction fees, etc. Calculation:Assumes 8% of gross rental income. | 8% | -$440 | -$5,280 |
Repairs & MaintenanceOngoing costs for routine upkeep and minor fixes needed to keep a property in good working condition. Calculation:Assumes 5% of gross rental income. Varies by property age and condition. | 5% | -$275 | -$3,300 |
Capital ExpensesLarge, infrequent costs for major improvements or replacements, like a new roof, HVAC system, or appliances. Calculation:Assumes 5% of gross rental income. Varies by property age. | 5% | -$275 | -$3,300 |
HOA FeesRegular dues paid to a Homeowners Association for community maintenance, amenities, and management. Similar fees include: Condo Association Fees, Co-op Maintenance Fees, etc. | n/a | n/a | n/a |
Operating ExpensesRecurring costs required to maintain and manage a rental property, including property taxes, insurance, maintenance, repairs, utilities (if paid by the owner), property management fees, and other day-to-day expenses. Calculation:Insurance + Property Taxes + Property Management + Repairs & Maintenance + Capital Expenditures + HOA Fees | 43% | -$2,358 | -$28,293 |
Cash Flow
| Monthly | Yearly | |
|---|---|---|
Net Operating Income (NOI)The income generated from a property after deducting all operating expenses but before deducting mortgage payments, taxes, and capital expenditures. Calculation:Gross Operating Income - Operating Expenses
Net operating income:
| $2,812 | $33,744 |
Mortgage PaymentThe fixed amount a borrower pays each month to repay a loan. It typically includes principal and interest (P&I) and may also cover property taxes, insurance, HOA fees, and PMI if escrowed. | -$9,195 | -$110,340 |
Cash FlowNet Operating Income (NOI) minus mortgage payments. Calculation:NOI - Mortgage Payments | $6,383 | $76,596 |