$439,000
Investment Summary
- Monthly Cash Flow
- -$1,056
- Cap Rate
- 3.3%
- Cash-on-Cash Return
- -12.6%
- Debt Coverage Ratio
- 0.53
- Internal Rate of Return (5 years)
- -8.1%
Cash Flow
Net Operating Income (NOI) minus mortgage payments.
Calculation:
NOI - Mortgage Payments
Cap Rate (Market Value)
Capitalization Rate is a rate of return that compares the yearly Net Operating Income (NOI) to the market value.
Calculation:
NOI / Market Value
Cash-on-Cash Return (CoC)
Annual Cash Flow / Cash Invested
Calculation:
Annual cash flow divided by initial cash invested.
Debt Coverage Ratio (DCR)
Net Operating Income (NOI) divided by total debt payments.
Calculation:
NOI / Total Debt Payments
Internal Rate of Return (IRR)
A metric for assessing profitability over time. IRR is the discount rate at which the net present value (NPV) of all future cash flows (positive and negative) from an investment equals zero — including both periodic cash flow (such as rent) and a projected sale at the end of the holding period. It represents the expected annualized return, accounting for income, expenses, and the recovery of capital through a future sale.
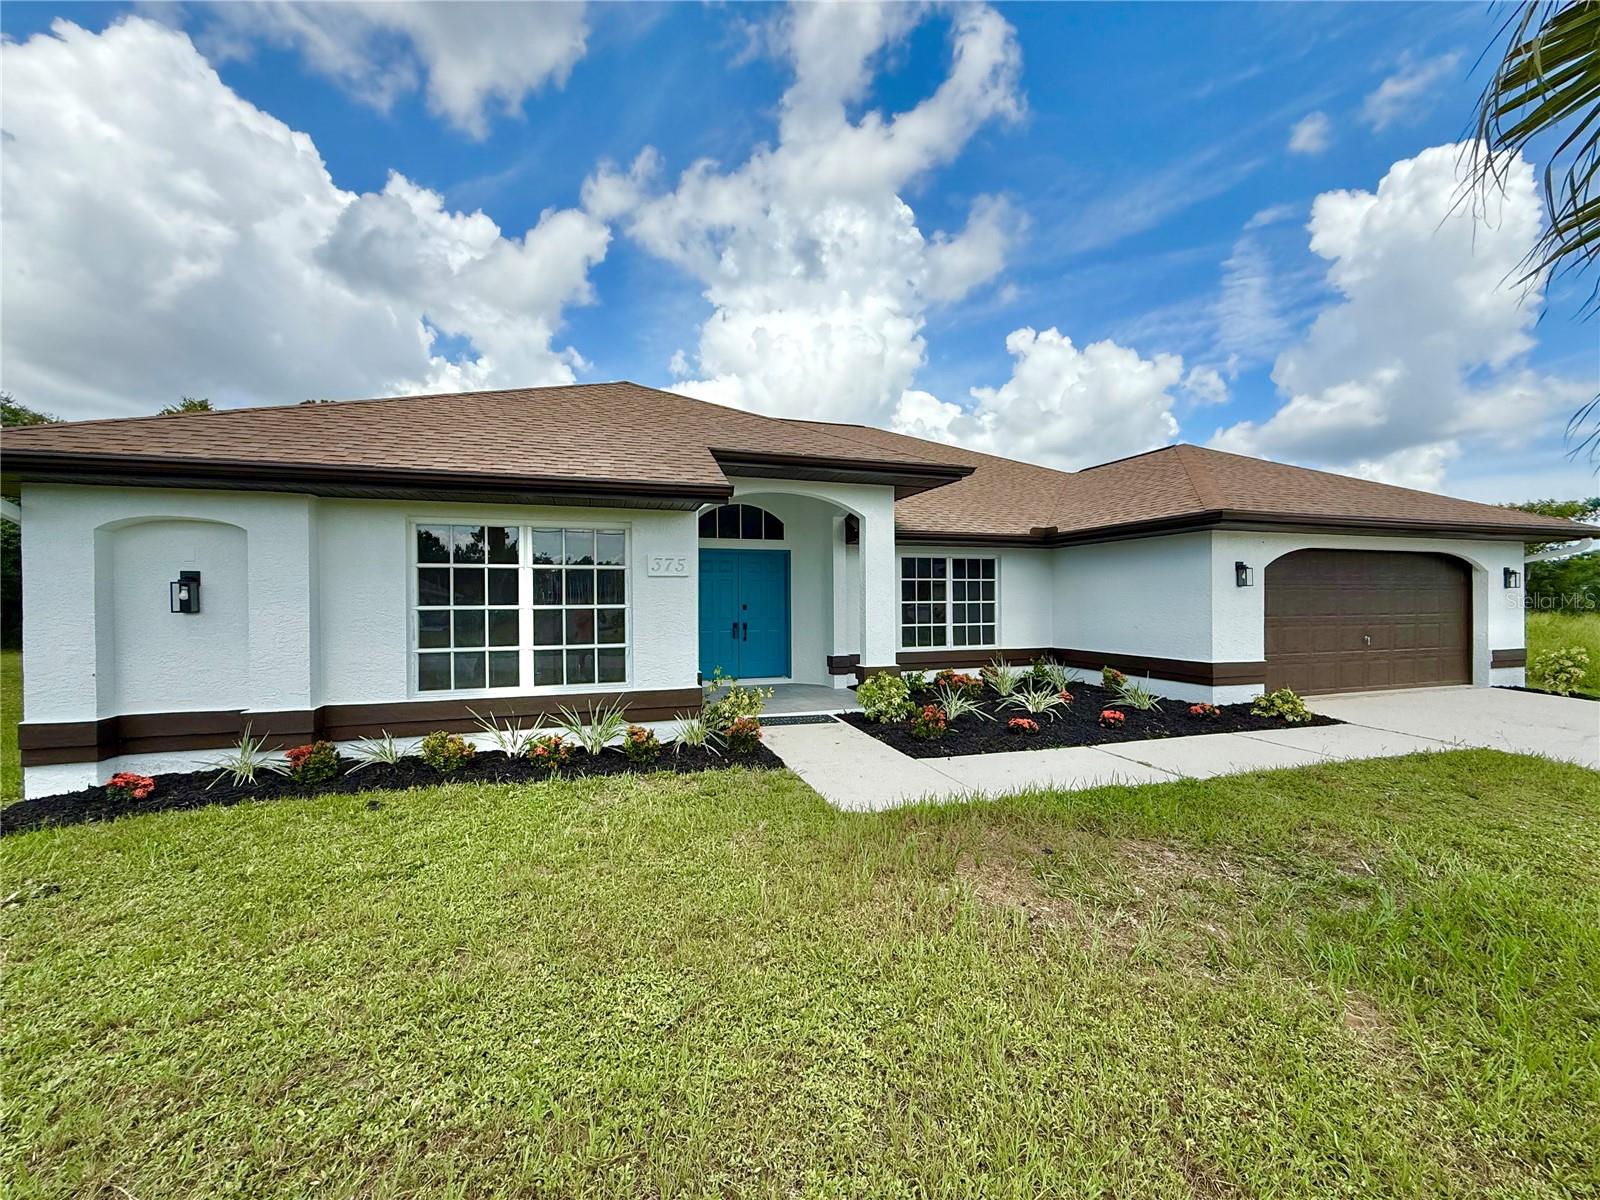
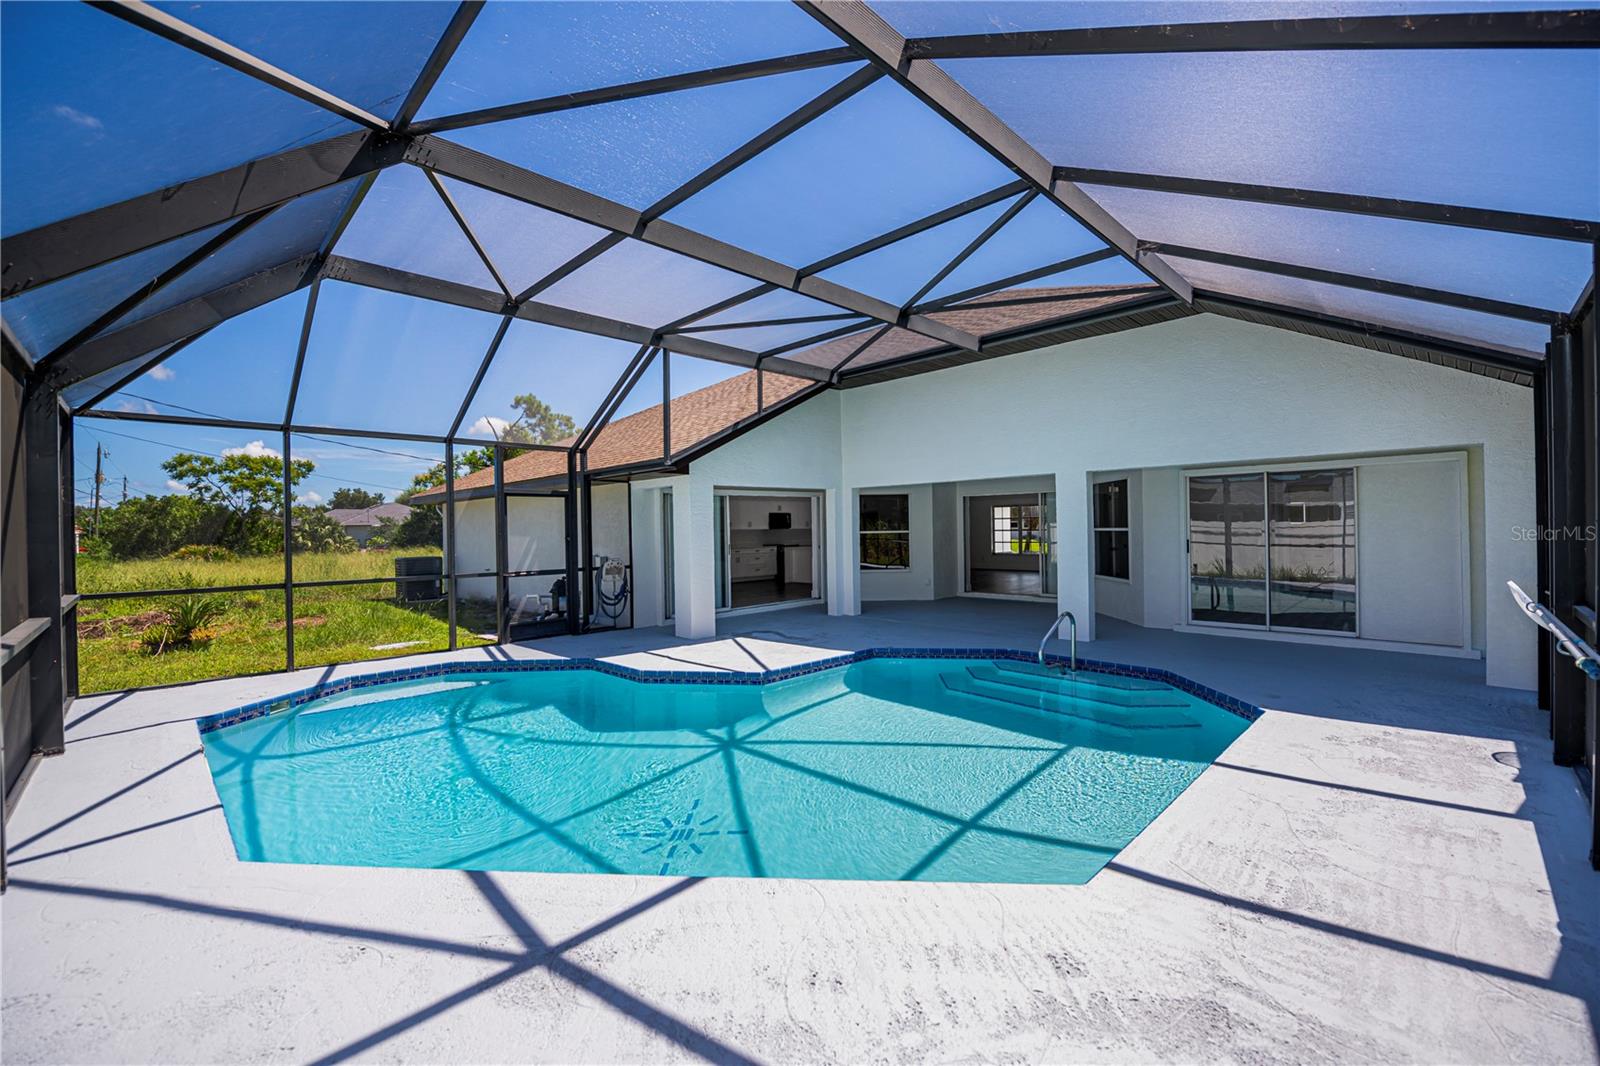
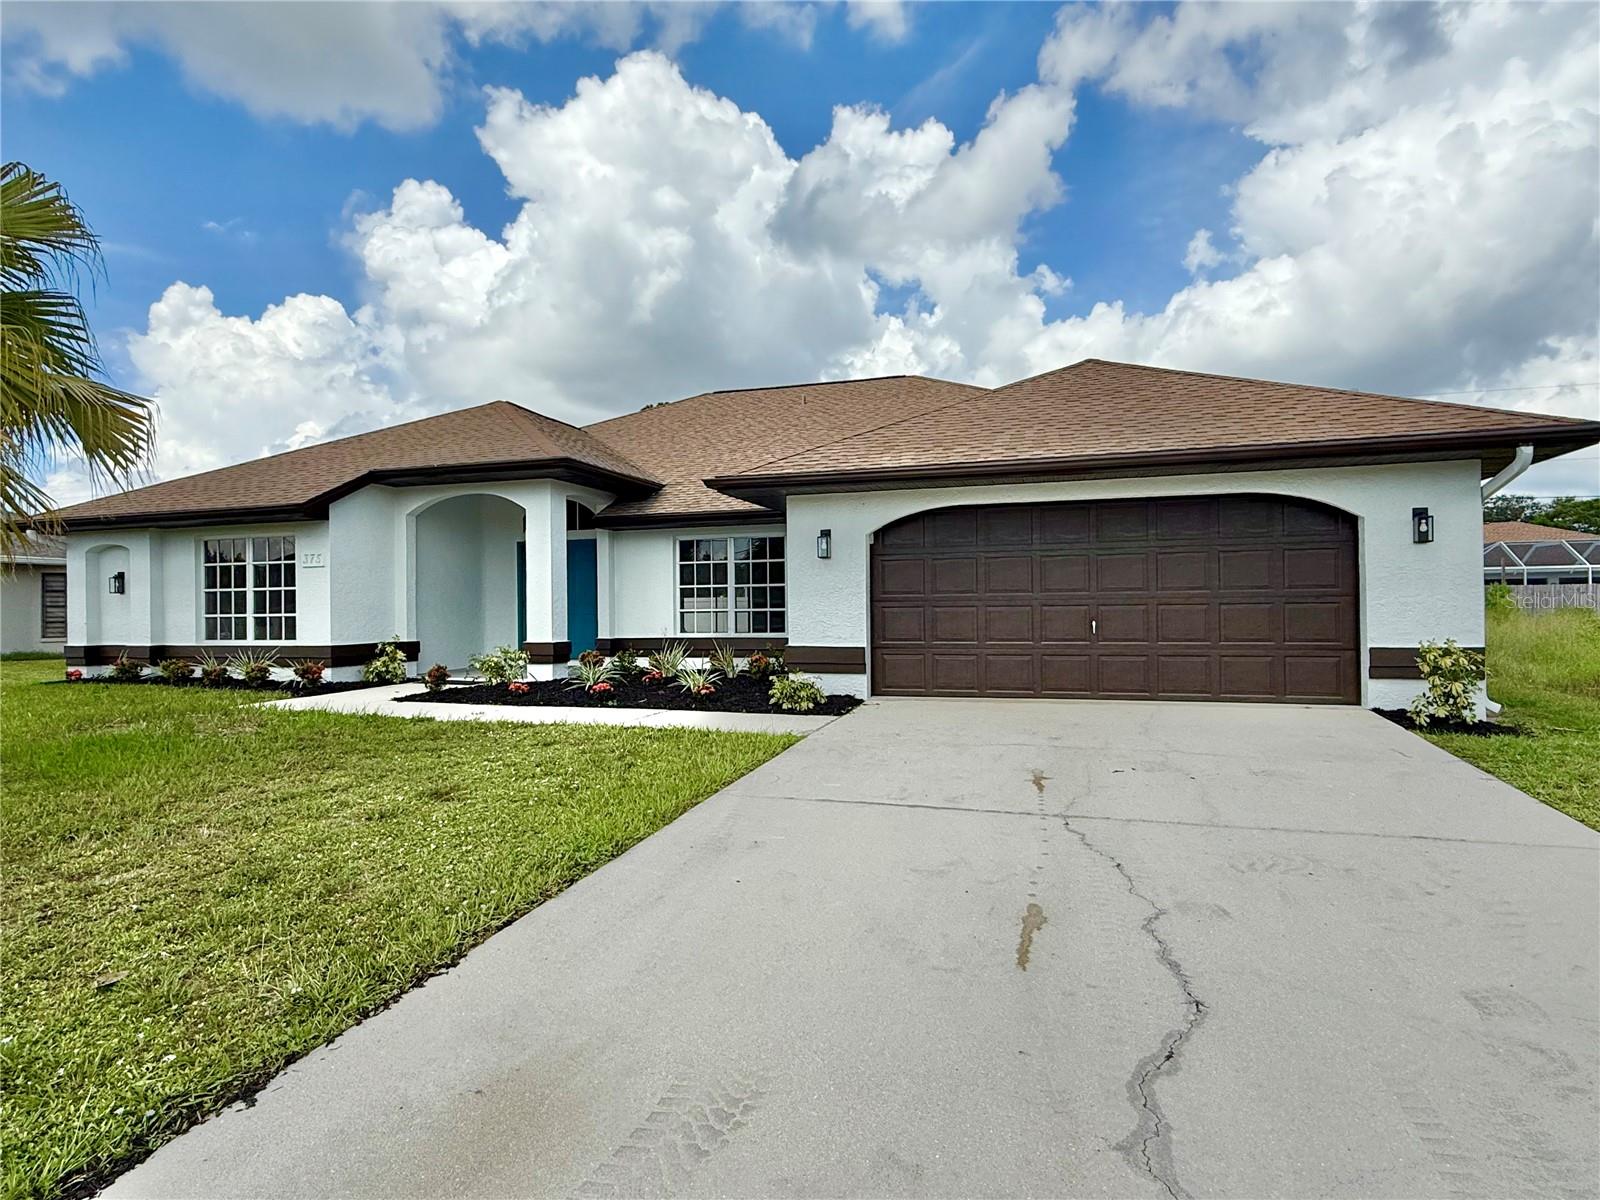
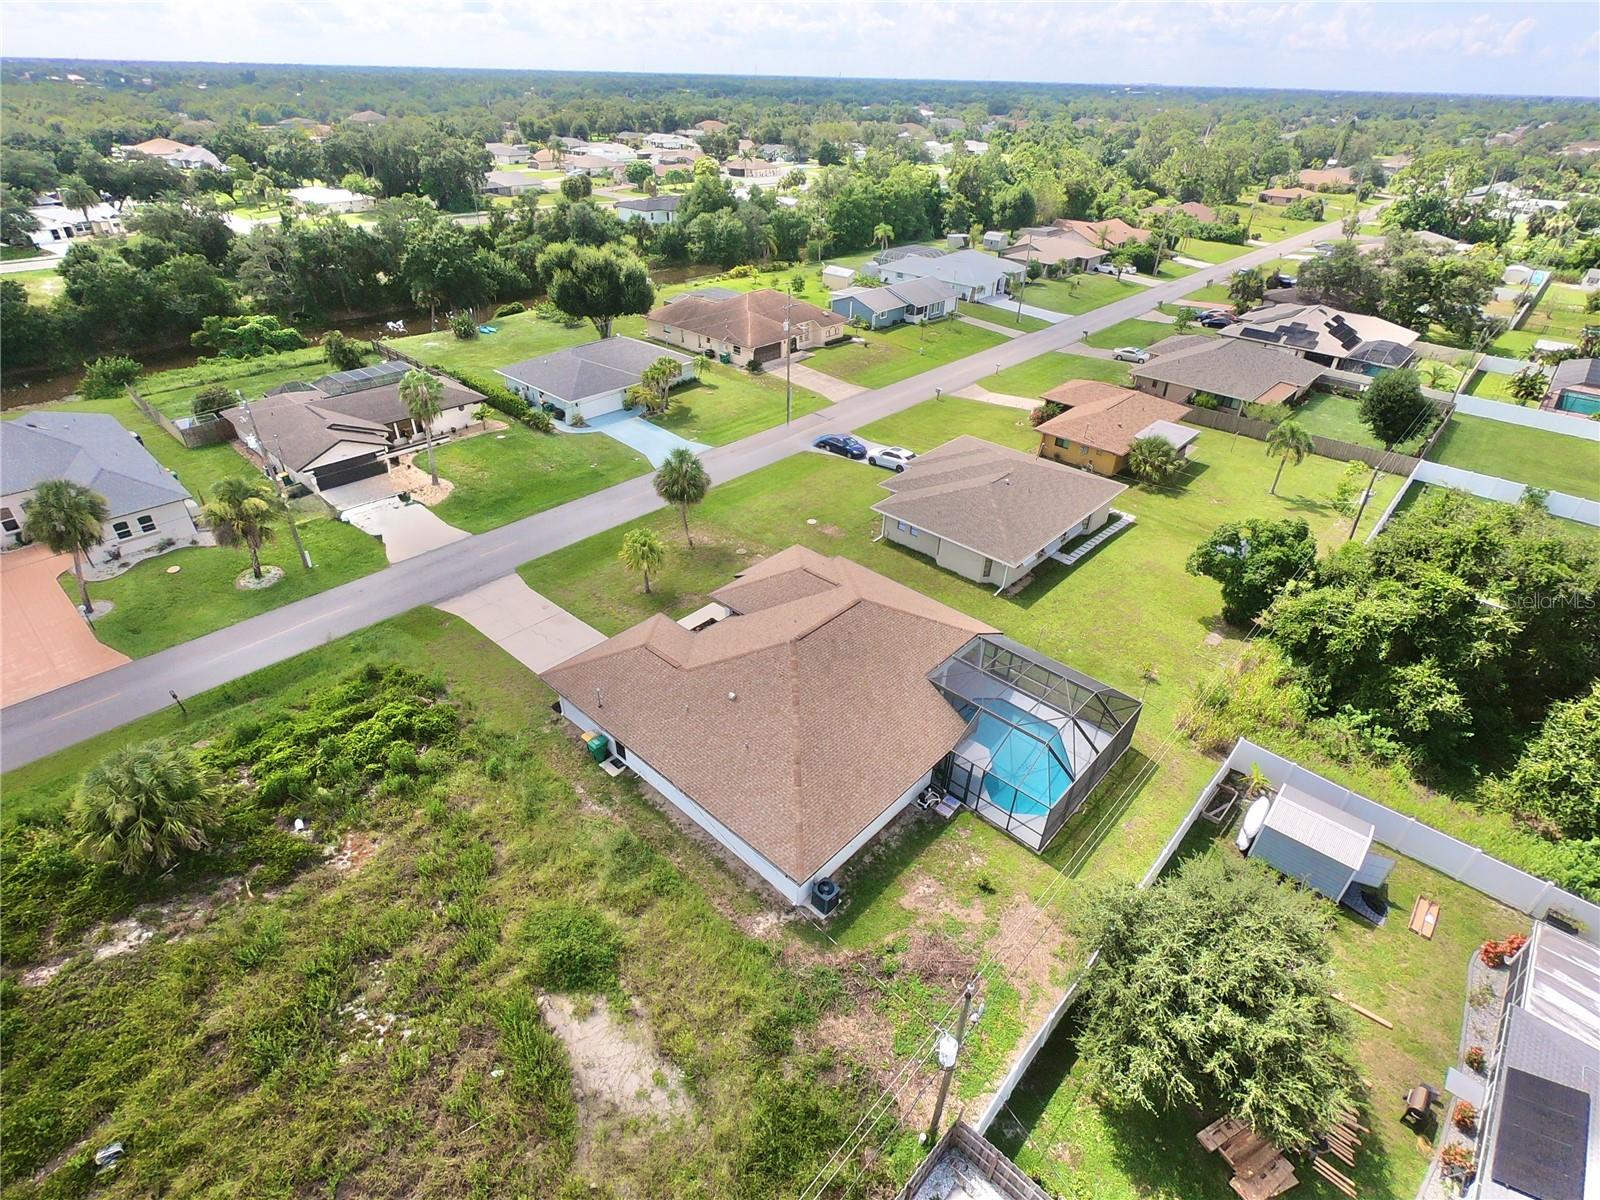
Property Description
One or more photo(s) has been virtually staged. WELCOME TO PERFECTION IN THIS 4 BEDROOM, 2-bath, 2-car garage POOL HOME located in a great area of newer homes and NOT IN A FLOOD ZONE. This beautifully designed split plan immediately impresses with outstanding curb appeal, accented by rich banded details, a soaring covered entryway with double doors, and striking exterior illumination. Step through the true foyer and discover vaulted ceilings, a separate dining room, and two spacious living areas filled with abundant natural light and nice pocketing sliders that draw your eye toward the privacy and inviting pool. The chef-worthy kitchen is a standout, featuring gorgeous quartz countertops with a matching backsplash, brand new stainless steel appliances, shaker cabinetry, decorator hardware, and a convenient breakfast bar perfect for casual dining or entertaining. The master suite is a tranquil retreat with its own private pool access, walk-in closets, and a luxurious en-suite bath offering dual sinks, a modern open concept rain shower, quartz finishes, and light-up touch mirrors for a spa-like experience. Guests will enjoy three additional generously sized nicely appointed bedrooms with serene views, while the second bathroom is equally impressive with oversized quartz tile from floor to ceiling, a matching vanity, and a modern touch mirror. At the heart of the home, the angular pool creates a resort-like atmosphere complete with a wide three-step walkout, side seating, and expansive areas for lounging, sunbathing, or relaxing in the shade under the covered screened lanai. A terrific space to enjoy anytime of day swimming or relaxing with friends or family. Three pocketing sliders seamlessly connect indoor and outdoor living, making this home an entertainer’s paradise. Enjoy the added convenience of an inside laundry room with its own soaking basin, as well as a full two-car garage. With no HOA restrictions and a large backyard, this property is ideal for those seeking luxury, comfort, and total peace of mind all in one remarkable package. Located in Southwest Florida, this property offers year-round access to boating, fishing, golfing, various Gulf beaches, natural resources, dining establishments, parks, public tennis courts, and shopping. Culturally enriching events are held regularly, with multiple baseball parks in close proximity. Conveniently situated just minutes from the Tampa Bay Rays Training Stadium, shopping mall and numerous parks, and a short 35-minute drive from multiple Gulf beaches, this residence provides exceptional accessibility. The Punta Gorda Regional Airport, served by Allegiant Air, is located a mere 12 miles away. Notably, Fisherman's Village and the Historic District, with their diverse array of dining and shopping options, are approximately 9 miles away. DON'T DELAY, this one of a kind home with unmatched views is priced to sell ...SCHEDULE YOUR SHOWING TODAY!
Build Your Team
Quickly find investor-friendly professionals who can help you succeed in real estate investing at any stage of the investing journey.


Agents
Match with investor-friendly agents who can help you find, analyze, and close your next deal


Lenders
Get the best funding…find investor-friendly lenders who specialize in your deal strategy


Property Managers
Transition to passive investing. Find a trusted property management partnership that lasts.


Tax Pros & Accountants
Taxes and financial reporting made easy—find experts to create tax savings strategies, file taxes, and more
Location
Property Details
Parking
- Description: Garage
- Details: Attached
- Garage Spaces: 2
- Spaces Total: 0
Bedroom Information
- # of Bedrooms: 4
Bathroom Information
- # of Baths (Full): 2
- # of Baths (Total): 2.0
Interior Features
- # of Rooms: 14
- # of Stories: 1
Exterior Features
- Exterior Walls Materials: Stucco
- Foundation: Slab
- Roof Material: Shingle
- Pool: Yes
Land Information
- Land Use: Residential
- Land Use Subtype: Single Family Residential
Lot Information
- Parcel ID: 402203408014
- Lot Size: 10000 sqft
Property Information
- Property Type: Single Family Residence
- Style: Florida
- Year Built: 1992
Tax Information
- Annual Tax: $5,560
Utilities
- Water & Sewer: Public
- Heating: Central
- Cooling: Central Air
Location
- County: Charlotte
Listing Details
Investment Summary
- Monthly Cash Flow
- -$1,056
- Cap Rate
- 3.3%
- Cash-on-Cash Return
- -12.6%
- Debt Coverage Ratio
- 0.53
- Internal Rate of Return (5 years)
- -8.1%
Cash Flow
Net Operating Income (NOI) minus mortgage payments.
Calculation:
NOI - Mortgage Payments
Cap Rate (Market Value)
Capitalization Rate is a rate of return that compares the yearly Net Operating Income (NOI) to the market value.
Calculation:
NOI / Market Value
Cash-on-Cash Return (CoC)
Annual Cash Flow / Cash Invested
Calculation:
Annual cash flow divided by initial cash invested.
Debt Coverage Ratio (DCR)
Net Operating Income (NOI) divided by total debt payments.
Calculation:
NOI / Total Debt Payments
Internal Rate of Return (IRR)
A metric for assessing profitability over time. IRR is the discount rate at which the net present value (NPV) of all future cash flows (positive and negative) from an investment equals zero — including both periodic cash flow (such as rent) and a projected sale at the end of the holding period. It represents the expected annualized return, accounting for income, expenses, and the recovery of capital through a future sale.
Purchase Details
Purchase PriceThe price paid for the property. Purchase price:
| $439,000 |
|---|---|
Amount FinancedThe amount of the purchase financed through a loan. Amount financed:
| -$351,200 |
Down paymentThe initial payment made towards the purchase. Down payment:
| $87,800 |
Closing CostsFees and expenses associated with purchasing a property, typically ranging from 2% to 5% of the home’s purchase price, paid at the end of a home purchase to cover services like lending, title transfer, and taxes. Closing costs:
| $13,170 |
Rehab CostsCosts incurred to repair or improve the property, including: roof, flooring, exterior siding, kitchen, exterior paint, bathrooms, etc. Rehab costs:
| $0 |
Initial Cash InvestedThe total initial cash invested in the property. Calculation:Down payment + Buying costs + Rehab costs Initial cash invested:
| $100,970 |
Square Feet (SQFT)The total square footage of the property. Square feet:
| 2,182 |
Cost Per Square FootCost per square foot of the property. Calculation:Purchase Price / Square Feet Cost per square foot:
| $201 |
Monthly Rent Per Square FootMonthly rent divided by the number of square feet. This ratio helps investors compare rental income efficiency across properties, markets, and unit sizes Calculation:Monthly Rent / Square Feet Monthly rent per square foot:
| $1.10 |
Financing Details
Loan AmountThe total sum of money borrowed from a lender to finance a property purchase. Calculation:Purchase Price - Down Payment
Loan amount:
| $351,200 |
|---|---|
Loan to Value Ratio (LTV)Loan amount divided by the market value of the property. Calculation:Loan Amount / Market Value
Loan to value ratio:
| 80.0% |
Loan TypeThe type of loan (e.g., fixed, adjustable).
Loan type:
| Amortizing |
TermThe loan repayment period in years.
Term:
| 30 years |
Interest RateThe percentage a lender charges on the borrowed amount of a loan, determining the cost of borrowing money.
Interest rate:
| 6.625% |
Principal & Interest (PI)The principal is the portion of the loan payment that reduces the loan balance. The interest is the lender's charge for borrowing money. Calculation:(P * r * (1 + r) ** n) / ((1 + r) ** n - 1) Where:
P = Loan amount (principal)
Principal & interest:
| $2,249 |
Property TaxesAnnual taxes levied by local governments on real estate properties. These taxes fund public services like schools, roads, and emergency services.
Property tax:
| $463 |
InsuranceThe costs for insurance coverage to protect against financial losses due to risks like fire, natural disasters, theft, liability, or tenant-related damages. Calculation:Assumes 7% of gross rental income, unless insurance rates are specified.
Insurance:
| $168 |
Private Mortgage Insurance (PMI)A fee that borrowers pay when they take out a conventional loan with a loan-to-value (LTV) ratio above 80%.
Private mortgage insurance (PMI):
| $0 |
Monthly PaymentThe fixed amount a borrower pays each month to repay a loan. It typically includes principal and interest (P&I) and may also cover property taxes, insurance, HOA fees, and PMI if escrowed. Monthly payment:
| $2,880 |
Operating Income
| % Rent | Monthly | Yearly | |
|---|---|---|---|
Gross RentThe total rental income received from tenants before deducting any expenses. Includes base rent, late fees, pet fees, parking fees, and other recurring charges.
Gross rent:
| $2,400 | $28,800 | |
Vacancy LossExpected loss of rent due to vacancies.
Vacancy loss:
(6%)
| 6% | -$144 | -$1,728 |
Operating IncomeGross rental income minus vacancy loss. Calculation:Gross rent - Vacancy loss
Operating income:
| $2,256 | $27,072 |
Operating Expenses
| % Rent | Monthly | Yearly | |
|---|---|---|---|
Property TaxesAnnual taxes levied by local governments on real estate properties. These taxes fund public services like schools, roads, and emergency services. | 19% | -$463 | -$5,561 |
InsuranceThe costs for insurance coverage to protect against financial losses due to risks like fire, natural disasters, theft, liability, or tenant-related damages. Calculation:Assumes 7% of gross rental income, unless insurance rates are specified. | 7% | -$168 | -$2,016 |
Property ManagementThe costs associated with hiring a property manager to handle the day-to-day operations of a rental property. Includes management fees, leasing fes, eviction fees, etc. Calculation:Assumes 8% of gross rental income. | 8% | -$192 | -$2,304 |
Repairs & MaintenanceOngoing costs for routine upkeep and minor fixes needed to keep a property in good working condition. Calculation:Assumes 5% of gross rental income. Varies by property age and condition. | 5% | -$120 | -$1,440 |
Capital ExpensesLarge, infrequent costs for major improvements or replacements, like a new roof, HVAC system, or appliances. Calculation:Assumes 5% of gross rental income. Varies by property age. | 5% | -$120 | -$1,440 |
HOA FeesRegular dues paid to a Homeowners Association for community maintenance, amenities, and management. Similar fees include: Condo Association Fees, Co-op Maintenance Fees, etc. | n/a | n/a | n/a |
Operating ExpensesRecurring costs required to maintain and manage a rental property, including property taxes, insurance, maintenance, repairs, utilities (if paid by the owner), property management fees, and other day-to-day expenses. Calculation:Insurance + Property Taxes + Property Management + Repairs & Maintenance + Capital Expenditures + HOA Fees | 44% | -$1,063 | -$12,761 |
Cash Flow
| Monthly | Yearly | |
|---|---|---|
Net Operating Income (NOI)The income generated from a property after deducting all operating expenses but before deducting mortgage payments, taxes, and capital expenditures. Calculation:Gross Operating Income - Operating Expenses
Net operating income:
| $1,193 | $14,316 |
Mortgage PaymentThe fixed amount a borrower pays each month to repay a loan. It typically includes principal and interest (P&I) and may also cover property taxes, insurance, HOA fees, and PMI if escrowed. | -$2,249 | -$26,988 |
Cash FlowNet Operating Income (NOI) minus mortgage payments. Calculation:NOI - Mortgage Payments | $1,056 | $12,672 |