$1,350,000
Investment Summary
- Monthly Cash Flow
- -$5,393
- Cap Rate
- 0.9%
- Cash-on-Cash Return
- -20.8%
- Debt Coverage Ratio
- 0.16
- Internal Rate of Return (5 years)
- -16.1%
Cash Flow
Net Operating Income (NOI) minus mortgage payments.
Calculation:
NOI - Mortgage Payments
Cap Rate (Market Value)
Capitalization Rate is a rate of return that compares the yearly Net Operating Income (NOI) to the market value.
Calculation:
NOI / Market Value
Cash-on-Cash Return (CoC)
Annual Cash Flow / Cash Invested
Calculation:
Annual cash flow divided by initial cash invested.
Debt Coverage Ratio (DCR)
Net Operating Income (NOI) divided by total debt payments.
Calculation:
NOI / Total Debt Payments
Internal Rate of Return (IRR)
A metric for assessing profitability over time. IRR is the discount rate at which the net present value (NPV) of all future cash flows (positive and negative) from an investment equals zero — including both periodic cash flow (such as rent) and a projected sale at the end of the holding period. It represents the expected annualized return, accounting for income, expenses, and the recovery of capital through a future sale.
Property Description
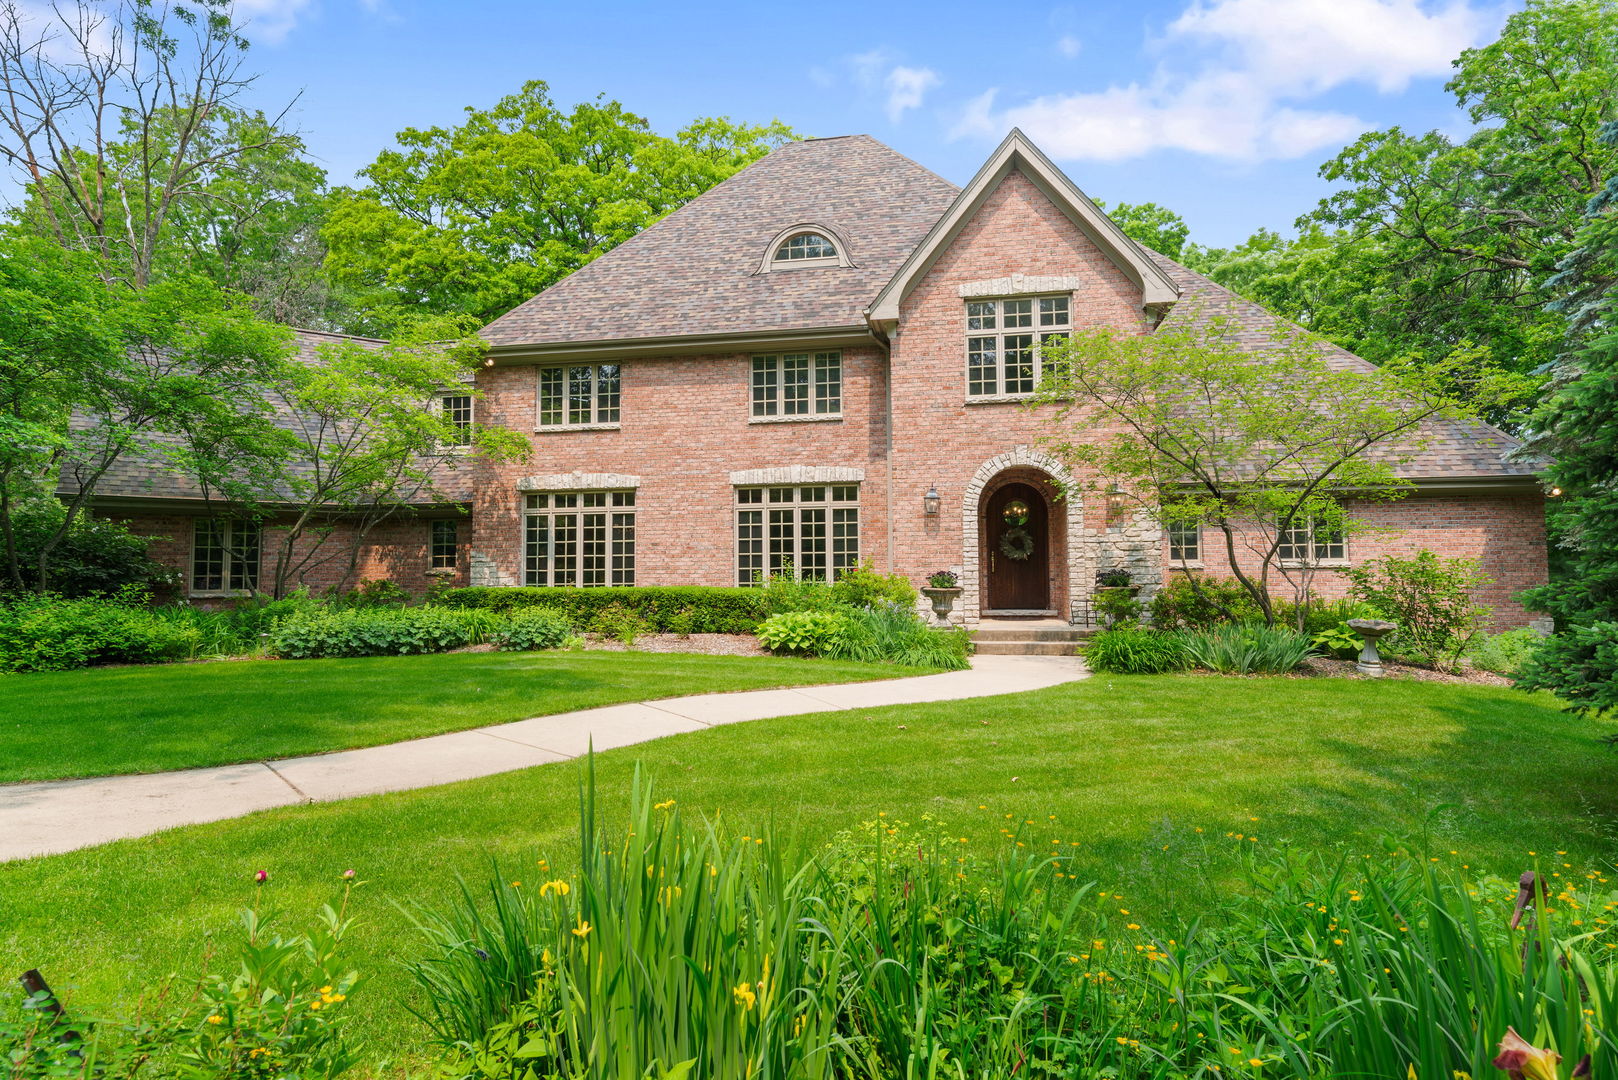
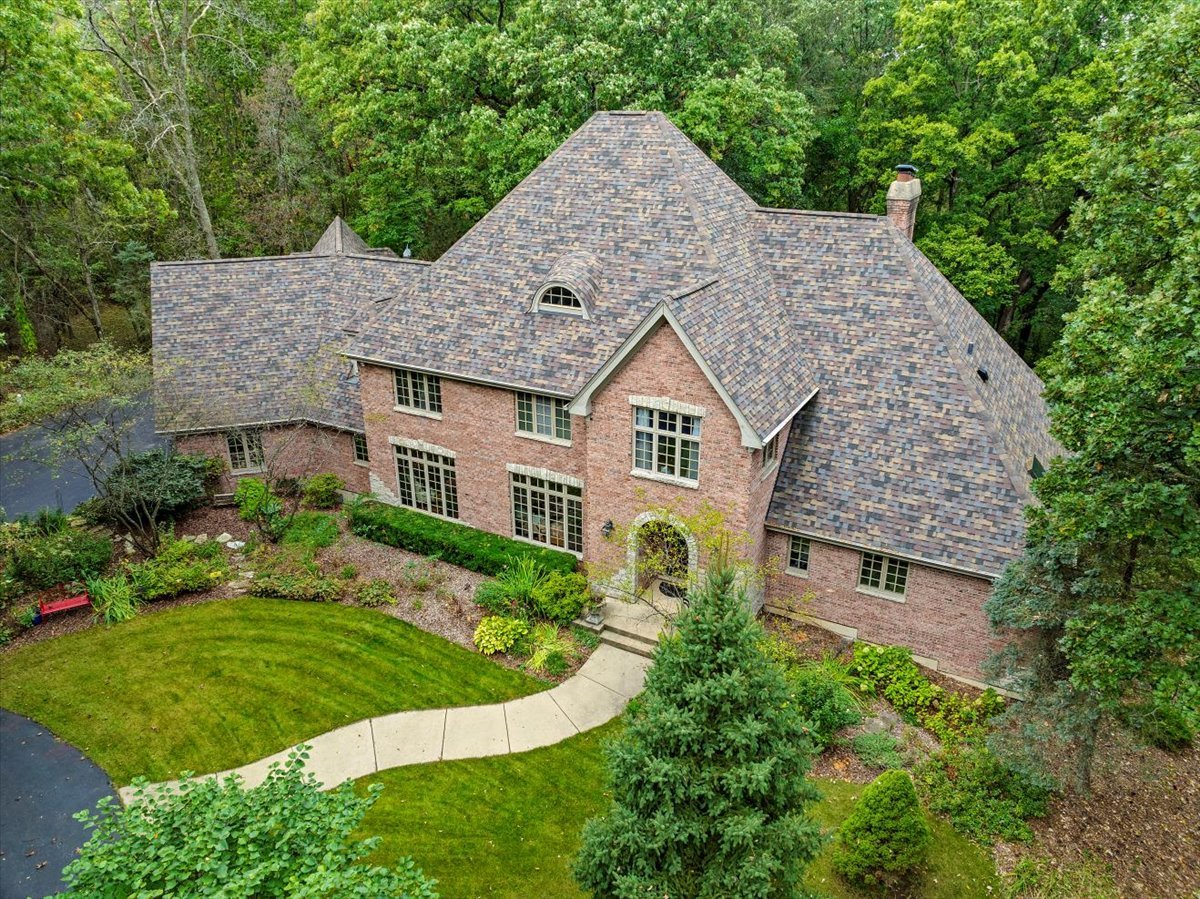
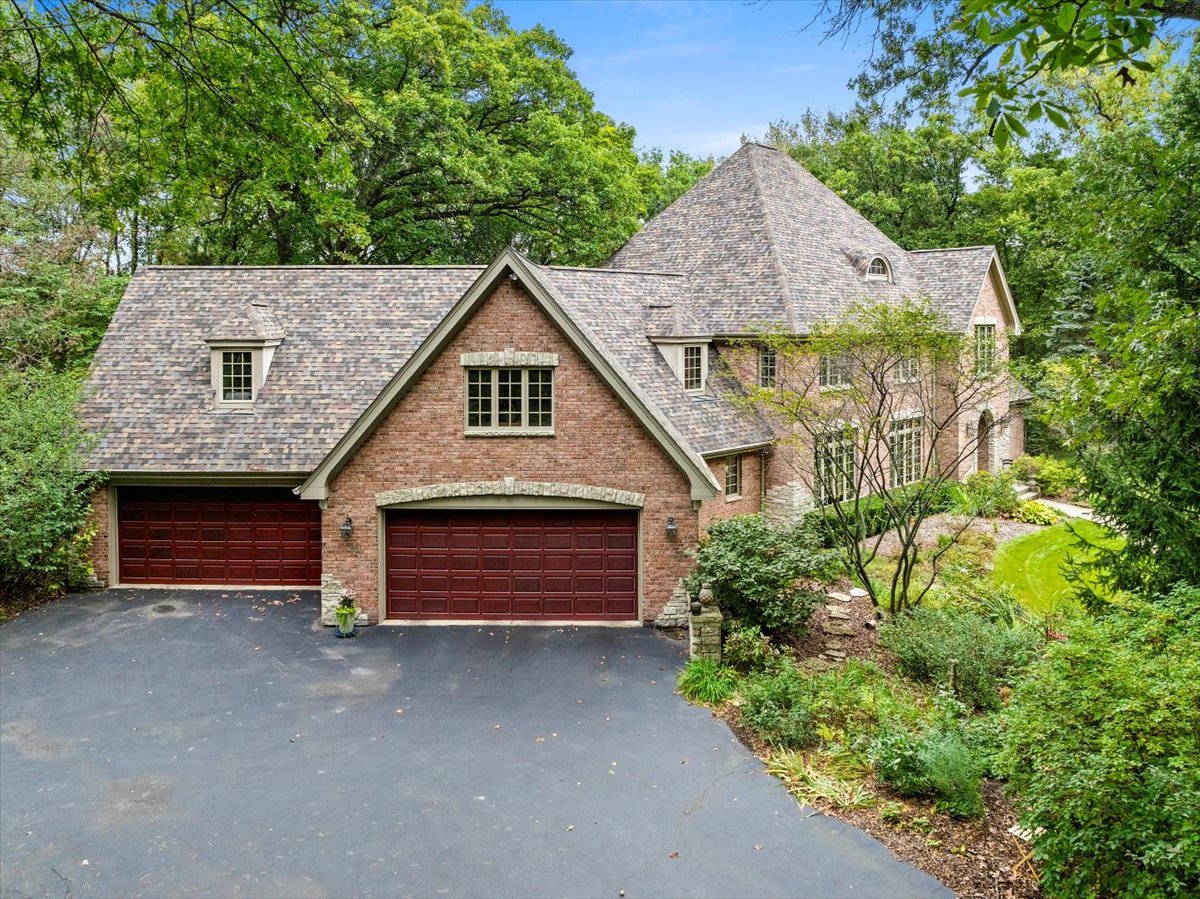
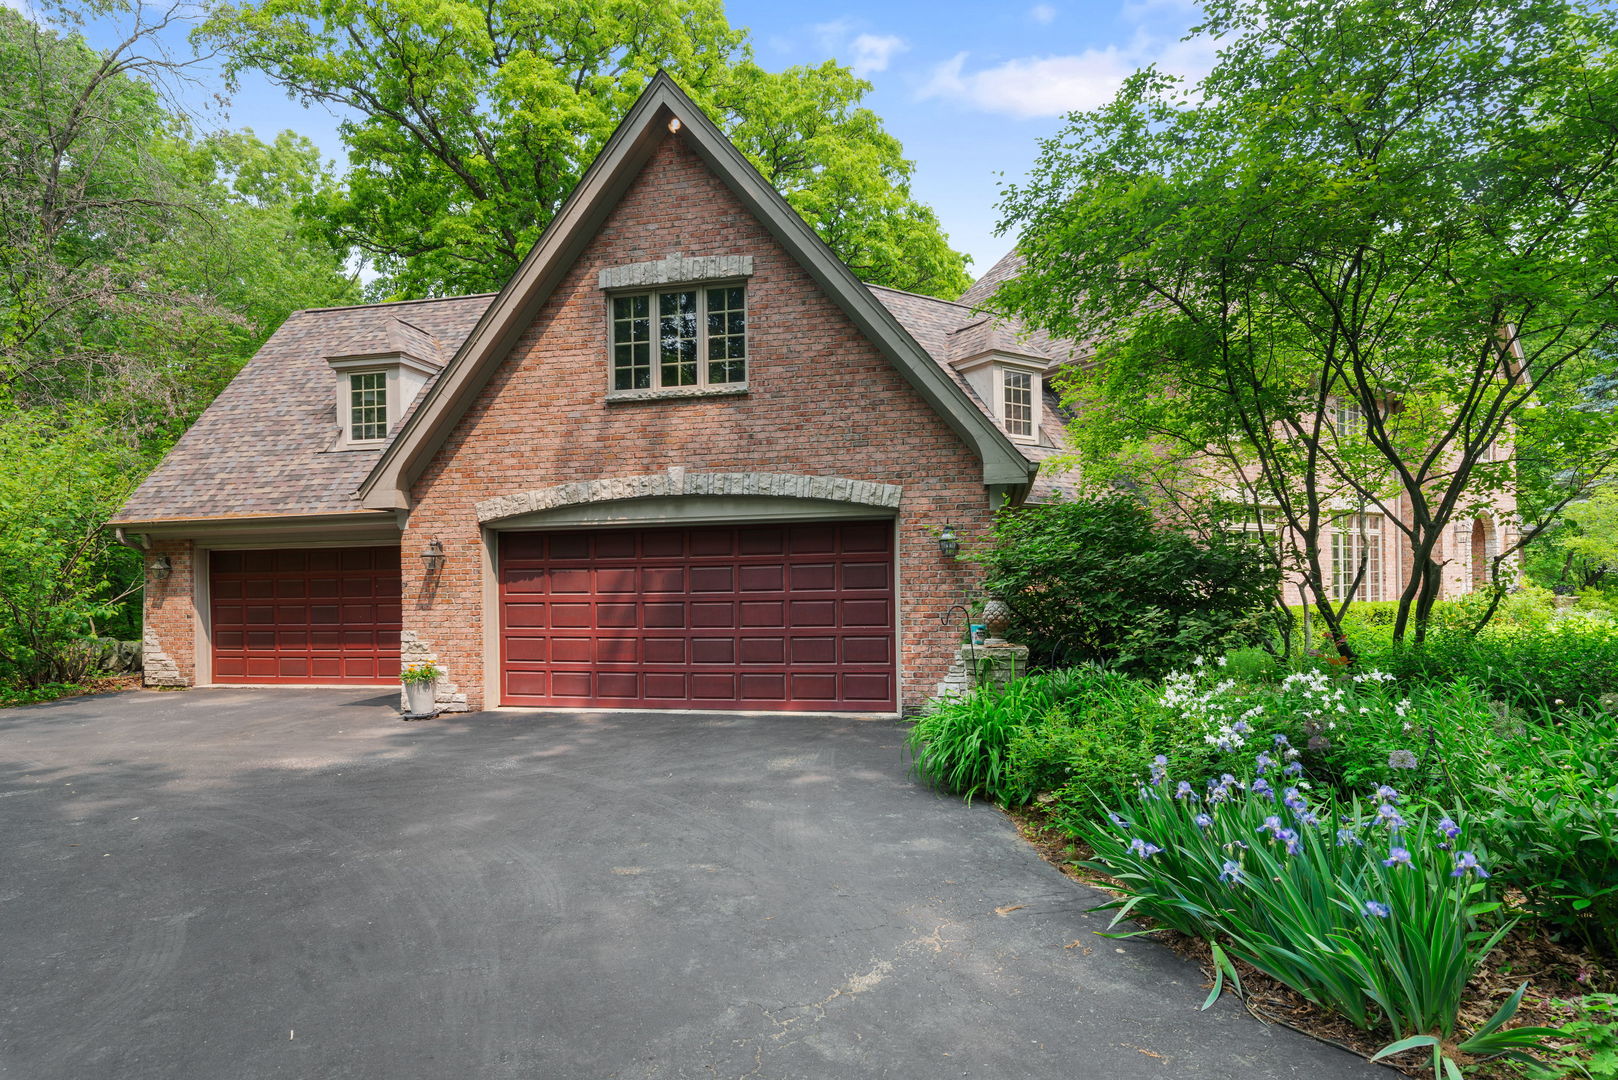
Tucked away on a secluded 6-acre wooded lot, this custom-built Havlicek home offers unmatched privacy and timeless craftsmanship. Surrounded by mature trees, the all-brick 5,700+ sqft residence is entirely hidden from the road, creating a true private retreat. Drive down the long private road and arrive at a stately circle driveway, framed by beautiful landscaping. Step inside to discover a spacious layout featuring a luxurious first-floor master suite with two walk-in closets, a stone fireplace, and a spa-like en suite with large soaking tub, tile shower, and double vanities. The impressive two-story living room showcases grand, high-set windows that flood the space with natural light, vaulted ceilings with skylights, a striking stone fireplace, and hardwood floors, creating a warm and inviting atmosphere with scenic views of the private backyard. The gourmet kitchen features granite countertops, a large center island with prep sink, a walk-in pantry, ample wood cabinetry, and a bright breakfast area with skylight, offering a picturesque setting for everyday meals. From here, step directly onto the expansive stone patio, ideal for outdoor dining, entertaining, or simply enjoying the peaceful, wooded surroundings. Just off the front foyer, the formal dining and living space offers a generous open layout with large front-facing windows that fill the room with natural light. Additional main-level highlights include a spacious mudroom, a well-equipped laundry room with sink and cabinet storage, and abundant closet space throughout the home. Upstairs, you'll find three generously sized bedrooms, all with hardwood floors, two of which include walk-in closets. A shared Jack & Jill bathroom features double vanities and a separate tub/shower combo in a private water closet, while the third bedroom enjoys its own private en suite bath. Completing the upper level is a massive bonus room above the 4-car attached garage, boasting tall ceilings and hardwood floors, ideal for a media room, recreation area, or guest suite. The finished walkout basement provides an abundance of additional living space, featuring a spacious family room with a brick fireplace and sliding glass doors that open to a second stone patio. You'll also find a full bar/kitchenette with a new fridge, a versatile flex room with built-ins and a stone fireplace, a large storage area, and a full bath. Outdoors, enjoy professional landscaping, 1.5-car detached garage, stone patios, and endless space to roam. Additional highlights include radiant heated flooring in master bath, lower level, and attached garage, security system, reverse osmosis water system, and a new roof. This extraordinary estate is a rare combination of size, quality, and privacy, offering an unparalleled lifestyle for those seeking space, serenity, and luxury in a wooded setting. Ideally located within the highly regarded St. Charles 303 School District, and just minutes from The Hawk Country Club, LeRoy Oakes Forest Preserve, the Randall Road shopping corridor, and DuPage Airport.
Build Your Team
Quickly find investor-friendly professionals who can help you succeed in real estate investing at any stage of the investing journey.


Agents
Match with investor-friendly agents who can help you find, analyze, and close your next deal


Lenders
Get the best funding…find investor-friendly lenders who specialize in your deal strategy


Property Managers
Transition to passive investing. Find a trusted property management partnership that lasts.


Tax Pros & Accountants
Taxes and financial reporting made easy—find experts to create tax savings strategies, file taxes, and more
Location
Property Details
Parking
- Description: Attached Garage
- Details: Asphalt, Circular Driveway, Heated Garage, Garage, On Site, Attached, Detached, Driveway
- Garage Spaces: 5
- Spaces Total: 5
Bedroom Information
- # of Bedrooms: 4
Bathroom Information
- # of Baths (Full): 4
- # of Baths (Partial): 1
- # of Baths (Total): 5.0
Interior Features
- # of Rooms: 12
- # of Stories: 2
- Attic: Yes
- Basement: Yes
- Basement Description: Finished, Exterior Entry, Storage Space, Full, Walk-Out Access
- Fireplace: Yes
Exterior Features
- Exterior Walls Materials: Brick
- Foundation: Concrete Perimeter
- Roof Material: Asphalt
Land Information
- Land Use: Residential
- Land Use Subtype: Single Family Residential
Lot Information
- Parcel ID: 0918400002
- Lot Size: 0 sqft
Property Information
- Property Type: Single Family Residence
- Year Built: 1999
Tax Information
- Annual Tax: $35,248
Utilities
- Water & Sewer: Well
- Heating: Natural Gas, Forced Air, Radiant, Zoned, Radiant Floor
- Cooling: Central Air
Location
- County: Kane
Listing Details
Investment Summary
- Monthly Cash Flow
- -$5,393
- Cap Rate
- 0.9%
- Cash-on-Cash Return
- -20.8%
- Debt Coverage Ratio
- 0.16
- Internal Rate of Return (5 years)
- -16.1%
Cash Flow
Net Operating Income (NOI) minus mortgage payments.
Calculation:
NOI - Mortgage Payments
Cap Rate (Market Value)
Capitalization Rate is a rate of return that compares the yearly Net Operating Income (NOI) to the market value.
Calculation:
NOI / Market Value
Cash-on-Cash Return (CoC)
Annual Cash Flow / Cash Invested
Calculation:
Annual cash flow divided by initial cash invested.
Debt Coverage Ratio (DCR)
Net Operating Income (NOI) divided by total debt payments.
Calculation:
NOI / Total Debt Payments
Internal Rate of Return (IRR)
A metric for assessing profitability over time. IRR is the discount rate at which the net present value (NPV) of all future cash flows (positive and negative) from an investment equals zero — including both periodic cash flow (such as rent) and a projected sale at the end of the holding period. It represents the expected annualized return, accounting for income, expenses, and the recovery of capital through a future sale.
Purchase Details
Purchase PriceThe price paid for the property. Purchase price:
| $1,350,000 |
|---|---|
Amount FinancedThe amount of the purchase financed through a loan. Amount financed:
| -$1,080,000 |
Down paymentThe initial payment made towards the purchase. Down payment:
| $270,000 |
Closing CostsFees and expenses associated with purchasing a property, typically ranging from 2% to 5% of the home’s purchase price, paid at the end of a home purchase to cover services like lending, title transfer, and taxes. Closing costs:
| $40,500 |
Rehab CostsCosts incurred to repair or improve the property, including: roof, flooring, exterior siding, kitchen, exterior paint, bathrooms, etc. Rehab costs:
| $0 |
Initial Cash InvestedThe total initial cash invested in the property. Calculation:Down payment + Buying costs + Rehab costs Initial cash invested:
| $310,500 |
Square Feet (SQFT)The total square footage of the property. Square feet:
| 7,062 |
Cost Per Square FootCost per square foot of the property. Calculation:Purchase Price / Square Feet Cost per square foot:
| $191 |
Monthly Rent Per Square FootMonthly rent divided by the number of square feet. This ratio helps investors compare rental income efficiency across properties, markets, and unit sizes Calculation:Monthly Rent / Square Feet Monthly rent per square foot:
| $0.81 |
Financing Details
Loan AmountThe total sum of money borrowed from a lender to finance a property purchase. Calculation:Purchase Price - Down Payment
Loan amount:
| $1,080,000 |
|---|---|
Loan to Value Ratio (LTV)Loan amount divided by the market value of the property. Calculation:Loan Amount / Market Value
Loan to value ratio:
| 80.0% |
Loan TypeThe type of loan (e.g., fixed, adjustable).
Loan type:
| Amortizing |
TermThe loan repayment period in years.
Term:
| 30 years |
Interest RateThe percentage a lender charges on the borrowed amount of a loan, determining the cost of borrowing money.
Interest rate:
| 5.875% |
Principal & Interest (PI)The principal is the portion of the loan payment that reduces the loan balance. The interest is the lender's charge for borrowing money. Calculation:(P * r * (1 + r) ** n) / ((1 + r) ** n - 1) Where:
P = Loan amount (principal)
Principal & interest:
| $6,389 |
Property TaxesAnnual taxes levied by local governments on real estate properties. These taxes fund public services like schools, roads, and emergency services.
Property tax:
| $2,937 |
InsuranceThe costs for insurance coverage to protect against financial losses due to risks like fire, natural disasters, theft, liability, or tenant-related damages. Calculation:Assumes 7% of gross rental income, unless insurance rates are specified.
Insurance:
| $399 |
Private Mortgage Insurance (PMI)A fee that borrowers pay when they take out a conventional loan with a loan-to-value (LTV) ratio above 80%.
Private mortgage insurance (PMI):
| $0 |
Monthly PaymentThe fixed amount a borrower pays each month to repay a loan. It typically includes principal and interest (P&I) and may also cover property taxes, insurance, HOA fees, and PMI if escrowed. Monthly payment:
| $9,725 |
Operating Income
| % Rent | Monthly | Yearly | |
|---|---|---|---|
Gross RentThe total rental income received from tenants before deducting any expenses. Includes base rent, late fees, pet fees, parking fees, and other recurring charges.
Gross rent:
| $5,700 | $68,400 | |
Vacancy LossExpected loss of rent due to vacancies.
Vacancy loss:
(6%)
| 6% | -$342 | -$4,104 |
Operating IncomeGross rental income minus vacancy loss. Calculation:Gross rent - Vacancy loss
Operating income:
| $5,358 | $64,296 |
Operating Expenses
| % Rent | Monthly | Yearly | |
|---|---|---|---|
Property TaxesAnnual taxes levied by local governments on real estate properties. These taxes fund public services like schools, roads, and emergency services. | 52% | -$2,937 | -$35,249 |
InsuranceThe costs for insurance coverage to protect against financial losses due to risks like fire, natural disasters, theft, liability, or tenant-related damages. Calculation:Assumes 7% of gross rental income, unless insurance rates are specified. | 7% | -$399 | -$4,788 |
Property ManagementThe costs associated with hiring a property manager to handle the day-to-day operations of a rental property. Includes management fees, leasing fes, eviction fees, etc. Calculation:Assumes 8% of gross rental income. | 8% | -$456 | -$5,472 |
Repairs & MaintenanceOngoing costs for routine upkeep and minor fixes needed to keep a property in good working condition. Calculation:Assumes 5% of gross rental income. Varies by property age and condition. | 5% | -$285 | -$3,420 |
Capital ExpensesLarge, infrequent costs for major improvements or replacements, like a new roof, HVAC system, or appliances. Calculation:Assumes 5% of gross rental income. Varies by property age. | 5% | -$285 | -$3,420 |
HOA FeesRegular dues paid to a Homeowners Association for community maintenance, amenities, and management. Similar fees include: Condo Association Fees, Co-op Maintenance Fees, etc. | n/a | n/a | n/a |
Operating ExpensesRecurring costs required to maintain and manage a rental property, including property taxes, insurance, maintenance, repairs, utilities (if paid by the owner), property management fees, and other day-to-day expenses. Calculation:Insurance + Property Taxes + Property Management + Repairs & Maintenance + Capital Expenditures + HOA Fees | 77% | -$4,362 | -$52,349 |
Cash Flow
| Monthly | Yearly | |
|---|---|---|
Net Operating Income (NOI)The income generated from a property after deducting all operating expenses but before deducting mortgage payments, taxes, and capital expenditures. Calculation:Gross Operating Income - Operating Expenses
Net operating income:
| $996 | $11,952 |
Mortgage PaymentThe fixed amount a borrower pays each month to repay a loan. It typically includes principal and interest (P&I) and may also cover property taxes, insurance, HOA fees, and PMI if escrowed. | -$6,389 | -$76,668 |
Cash FlowNet Operating Income (NOI) minus mortgage payments. Calculation:NOI - Mortgage Payments | -$5,393 | -$64,716 |