


$975,000
Investment Summary
- Monthly Cash Flow
- -$1,815
- Cap Rate
- 3.4%
- Cash-on-Cash Return
- -9.7%
- Debt Coverage Ratio
- 0.61
- Internal Rate of Return (5 years)
- -5.4%
Cash Flow
Net Operating Income (NOI) minus mortgage payments.
Calculation:
NOI - Mortgage Payments
Cap Rate (Market Value)
Capitalization Rate is a rate of return that compares the yearly Net Operating Income (NOI) to the market value.
Calculation:
NOI / Market Value
Cash-on-Cash Return (CoC)
Annual Cash Flow / Cash Invested
Calculation:
Annual cash flow divided by initial cash invested.
Debt Coverage Ratio (DCR)
Net Operating Income (NOI) divided by total debt payments.
Calculation:
NOI / Total Debt Payments
Internal Rate of Return (IRR)
A metric for assessing profitability over time. IRR is the discount rate at which the net present value (NPV) of all future cash flows (positive and negative) from an investment equals zero — including both periodic cash flow (such as rent) and a projected sale at the end of the holding period. It represents the expected annualized return, accounting for income, expenses, and the recovery of capital through a future sale.
Property Description
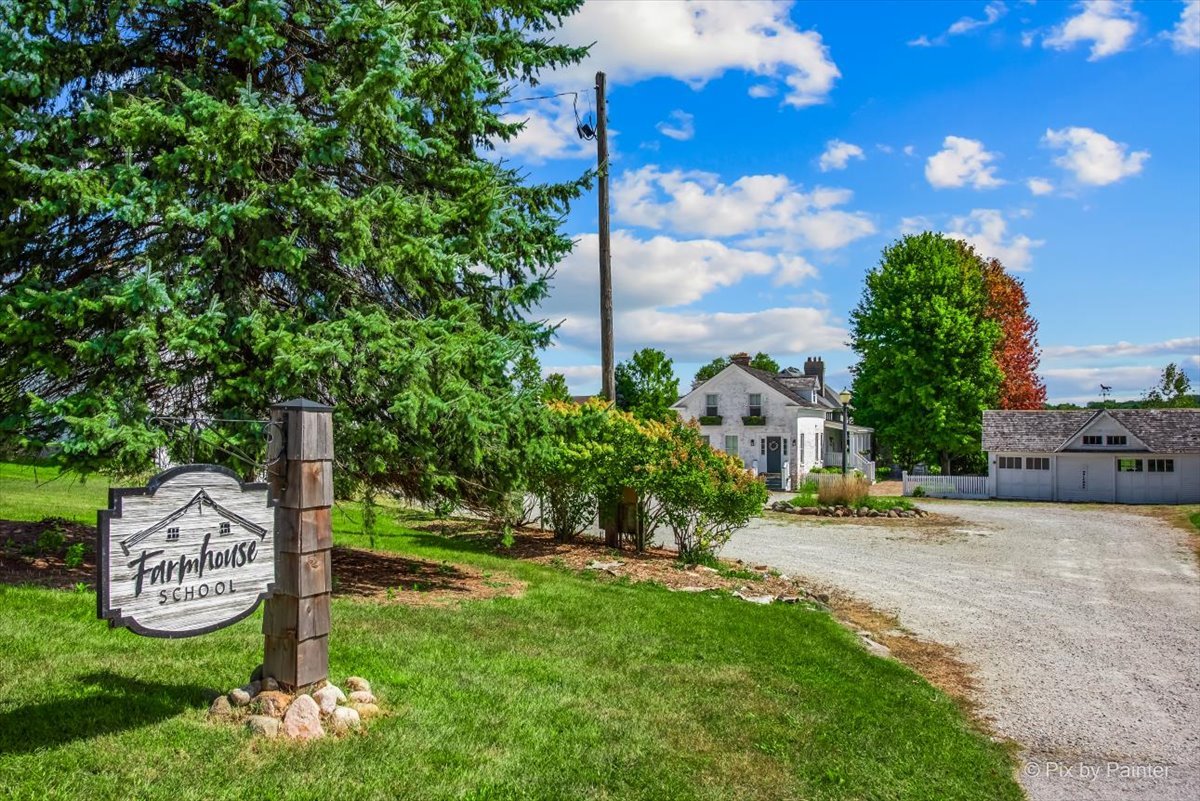
A once-in-a-lifetime opportunity to own this unique 2+ acre property which has been farmed since 1830 and is listed on the Kane County Historic Register! Located minutes from everything you could need and consisting of 2 historic homes, 2 outbuildings, and 2 organic gardens to grow flowers, herbs, and fresh veggies, this space has most recently been home to Farmhouse School - a small business devoted to teaching people how to grow and cook "real" food. The 1860 Farm House is a 2567 sf/3 bedroom, 2.1 bath residence that has been completely renovated down to the studs. With modern baths and kitchen, 1st-floor laundry and master suite, modern HVAC, and plenty of living and entertaining space, this home provides all the conveniences you need while still honoring the original vintage charm. The expansive deep basement gives you tons of storage plus the possibility of finishing part of it for additional living space. Both a front porch and a back screened porch are the perfect places to rest and relax at the end of a long day with a view of the nearby pond and prairie. The 1847 Durant Home (1900 sf) was moved to the property and renovations completed in 1999 when it began its life as a cooking school - complete with a special use permit for light commercial use and full ADA compliance. Two bedrooms and 1.1 baths plus an enormous kitchen with numerous cooking stations - which could easily be transformed into a great room! With an additional modern basement, this house provides plenty of storage as well! The barn is the oldest structure in Campton Township (1833) and has two levels for storage and entertaining! Both the barn and the 2-car coach house (1929) have been made structurally sound and have new electrical wiring - the barn also has new oak flooring in many places. The grounds are filled with spaces to explore and delight in: from the apple orchard to the classically designed flower and vegetable garden to the grapevine arbor for dinner parties to the willow fences to the oversized gazebo and more! Full of character and history, this little slice of yesteryear is ready for its next reincarnation: will it continue on as a school for cooking, art or music? Will it become home to a multi-generational family? Will it provide a work-from-home opportunity for an individual or small business? Will it become a charming B&B or special events venue? Will it allow for the most magical homeschool or Montessori setting? The possibilities are endless in this storied, much-loved location! With too many custom details to list here, take a tour of the farm and experience life in the country with all the conveniences of suburbia today! Don't miss the virtual tour as well to have a tiny glimpse of all that this magical property holds!
Build Your Team
Quickly find investor-friendly professionals who can help you succeed in real estate investing at any stage of the investing journey.


Agents
Match with investor-friendly agents who can help you find, analyze, and close your next deal


Lenders
Get the best funding…find investor-friendly lenders who specialize in your deal strategy


Property Managers
Transition to passive investing. Find a trusted property management partnership that lasts.


Tax Pros & Accountants
Taxes and financial reporting made easy—find experts to create tax savings strategies, file taxes, and more
Location
Property Details
Parking
- Description: Off Street, Visitor Parking, Driveway, Parking Lot
- Details: Gravel, Circular Driveway, Garage Door Opener, On Site, Detached, Off Street, Guest, Driveway, Parking Lot, Garage
- Garage Spaces: 2
- Spaces Total: 27
Bedroom Information
- # of Bedrooms: 5
Bathroom Information
- # of Baths (Full): 3
- # of Baths (Partial): 2
- # of Baths (Total): 5.0
Interior Features
- # of Rooms: 9
- # of Stories: 2
- Attic: Yes
- Basement: Yes
- Basement Description: Unfinished, Concrete, Full
- Fireplace: Yes
Exterior Features
- Foundation: Concrete Perimeter, Stone
- Roof Material: Asphalt, Shake
Land Information
- Land Use: Residential
- Land Use Subtype: Rural/Agricultural
Lot Information
- Parcel ID: 0826400013
- Lot Size: 0 sqft
Property Information
- Property Type: Single Family Residence
- Style: Farmhouse
Tax Information
- Annual Tax: $12,784
Utilities
- Water & Sewer: Public
- Heating: Natural Gas
- Cooling: Central Air
Location
- County: Kane
Listing Details
Investment Summary
- Monthly Cash Flow
- -$1,815
- Cap Rate
- 3.4%
- Cash-on-Cash Return
- -9.7%
- Debt Coverage Ratio
- 0.61
- Internal Rate of Return (5 years)
- -5.4%
Cash Flow
Net Operating Income (NOI) minus mortgage payments.
Calculation:
NOI - Mortgage Payments
Cap Rate (Market Value)
Capitalization Rate is a rate of return that compares the yearly Net Operating Income (NOI) to the market value.
Calculation:
NOI / Market Value
Cash-on-Cash Return (CoC)
Annual Cash Flow / Cash Invested
Calculation:
Annual cash flow divided by initial cash invested.
Debt Coverage Ratio (DCR)
Net Operating Income (NOI) divided by total debt payments.
Calculation:
NOI / Total Debt Payments
Internal Rate of Return (IRR)
A metric for assessing profitability over time. IRR is the discount rate at which the net present value (NPV) of all future cash flows (positive and negative) from an investment equals zero — including both periodic cash flow (such as rent) and a projected sale at the end of the holding period. It represents the expected annualized return, accounting for income, expenses, and the recovery of capital through a future sale.
Purchase Details
Purchase PriceThe price paid for the property. Purchase price:
| $975,000 |
|---|---|
Amount FinancedThe amount of the purchase financed through a loan. Amount financed:
| -$780,000 |
Down paymentThe initial payment made towards the purchase. Down payment:
| $195,000 |
Closing CostsFees and expenses associated with purchasing a property, typically ranging from 2% to 5% of the home’s purchase price, paid at the end of a home purchase to cover services like lending, title transfer, and taxes. Closing costs:
| $29,250 |
Rehab CostsCosts incurred to repair or improve the property, including: roof, flooring, exterior siding, kitchen, exterior paint, bathrooms, etc. Rehab costs:
| $0 |
Initial Cash InvestedThe total initial cash invested in the property. Calculation:Down payment + Buying costs + Rehab costs Initial cash invested:
| $224,250 |
Square Feet (SQFT)The total square footage of the property. Square feet:
| 4,400 |
Cost Per Square FootCost per square foot of the property. Calculation:Purchase Price / Square Feet Cost per square foot:
| $222 |
Monthly Rent Per Square FootMonthly rent divided by the number of square feet. This ratio helps investors compare rental income efficiency across properties, markets, and unit sizes Calculation:Monthly Rent / Square Feet Monthly rent per square foot:
| $1.27 |
Financing Details
Loan AmountThe total sum of money borrowed from a lender to finance a property purchase. Calculation:Purchase Price - Down Payment
Loan amount:
| $780,000 |
|---|---|
Loan to Value Ratio (LTV)Loan amount divided by the market value of the property. Calculation:Loan Amount / Market Value
Loan to value ratio:
| 80.0% |
Loan TypeThe type of loan (e.g., fixed, adjustable).
Loan type:
| Amortizing |
TermThe loan repayment period in years.
Term:
| 30 years |
Interest RateThe percentage a lender charges on the borrowed amount of a loan, determining the cost of borrowing money.
Interest rate:
| 5.875% |
Principal & Interest (PI)The principal is the portion of the loan payment that reduces the loan balance. The interest is the lender's charge for borrowing money. Calculation:(P * r * (1 + r) ** n) / ((1 + r) ** n - 1) Where:
P = Loan amount (principal)
Principal & interest:
| $4,614 |
Property TaxesAnnual taxes levied by local governments on real estate properties. These taxes fund public services like schools, roads, and emergency services.
Property tax:
| $1,065 |
InsuranceThe costs for insurance coverage to protect against financial losses due to risks like fire, natural disasters, theft, liability, or tenant-related damages. Calculation:Assumes 7% of gross rental income, unless insurance rates are specified.
Insurance:
| $392 |
Private Mortgage Insurance (PMI)A fee that borrowers pay when they take out a conventional loan with a loan-to-value (LTV) ratio above 80%.
Private mortgage insurance (PMI):
| $0 |
Monthly PaymentThe fixed amount a borrower pays each month to repay a loan. It typically includes principal and interest (P&I) and may also cover property taxes, insurance, HOA fees, and PMI if escrowed. Monthly payment:
| $6,071 |
Operating Income
| % Rent | Monthly | Yearly | |
|---|---|---|---|
Gross RentThe total rental income received from tenants before deducting any expenses. Includes base rent, late fees, pet fees, parking fees, and other recurring charges.
Gross rent:
| $5,600 | $67,200 | |
Vacancy LossExpected loss of rent due to vacancies.
Vacancy loss:
(6%)
| 6% | -$336 | -$4,032 |
Operating IncomeGross rental income minus vacancy loss. Calculation:Gross rent - Vacancy loss
Operating income:
| $5,264 | $63,168 |
Operating Expenses
| % Rent | Monthly | Yearly | |
|---|---|---|---|
Property TaxesAnnual taxes levied by local governments on real estate properties. These taxes fund public services like schools, roads, and emergency services. | 19% | -$1,065 | -$12,784 |
InsuranceThe costs for insurance coverage to protect against financial losses due to risks like fire, natural disasters, theft, liability, or tenant-related damages. Calculation:Assumes 7% of gross rental income, unless insurance rates are specified. | 7% | -$392 | -$4,704 |
Property ManagementThe costs associated with hiring a property manager to handle the day-to-day operations of a rental property. Includes management fees, leasing fes, eviction fees, etc. Calculation:Assumes 8% of gross rental income. | 8% | -$448 | -$5,376 |
Repairs & MaintenanceOngoing costs for routine upkeep and minor fixes needed to keep a property in good working condition. Calculation:Assumes 5% of gross rental income. Varies by property age and condition. | 5% | -$280 | -$3,360 |
Capital ExpensesLarge, infrequent costs for major improvements or replacements, like a new roof, HVAC system, or appliances. Calculation:Assumes 5% of gross rental income. Varies by property age. | 5% | -$280 | -$3,360 |
HOA FeesRegular dues paid to a Homeowners Association for community maintenance, amenities, and management. Similar fees include: Condo Association Fees, Co-op Maintenance Fees, etc. | n/a | n/a | n/a |
Operating ExpensesRecurring costs required to maintain and manage a rental property, including property taxes, insurance, maintenance, repairs, utilities (if paid by the owner), property management fees, and other day-to-day expenses. Calculation:Insurance + Property Taxes + Property Management + Repairs & Maintenance + Capital Expenditures + HOA Fees | 44% | -$2,465 | -$29,584 |
Cash Flow
| Monthly | Yearly | |
|---|---|---|
Net Operating Income (NOI)The income generated from a property after deducting all operating expenses but before deducting mortgage payments, taxes, and capital expenditures. Calculation:Gross Operating Income - Operating Expenses
Net operating income:
| $2,799 | $33,588 |
Mortgage PaymentThe fixed amount a borrower pays each month to repay a loan. It typically includes principal and interest (P&I) and may also cover property taxes, insurance, HOA fees, and PMI if escrowed. | -$4,614 | -$55,368 |
Cash FlowNet Operating Income (NOI) minus mortgage payments. Calculation:NOI - Mortgage Payments | -$1,815 | -$21,780 |