

$1,898,999
Investment Summary
- Monthly Cash Flow
- -$4,403
- Cap Rate
- 3.4%
- Cash-on-Cash Return
- -12.1%
- Debt Coverage Ratio
- 0.55
- Internal Rate of Return (5 years)
- -7.7%
Cash Flow
Net Operating Income (NOI) minus mortgage payments.
Calculation:
NOI - Mortgage Payments
Cap Rate (Market Value)
Capitalization Rate is a rate of return that compares the yearly Net Operating Income (NOI) to the market value.
Calculation:
NOI / Market Value
Cash-on-Cash Return (CoC)
Annual Cash Flow / Cash Invested
Calculation:
Annual cash flow divided by initial cash invested.
Debt Coverage Ratio (DCR)
Net Operating Income (NOI) divided by total debt payments.
Calculation:
NOI / Total Debt Payments
Internal Rate of Return (IRR)
A metric for assessing profitability over time. IRR is the discount rate at which the net present value (NPV) of all future cash flows (positive and negative) from an investment equals zero — including both periodic cash flow (such as rent) and a projected sale at the end of the holding period. It represents the expected annualized return, accounting for income, expenses, and the recovery of capital through a future sale.
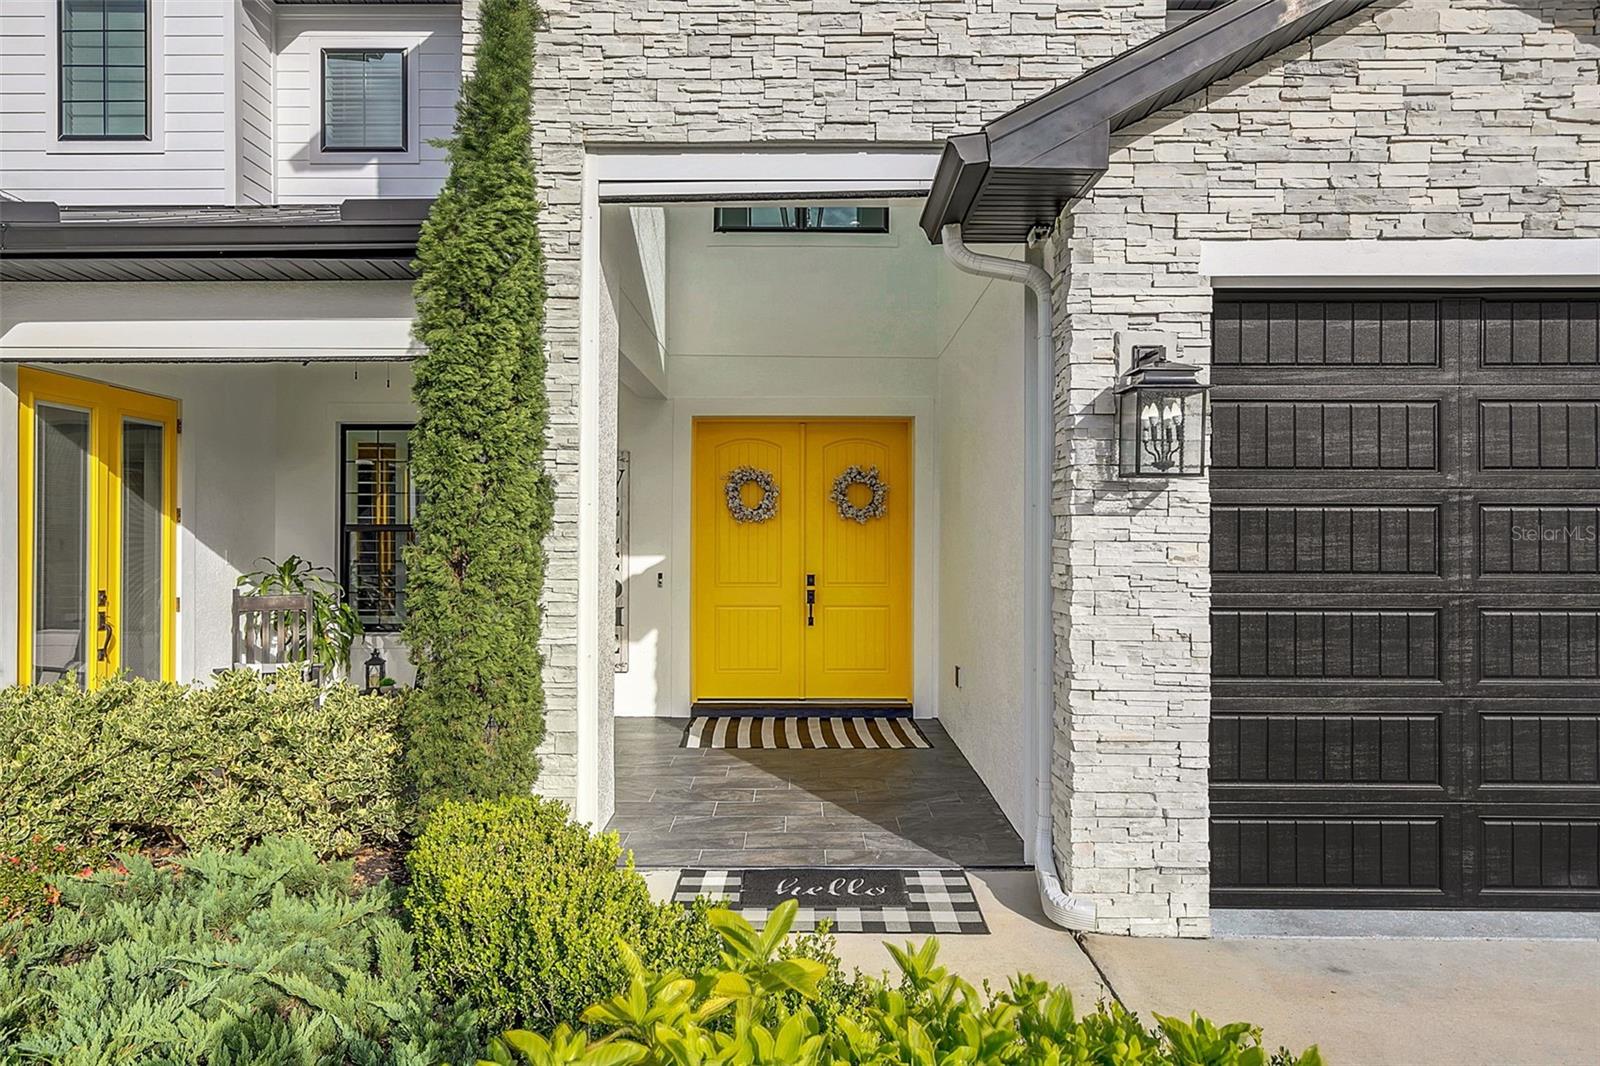
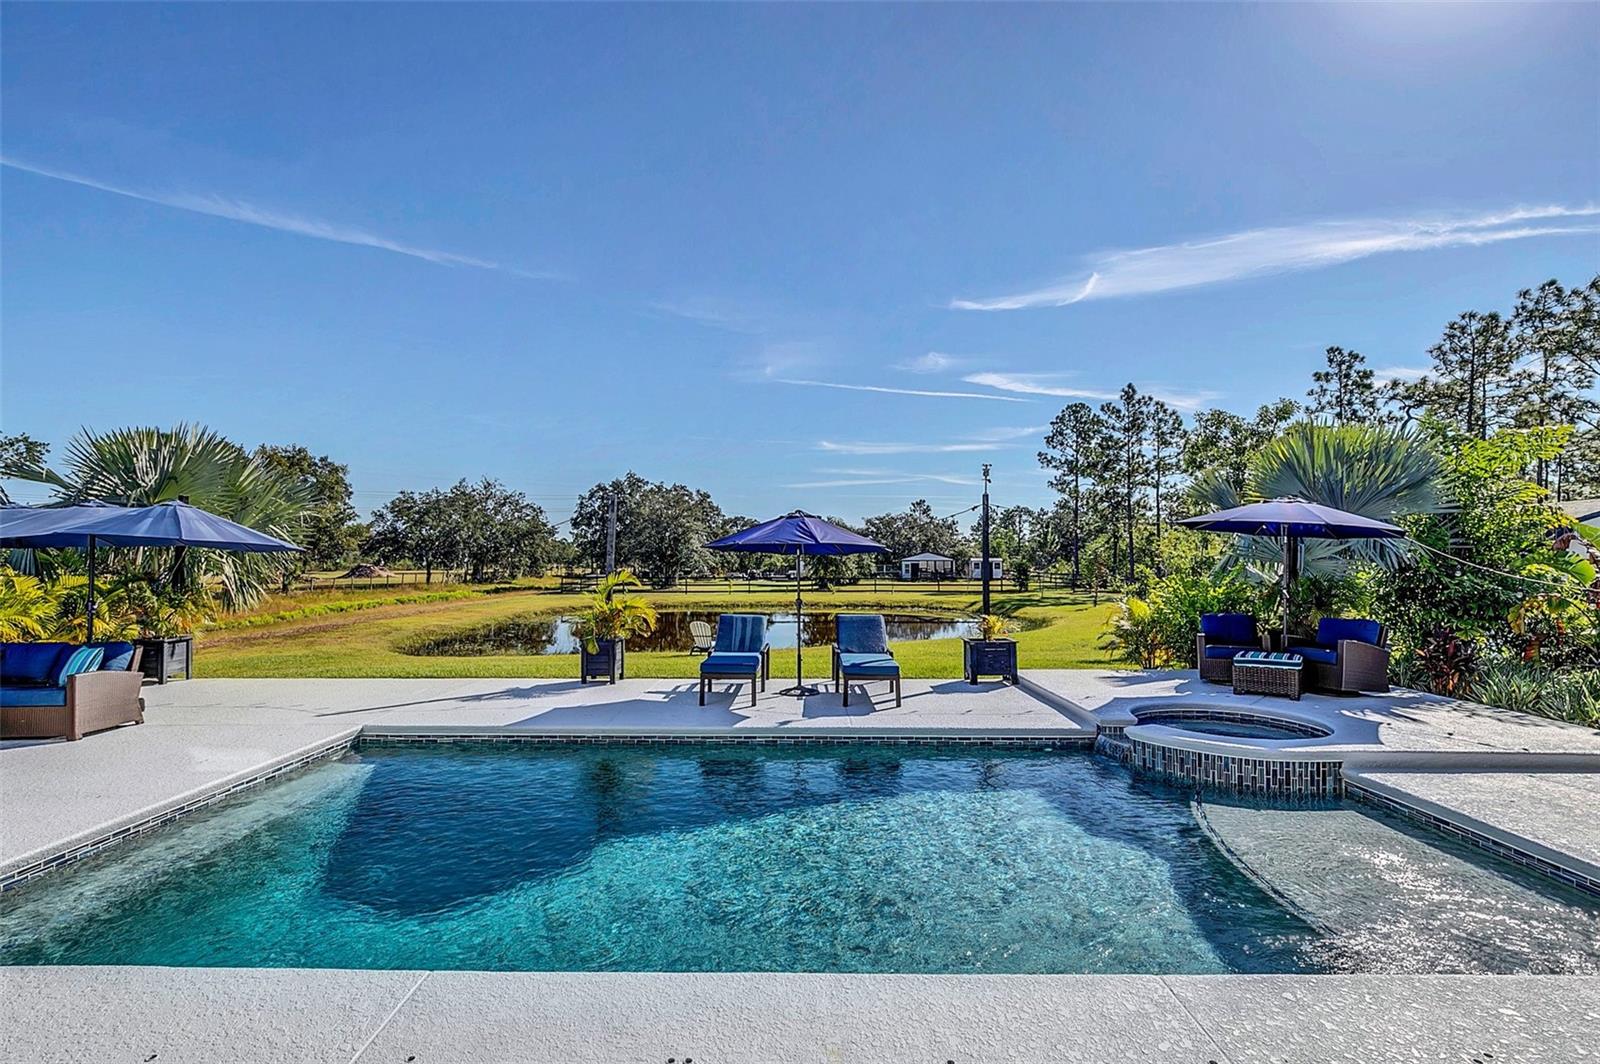
Property Description
***Up to $38,000 Lender Credit towards buyer’s closing costs if using our preferred lender!*** This exquisite 6 bedroom, 4.5 bath modern farmhouse sits on nearly 2.5 acres of high and dry land with its own pond! The property is gated with an extended driveway and features expansive front and rear porches perfect for sunrise and sunset viewing. Automatic screens on both porches ensure comfort year-round. Upon entering, you are greeted with beautiful double front doors that lead into a luxurious and open living space well-equipped for entertaining. The downstairs features a front sitting area, formal living room, MIL suite or home office with a private bathroom, formal dining room, generous living room, chef's dream kitchen with butler's pantry, laundry area, mudroom, half-bath, and a retreat-worthy primary suite. The primary suite boasts tray ceilings, custom automatic blinds, soundproof walls, and a private entrance to the lanai. The spa-like bathroom with multiple shower heads (including rain shower head), and customized closets, equipped with security center and clothes steamer, add to the luxury of the space. The chef’s kitchen boasts plenty of counter space, cabinetry, a large farm sink, a pot filler, wine refrigerator, a butler's pantry with a vegetable sink and an additional full-sized refrigerator. Reminding us that the kitchen is the heart of the home the cafe-style seating creates an inviting atmosphere for casual dining or board games. The laundry area is thoughtfully designed with a sink, cabinetry, and a mud room for keeping shoes and backpacks out of sight. Massive 4-panel sliding glass doors pocket completely behind the living room wall, bringing the outdoors in, and doubling the entertainment space. A safe room maximizes your security and is available to view during your private showing. Upstairs, a private loft seating area, game center or billiards area, home theater, home office or gym, four generously sized bedrooms with walk-in closets (double built-in closets in bedroom 5), two study areas with built-in desks and two full bathrooms, and an additional laundry center offer ample space for living and entertaining. Impressive movie theater with tiered seating, built-in speakers and lighting bring movie nights to a whole new level. The lanai overlooks the salt-water pool, spa and the private pond and features automatic screens on both the sliding door and the back of the lanai. Additional amenities include an outdoor kitchen with grill, refrigerator, ice maker, and sink. A livestock pen equipped with electricity and water sits behind a separate fence. It can be easily converted to a one-stall horse barn with turn-out and pasture. Additional structures include a storage shed with electricity and smaller shed for lawn equipment. With plenty of room for more storage, parking, and even a separate guest home, this property offers a perfect blend of luxury and functionality. Situated perfectly in between Orlando International Airport and Port Canaveral, this Golf and Equestrian Community offers parks, trails, an 18-hole golf course, sidewalks, and an A-rated school! Don't miss out on the opportunity to make this gem your new home sweet home!
Build Your Team
Quickly find investor-friendly professionals who can help you succeed in real estate investing at any stage of the investing journey.


Agents
Match with investor-friendly agents who can help you find, analyze, and close your next deal


Lenders
Get the best funding…find investor-friendly lenders who specialize in your deal strategy


Property Managers
Transition to passive investing. Find a trusted property management partnership that lasts.


Tax Pros & Accountants
Taxes and financial reporting made easy—find experts to create tax savings strategies, file taxes, and more
Location
Property Details
Parking
- Description: Garage
- Details: Attached
- Garage Spaces: 2
- Spaces Total: 0
Bedroom Information
- # of Bedrooms: 6
Bathroom Information
- # of Baths (Full): 4
- # of Baths (Partial): 1
- # of Baths (Total): 5.0
Interior Features
- # of Rooms: 15
- # of Stories: 2
Exterior Features
- Exterior Walls Materials: Stucco
- Foundation: Slab
- Roof Type: Gable or Hip
- Roof Material: Shingle
- Pool: Yes
Land Information
- Land Use: Residential
- Land Use Subtype: Single Family Residential
Lot Information
- Parcel ID: 132332760000811
- Lot Size: 101494 sqft
Property Information
- Property Type: Single Family Residence
- Year Built: 2019
Tax Information
- Annual Tax: $8,965
Utilities
- Water & Sewer: Private, Well
- Heating: Central
- Cooling: Central Air
Location
- County: Orange
Listing Details
Investment Summary
- Monthly Cash Flow
- -$4,403
- Cap Rate
- 3.4%
- Cash-on-Cash Return
- -12.1%
- Debt Coverage Ratio
- 0.55
- Internal Rate of Return (5 years)
- -7.7%
Cash Flow
Net Operating Income (NOI) minus mortgage payments.
Calculation:
NOI - Mortgage Payments
Cap Rate (Market Value)
Capitalization Rate is a rate of return that compares the yearly Net Operating Income (NOI) to the market value.
Calculation:
NOI / Market Value
Cash-on-Cash Return (CoC)
Annual Cash Flow / Cash Invested
Calculation:
Annual cash flow divided by initial cash invested.
Debt Coverage Ratio (DCR)
Net Operating Income (NOI) divided by total debt payments.
Calculation:
NOI / Total Debt Payments
Internal Rate of Return (IRR)
A metric for assessing profitability over time. IRR is the discount rate at which the net present value (NPV) of all future cash flows (positive and negative) from an investment equals zero — including both periodic cash flow (such as rent) and a projected sale at the end of the holding period. It represents the expected annualized return, accounting for income, expenses, and the recovery of capital through a future sale.
Purchase Details
Purchase PriceThe price paid for the property. Purchase price:
| $1,898,999 |
|---|---|
Amount FinancedThe amount of the purchase financed through a loan. Amount financed:
| -$1,519,199 |
Down paymentThe initial payment made towards the purchase. Down payment:
| $379,800 |
Closing CostsFees and expenses associated with purchasing a property, typically ranging from 2% to 5% of the home’s purchase price, paid at the end of a home purchase to cover services like lending, title transfer, and taxes. Closing costs:
| $56,970 |
Rehab CostsCosts incurred to repair or improve the property, including: roof, flooring, exterior siding, kitchen, exterior paint, bathrooms, etc. Rehab costs:
| $0 |
Initial Cash InvestedThe total initial cash invested in the property. Calculation:Down payment + Buying costs + Rehab costs Initial cash invested:
| $436,770 |
Square Feet (SQFT)The total square footage of the property. Square feet:
| 5,187 |
Cost Per Square FootCost per square foot of the property. Calculation:Purchase Price / Square Feet Cost per square foot:
| $366 |
Monthly Rent Per Square FootMonthly rent divided by the number of square feet. This ratio helps investors compare rental income efficiency across properties, markets, and unit sizes Calculation:Monthly Rent / Square Feet Monthly rent per square foot:
| $1.70 |
Financing Details
Loan AmountThe total sum of money borrowed from a lender to finance a property purchase. Calculation:Purchase Price - Down Payment
Loan amount:
| $1,519,199 |
|---|---|
Loan to Value Ratio (LTV)Loan amount divided by the market value of the property. Calculation:Loan Amount / Market Value
Loan to value ratio:
| 80.0% |
Loan TypeThe type of loan (e.g., fixed, adjustable).
Loan type:
| Amortizing |
TermThe loan repayment period in years.
Term:
| 30 years |
Interest RateThe percentage a lender charges on the borrowed amount of a loan, determining the cost of borrowing money.
Interest rate:
| 6.625% |
Principal & Interest (PI)The principal is the portion of the loan payment that reduces the loan balance. The interest is the lender's charge for borrowing money. Calculation:(P * r * (1 + r) ** n) / ((1 + r) ** n - 1) Where:
P = Loan amount (principal)
Principal & interest:
| $9,728 |
Property TaxesAnnual taxes levied by local governments on real estate properties. These taxes fund public services like schools, roads, and emergency services.
Property tax:
| $747 |
InsuranceThe costs for insurance coverage to protect against financial losses due to risks like fire, natural disasters, theft, liability, or tenant-related damages. Calculation:Assumes 7% of gross rental income, unless insurance rates are specified.
Insurance:
| $616 |
Private Mortgage Insurance (PMI)A fee that borrowers pay when they take out a conventional loan with a loan-to-value (LTV) ratio above 80%.
Private mortgage insurance (PMI):
| $0 |
Monthly PaymentThe fixed amount a borrower pays each month to repay a loan. It typically includes principal and interest (P&I) and may also cover property taxes, insurance, HOA fees, and PMI if escrowed. Monthly payment:
| $11,091 |
Operating Income
| % Rent | Monthly | Yearly | |
|---|---|---|---|
Gross RentThe total rental income received from tenants before deducting any expenses. Includes base rent, late fees, pet fees, parking fees, and other recurring charges.
Gross rent:
| $8,800 | $105,600 | |
Vacancy LossExpected loss of rent due to vacancies.
Vacancy loss:
(6%)
| 6% | -$528 | -$6,336 |
Operating IncomeGross rental income minus vacancy loss. Calculation:Gross rent - Vacancy loss
Operating income:
| $8,272 | $99,264 |
Operating Expenses
| % Rent | Monthly | Yearly | |
|---|---|---|---|
Property TaxesAnnual taxes levied by local governments on real estate properties. These taxes fund public services like schools, roads, and emergency services. | 8% | -$747 | -$8,965 |
InsuranceThe costs for insurance coverage to protect against financial losses due to risks like fire, natural disasters, theft, liability, or tenant-related damages. Calculation:Assumes 7% of gross rental income, unless insurance rates are specified. | 7% | -$616 | -$7,392 |
Property ManagementThe costs associated with hiring a property manager to handle the day-to-day operations of a rental property. Includes management fees, leasing fes, eviction fees, etc. Calculation:Assumes 8% of gross rental income. | 8% | -$704 | -$8,448 |
Repairs & MaintenanceOngoing costs for routine upkeep and minor fixes needed to keep a property in good working condition. Calculation:Assumes 5% of gross rental income. Varies by property age and condition. | 5% | -$440 | -$5,280 |
Capital ExpensesLarge, infrequent costs for major improvements or replacements, like a new roof, HVAC system, or appliances. Calculation:Assumes 5% of gross rental income. Varies by property age. | 5% | -$440 | -$5,280 |
HOA FeesRegular dues paid to a Homeowners Association for community maintenance, amenities, and management. Similar fees include: Condo Association Fees, Co-op Maintenance Fees, etc. | n/a | n/a | n/a |
Operating ExpensesRecurring costs required to maintain and manage a rental property, including property taxes, insurance, maintenance, repairs, utilities (if paid by the owner), property management fees, and other day-to-day expenses. Calculation:Insurance + Property Taxes + Property Management + Repairs & Maintenance + Capital Expenditures + HOA Fees | 33% | -$2,947 | -$35,365 |
Cash Flow
| Monthly | Yearly | |
|---|---|---|
Net Operating Income (NOI)The income generated from a property after deducting all operating expenses but before deducting mortgage payments, taxes, and capital expenditures. Calculation:Gross Operating Income - Operating Expenses
Net operating income:
| $5,325 | $63,900 |
Mortgage PaymentThe fixed amount a borrower pays each month to repay a loan. It typically includes principal and interest (P&I) and may also cover property taxes, insurance, HOA fees, and PMI if escrowed. | -$9,728 | -$116,736 |
Cash FlowNet Operating Income (NOI) minus mortgage payments. Calculation:NOI - Mortgage Payments | $4,403 | $52,836 |