$4,290,000
Investment Summary
- Monthly Cash Flow
- -$21,044
- Cap Rate
- 0.3%
- Cash-on-Cash Return
- -25.6%
- Debt Coverage Ratio
- 0.04
- Internal Rate of Return (5 years)
- -20.7%
Cash Flow
Net Operating Income (NOI) minus mortgage payments.
Calculation:
NOI - Mortgage Payments
Cap Rate (Market Value)
Capitalization Rate is a rate of return that compares the yearly Net Operating Income (NOI) to the market value.
Calculation:
NOI / Market Value
Cash-on-Cash Return (CoC)
Annual Cash Flow / Cash Invested
Calculation:
Annual cash flow divided by initial cash invested.
Debt Coverage Ratio (DCR)
Net Operating Income (NOI) divided by total debt payments.
Calculation:
NOI / Total Debt Payments
Internal Rate of Return (IRR)
A metric for assessing profitability over time. IRR is the discount rate at which the net present value (NPV) of all future cash flows (positive and negative) from an investment equals zero — including both periodic cash flow (such as rent) and a projected sale at the end of the holding period. It represents the expected annualized return, accounting for income, expenses, and the recovery of capital through a future sale.
Property Description
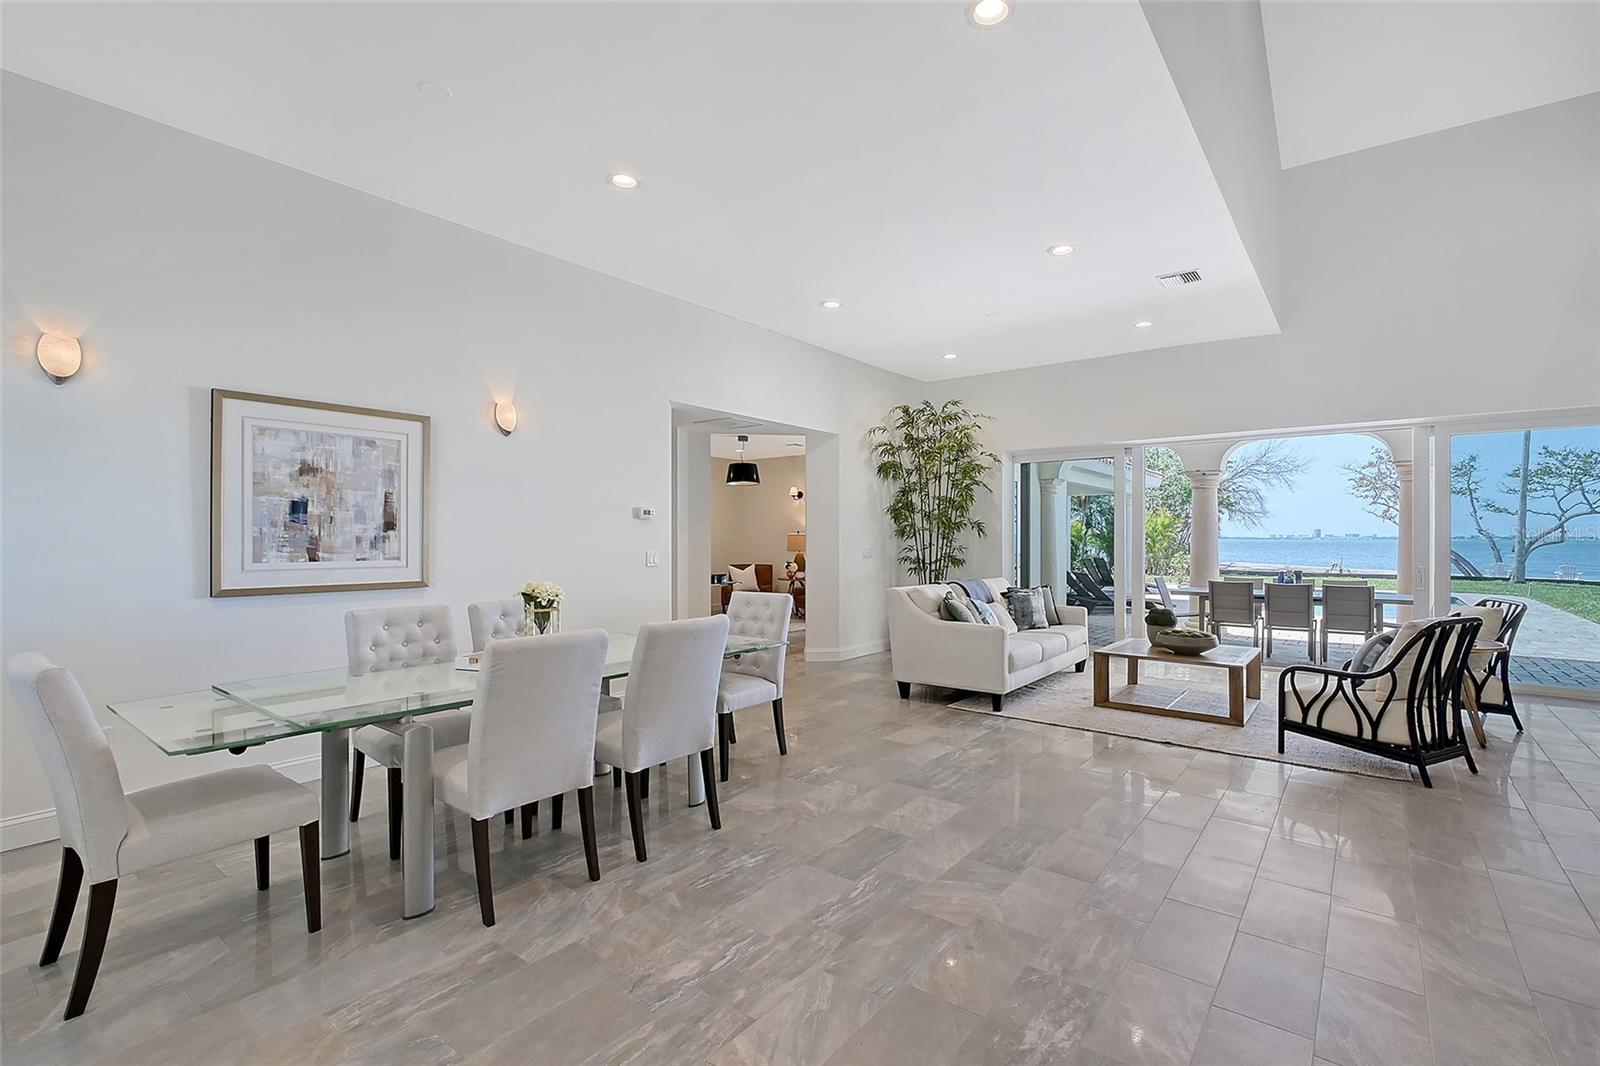
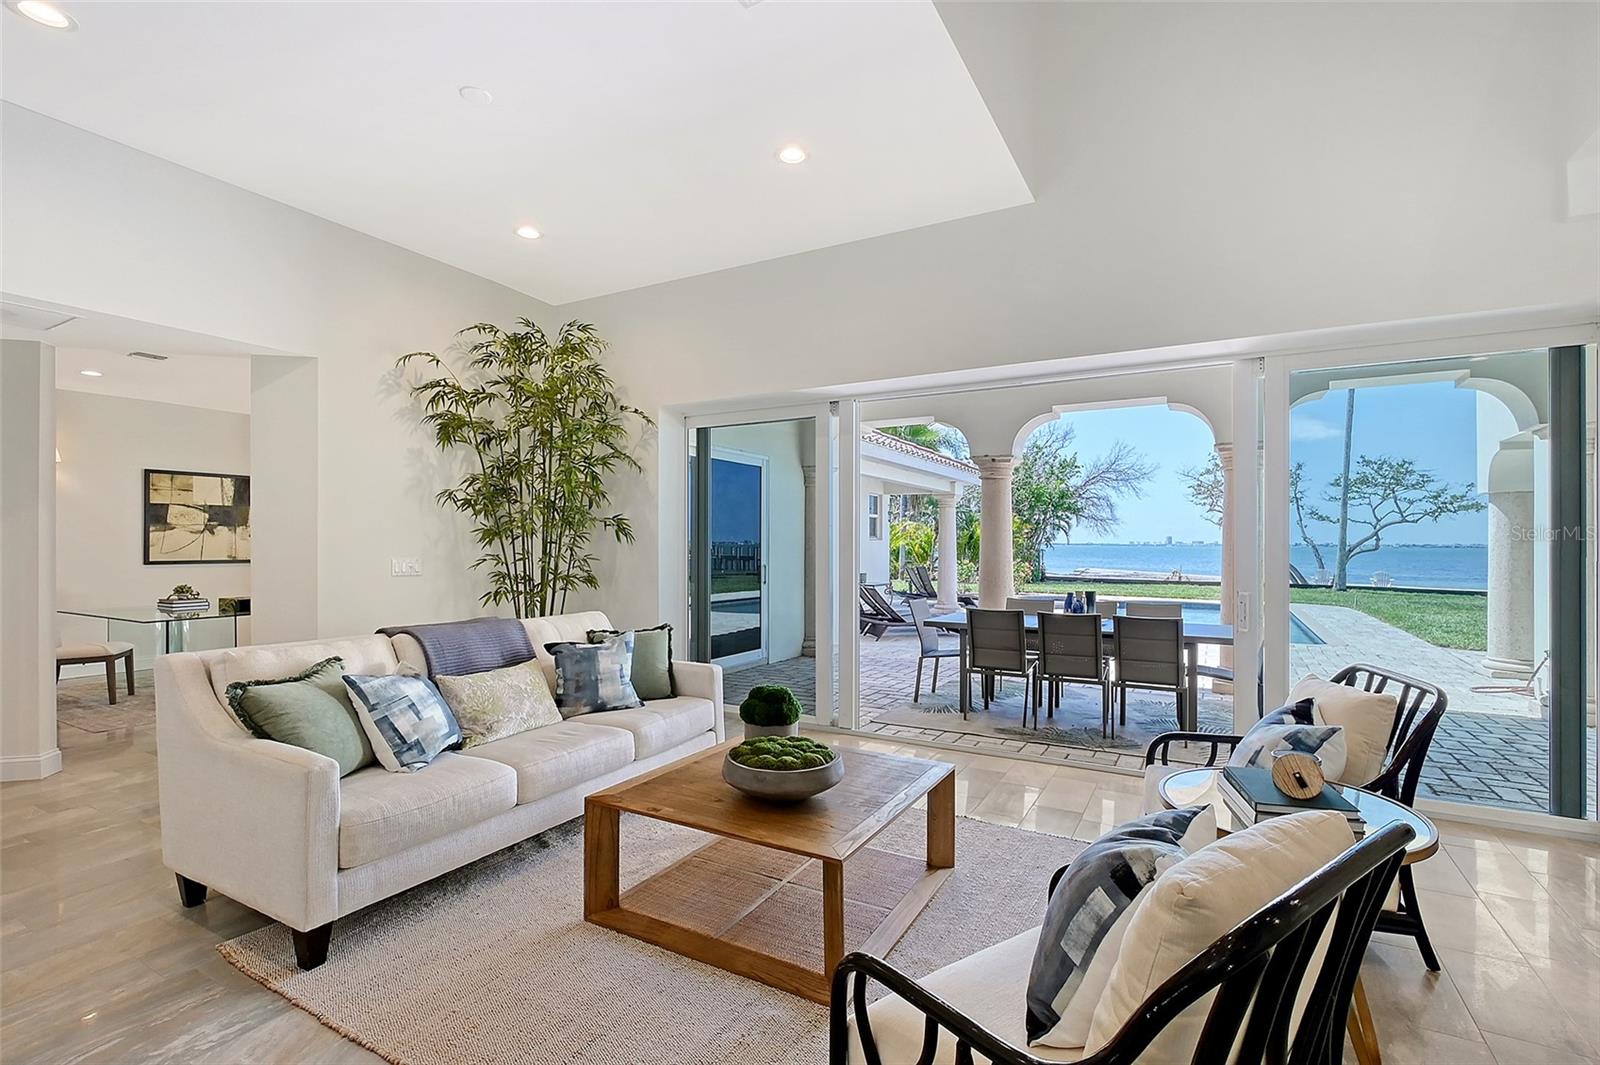
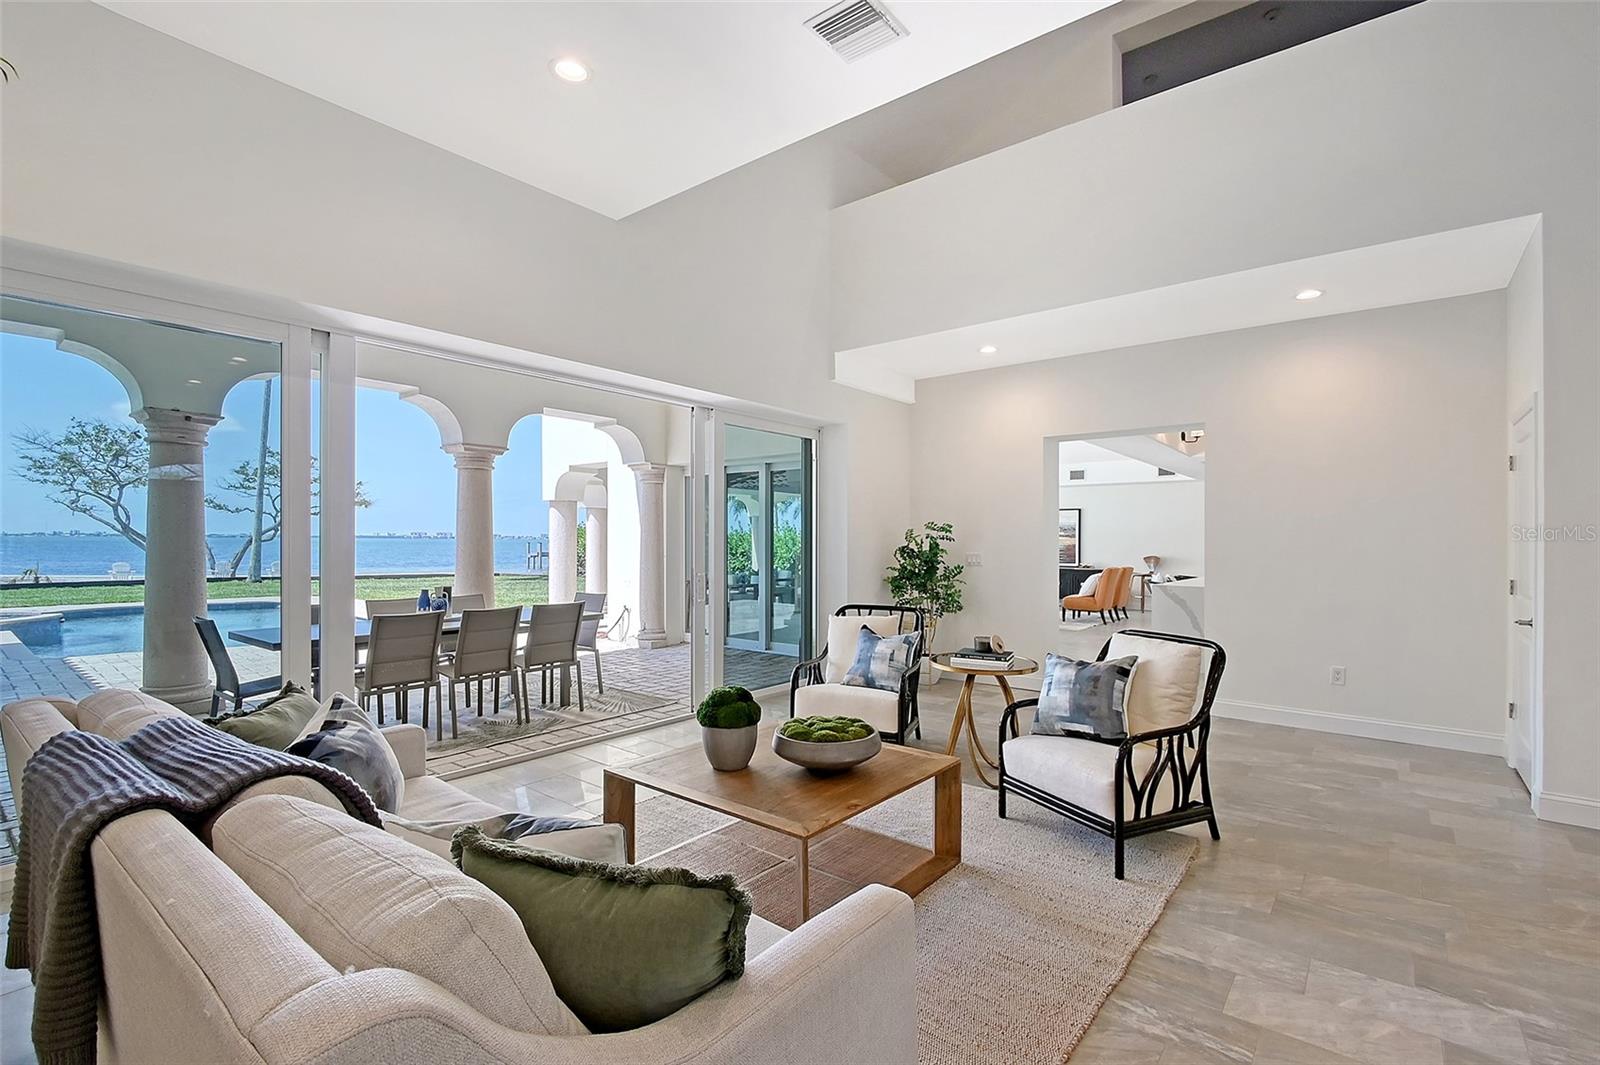
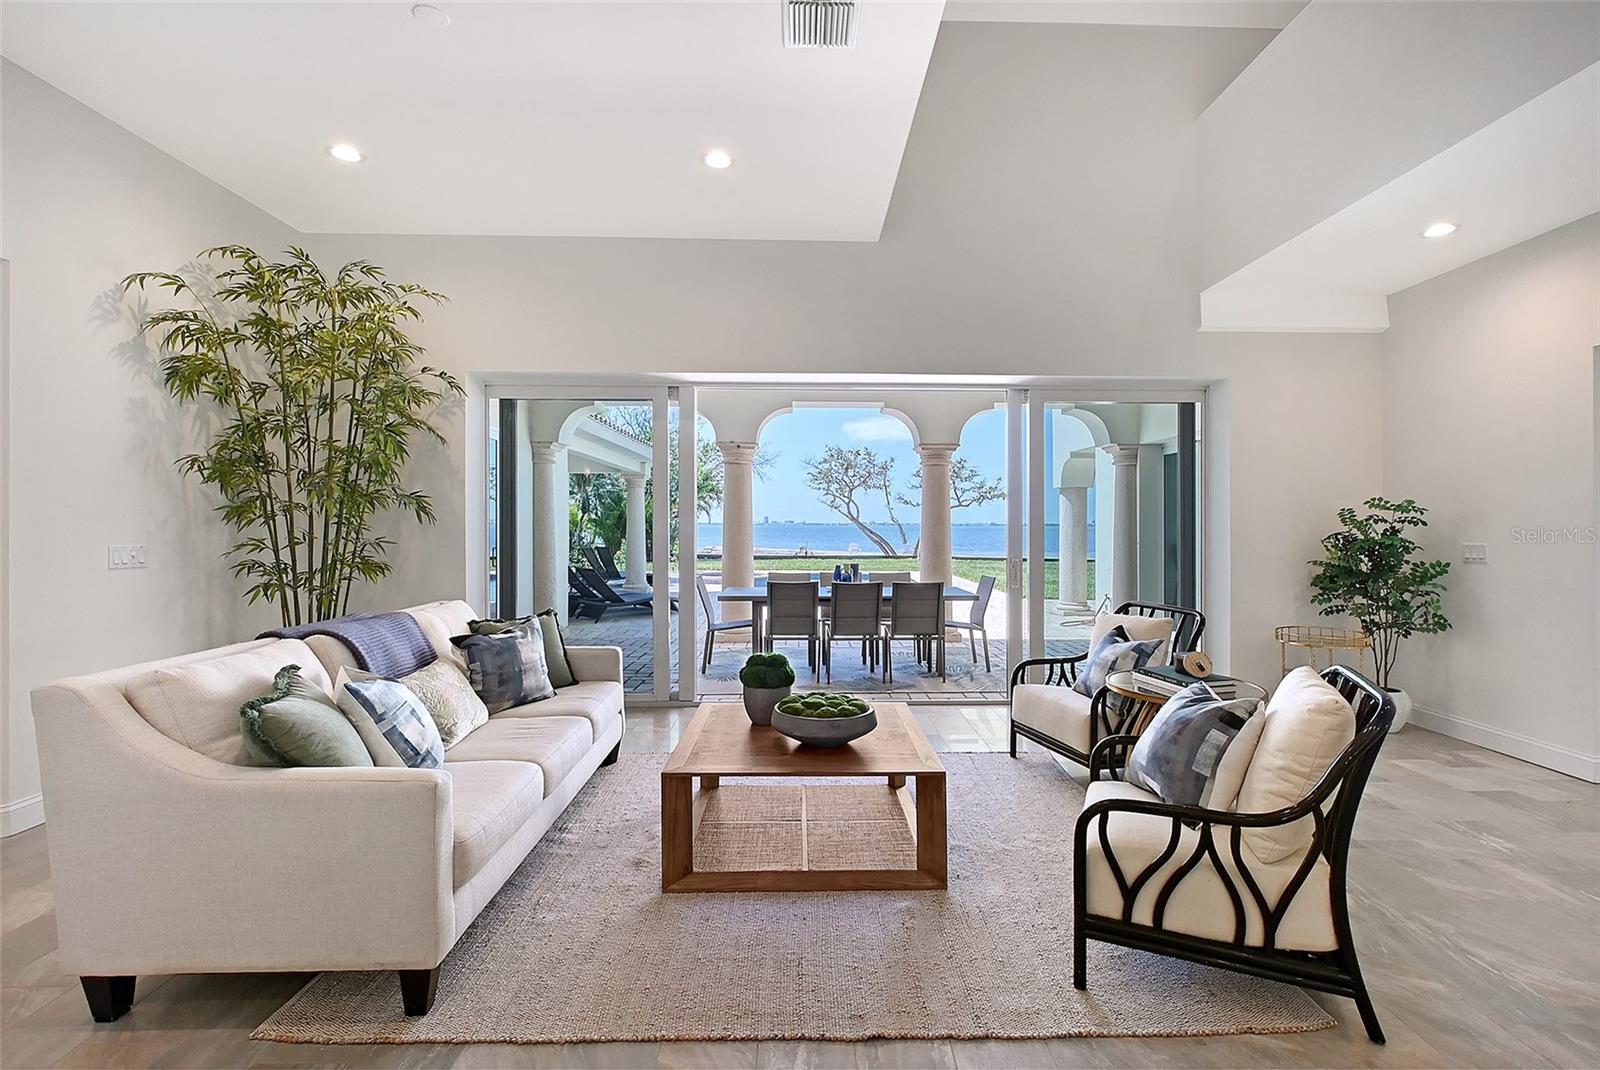
Owner has priced to sell. Discover the pinnacle of waterfront luxury at this stunning 5-bedroom, 6.5-bathroom residence in Sapphire Shores in the desirable Museum Area, boasting 150 feet of direct Sarasota Bay frontage and a private beach lounge area. Prepare to be captivated by breathtaking vistas of the downtown Sarasota skyline, Ringling Bridge, Longboat Key, and expansive bay views, perfectly framed by Florida’s enchanting sunsets. All of this is offered at exceptional value. Recently remodeled and impeccably updated to the highest standards, this 5270-square foot home offers a seamless blend of elegance and modern comfort. The heart of the home is a tastefully designed family room with walls of glass overlooking the azure bay, and a spectacular kitchen featuring custom high-end floor-to-ceiling gloss cabinetry, built-in wine bar, an immense Cambria quartz island, and upgraded new stainless appliances, all set to inspire your culinary adventures. The luxurious appeal continues with two primary suites, soaring 19-foot ceilings in the living area, and large inviting rooms that maintain an airy and open ambiance. Impact windows and doors throughout ensure peace of mind and a quiet indoor environment. For those who value privacy there are multiple additional spaces to retire to, including a study/den/flex room as an anteroom to the ground-floor primary suite, a room perfect for a library, the amazing upstairs owners suite with fabulous modern bathroom design and stunning water views from the overly-generous balcony, two upstairs guest suites with two ensuite offices, and a possible sixth bedroom which would be ideal as a media room or playroom. And for those who like to entertain, this home is a true gem, seamlessly integrating indoor and outdoor spaces for gatherings that flow effortlessly. Lush new landscaping and verdant lawn surround the property, creating an oasis of privacy and greenery, while a large new seawall with kayak and paddleboard launch stands guard over your serene waterfront retreat. Whether it’s hosting lavish parties poolside or enjoying quiet evenings by the bay with a large family, this home is an unparalleled sanctuary tailored for the most discerning tastes. Dive into the cultural vibrancy of Sarasota with proximity to landmarks like the Ringling Museum of Art, New College, the Asolo Repertory Theatre, downtown Sarasota, and close to world-renowned St. Armand's Circle & Lido beach. Each day promises new explorations and spectacular Florida sunsets, making every moment at this residence a well-scripted part of your new extraordinary lifestyle. Please view the captivating LIVE VIDEO IN TOUR LINK 1.
Build Your Team
Quickly find investor-friendly professionals who can help you succeed in real estate investing at any stage of the investing journey.


Agents
Match with investor-friendly agents who can help you find, analyze, and close your next deal


Lenders
Get the best funding…find investor-friendly lenders who specialize in your deal strategy


Property Managers
Transition to passive investing. Find a trusted property management partnership that lasts.


Tax Pros & Accountants
Taxes and financial reporting made easy—find experts to create tax savings strategies, file taxes, and more
Location
Property Details
Parking
- Description: Attached Garage
- Details: Circular Driveway, Covered, Driveway, Garage Door Opener, Guest, Off Street, On Street, Oversized, Attached
- Garage Spaces: 3
- Spaces Total: 0
Bedroom Information
- # of Bedrooms: 5
Bathroom Information
- # of Baths (Full): 6
- # of Baths (Partial): 1
- # of Baths (Total): 7.0
Interior Features
- # of Rooms: 13
- # of Stories: 2
Exterior Features
- Exterior Walls Materials: Stucco
- Foundation: Slab
- Roof Type: Hip
- Roof Material: Tile
- Pool: Yes
Land Information
- Land Use: Residential
- Land Use Subtype: Single Family Residential
Lot Information
- Parcel ID: 2003160001
- Lot Size: 20843 sqft
Property Information
- Property Type: Single Family Residence
- Style: Contemporary, Custom, Florida, Mediterranean, Traditional
- Year Built: 2012
Tax Information
- Annual Tax: $55,065
Utilities
- Water & Sewer: Private, Public, Well
- Heating: Central, Electric, Zoned
- Cooling: Central Air, Zoned
Location
- County: Sarasota
Listing Details
Investment Summary
- Monthly Cash Flow
- -$21,044
- Cap Rate
- 0.3%
- Cash-on-Cash Return
- -25.6%
- Debt Coverage Ratio
- 0.04
- Internal Rate of Return (5 years)
- -20.7%
Cash Flow
Net Operating Income (NOI) minus mortgage payments.
Calculation:
NOI - Mortgage Payments
Cap Rate (Market Value)
Capitalization Rate is a rate of return that compares the yearly Net Operating Income (NOI) to the market value.
Calculation:
NOI / Market Value
Cash-on-Cash Return (CoC)
Annual Cash Flow / Cash Invested
Calculation:
Annual cash flow divided by initial cash invested.
Debt Coverage Ratio (DCR)
Net Operating Income (NOI) divided by total debt payments.
Calculation:
NOI / Total Debt Payments
Internal Rate of Return (IRR)
A metric for assessing profitability over time. IRR is the discount rate at which the net present value (NPV) of all future cash flows (positive and negative) from an investment equals zero — including both periodic cash flow (such as rent) and a projected sale at the end of the holding period. It represents the expected annualized return, accounting for income, expenses, and the recovery of capital through a future sale.
Purchase Details
Purchase PriceThe price paid for the property. Purchase price:
| $4,290,000 |
|---|---|
Amount FinancedThe amount of the purchase financed through a loan. Amount financed:
| -$3,432,000 |
Down paymentThe initial payment made towards the purchase. Down payment:
| $858,000 |
Closing CostsFees and expenses associated with purchasing a property, typically ranging from 2% to 5% of the home’s purchase price, paid at the end of a home purchase to cover services like lending, title transfer, and taxes. Closing costs:
| $128,700 |
Rehab CostsCosts incurred to repair or improve the property, including: roof, flooring, exterior siding, kitchen, exterior paint, bathrooms, etc. Rehab costs:
| $0 |
Initial Cash InvestedThe total initial cash invested in the property. Calculation:Down payment + Buying costs + Rehab costs Initial cash invested:
| $986,700 |
Square Feet (SQFT)The total square footage of the property. Square feet:
| 5,270 |
Cost Per Square FootCost per square foot of the property. Calculation:Purchase Price / Square Feet Cost per square foot:
| $814 |
Monthly Rent Per Square FootMonthly rent divided by the number of square feet. This ratio helps investors compare rental income efficiency across properties, markets, and unit sizes Calculation:Monthly Rent / Square Feet Monthly rent per square foot:
| $1.52 |
Financing Details
Loan AmountThe total sum of money borrowed from a lender to finance a property purchase. Calculation:Purchase Price - Down Payment
Loan amount:
| $3,432,000 |
|---|---|
Loan to Value Ratio (LTV)Loan amount divided by the market value of the property. Calculation:Loan Amount / Market Value
Loan to value ratio:
| 80.0% |
Loan TypeThe type of loan (e.g., fixed, adjustable).
Loan type:
| Amortizing |
TermThe loan repayment period in years.
Term:
| 30 years |
Interest RateThe percentage a lender charges on the borrowed amount of a loan, determining the cost of borrowing money.
Interest rate:
| 6.625% |
Principal & Interest (PI)The principal is the portion of the loan payment that reduces the loan balance. The interest is the lender's charge for borrowing money. Calculation:(P * r * (1 + r) ** n) / ((1 + r) ** n - 1) Where:
P = Loan amount (principal)
Principal & interest:
| $21,975 |
Property TaxesAnnual taxes levied by local governments on real estate properties. These taxes fund public services like schools, roads, and emergency services.
Property tax:
| $4,589 |
InsuranceThe costs for insurance coverage to protect against financial losses due to risks like fire, natural disasters, theft, liability, or tenant-related damages. Calculation:Assumes 7% of gross rental income, unless insurance rates are specified.
Insurance:
| $560 |
Private Mortgage Insurance (PMI)A fee that borrowers pay when they take out a conventional loan with a loan-to-value (LTV) ratio above 80%.
Private mortgage insurance (PMI):
| $0 |
Monthly PaymentThe fixed amount a borrower pays each month to repay a loan. It typically includes principal and interest (P&I) and may also cover property taxes, insurance, HOA fees, and PMI if escrowed. Monthly payment:
| $27,124 |
Operating Income
| % Rent | Monthly | Yearly | |
|---|---|---|---|
Gross RentThe total rental income received from tenants before deducting any expenses. Includes base rent, late fees, pet fees, parking fees, and other recurring charges.
Gross rent:
| $8,000 | $96,000 | |
Vacancy LossExpected loss of rent due to vacancies.
Vacancy loss:
(6%)
| 6% | -$480 | -$5,760 |
Operating IncomeGross rental income minus vacancy loss. Calculation:Gross rent - Vacancy loss
Operating income:
| $7,520 | $90,240 |
Operating Expenses
| % Rent | Monthly | Yearly | |
|---|---|---|---|
Property TaxesAnnual taxes levied by local governments on real estate properties. These taxes fund public services like schools, roads, and emergency services. | 57% | -$4,589 | -$55,065 |
InsuranceThe costs for insurance coverage to protect against financial losses due to risks like fire, natural disasters, theft, liability, or tenant-related damages. Calculation:Assumes 7% of gross rental income, unless insurance rates are specified. | 7% | -$560 | -$6,720 |
Property ManagementThe costs associated with hiring a property manager to handle the day-to-day operations of a rental property. Includes management fees, leasing fes, eviction fees, etc. Calculation:Assumes 8% of gross rental income. | 8% | -$640 | -$7,680 |
Repairs & MaintenanceOngoing costs for routine upkeep and minor fixes needed to keep a property in good working condition. Calculation:Assumes 5% of gross rental income. Varies by property age and condition. | 5% | -$400 | -$4,800 |
Capital ExpensesLarge, infrequent costs for major improvements or replacements, like a new roof, HVAC system, or appliances. Calculation:Assumes 5% of gross rental income. Varies by property age. | 5% | -$400 | -$4,800 |
HOA FeesRegular dues paid to a Homeowners Association for community maintenance, amenities, and management. Similar fees include: Condo Association Fees, Co-op Maintenance Fees, etc. | n/a | n/a | n/a |
Operating ExpensesRecurring costs required to maintain and manage a rental property, including property taxes, insurance, maintenance, repairs, utilities (if paid by the owner), property management fees, and other day-to-day expenses. Calculation:Insurance + Property Taxes + Property Management + Repairs & Maintenance + Capital Expenditures + HOA Fees | 82% | -$6,589 | -$79,065 |
Cash Flow
| Monthly | Yearly | |
|---|---|---|
Net Operating Income (NOI)The income generated from a property after deducting all operating expenses but before deducting mortgage payments, taxes, and capital expenditures. Calculation:Gross Operating Income - Operating Expenses
Net operating income:
| $931 | $11,172 |
Mortgage PaymentThe fixed amount a borrower pays each month to repay a loan. It typically includes principal and interest (P&I) and may also cover property taxes, insurance, HOA fees, and PMI if escrowed. | -$21,975 | -$263,700 |
Cash FlowNet Operating Income (NOI) minus mortgage payments. Calculation:NOI - Mortgage Payments | $21,044 | $252,528 |