$589,000
Investment Summary
- Monthly Cash Flow
- -$1,360
- Cap Rate
- 3.4%
- Cash-on-Cash Return
- -12.0%
- Debt Coverage Ratio
- 0.55
- Internal Rate of Return (5 years)
- -7.7%
Cash Flow
Net Operating Income (NOI) minus mortgage payments.
Calculation:
NOI - Mortgage Payments
Cap Rate (Market Value)
Capitalization Rate is a rate of return that compares the yearly Net Operating Income (NOI) to the market value.
Calculation:
NOI / Market Value
Cash-on-Cash Return (CoC)
Annual Cash Flow / Cash Invested
Calculation:
Annual cash flow divided by initial cash invested.
Debt Coverage Ratio (DCR)
Net Operating Income (NOI) divided by total debt payments.
Calculation:
NOI / Total Debt Payments
Internal Rate of Return (IRR)
A metric for assessing profitability over time. IRR is the discount rate at which the net present value (NPV) of all future cash flows (positive and negative) from an investment equals zero — including both periodic cash flow (such as rent) and a projected sale at the end of the holding period. It represents the expected annualized return, accounting for income, expenses, and the recovery of capital through a future sale.
Property Description
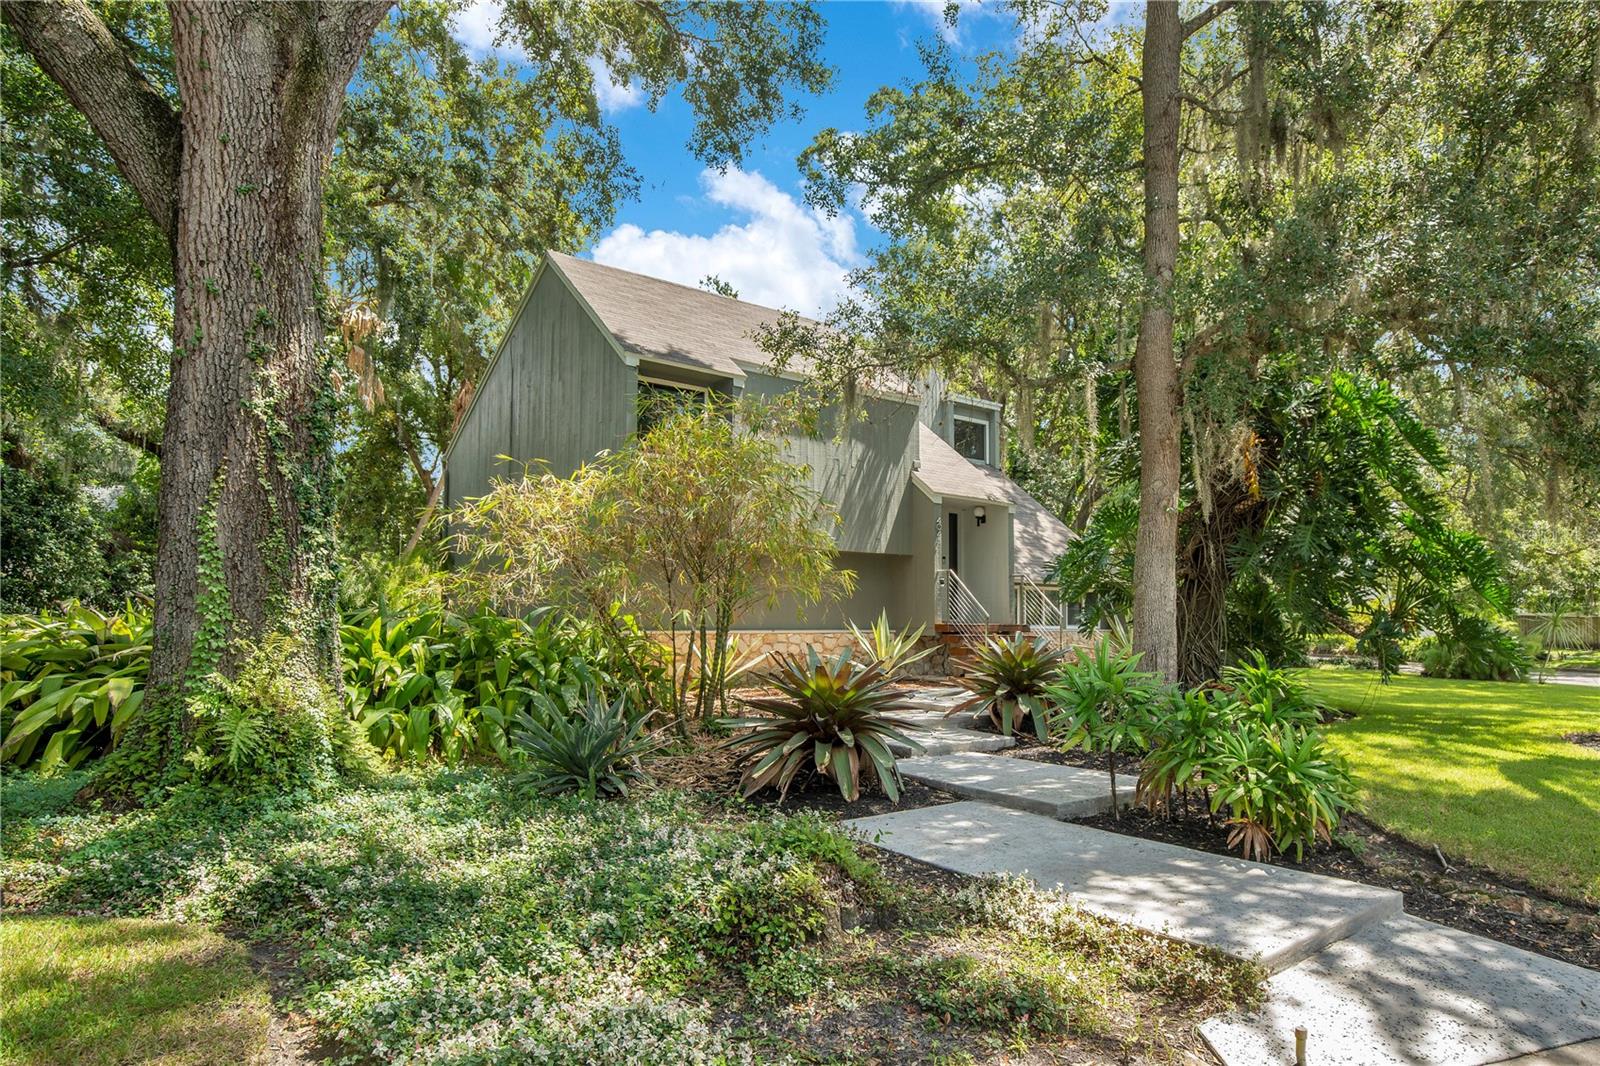
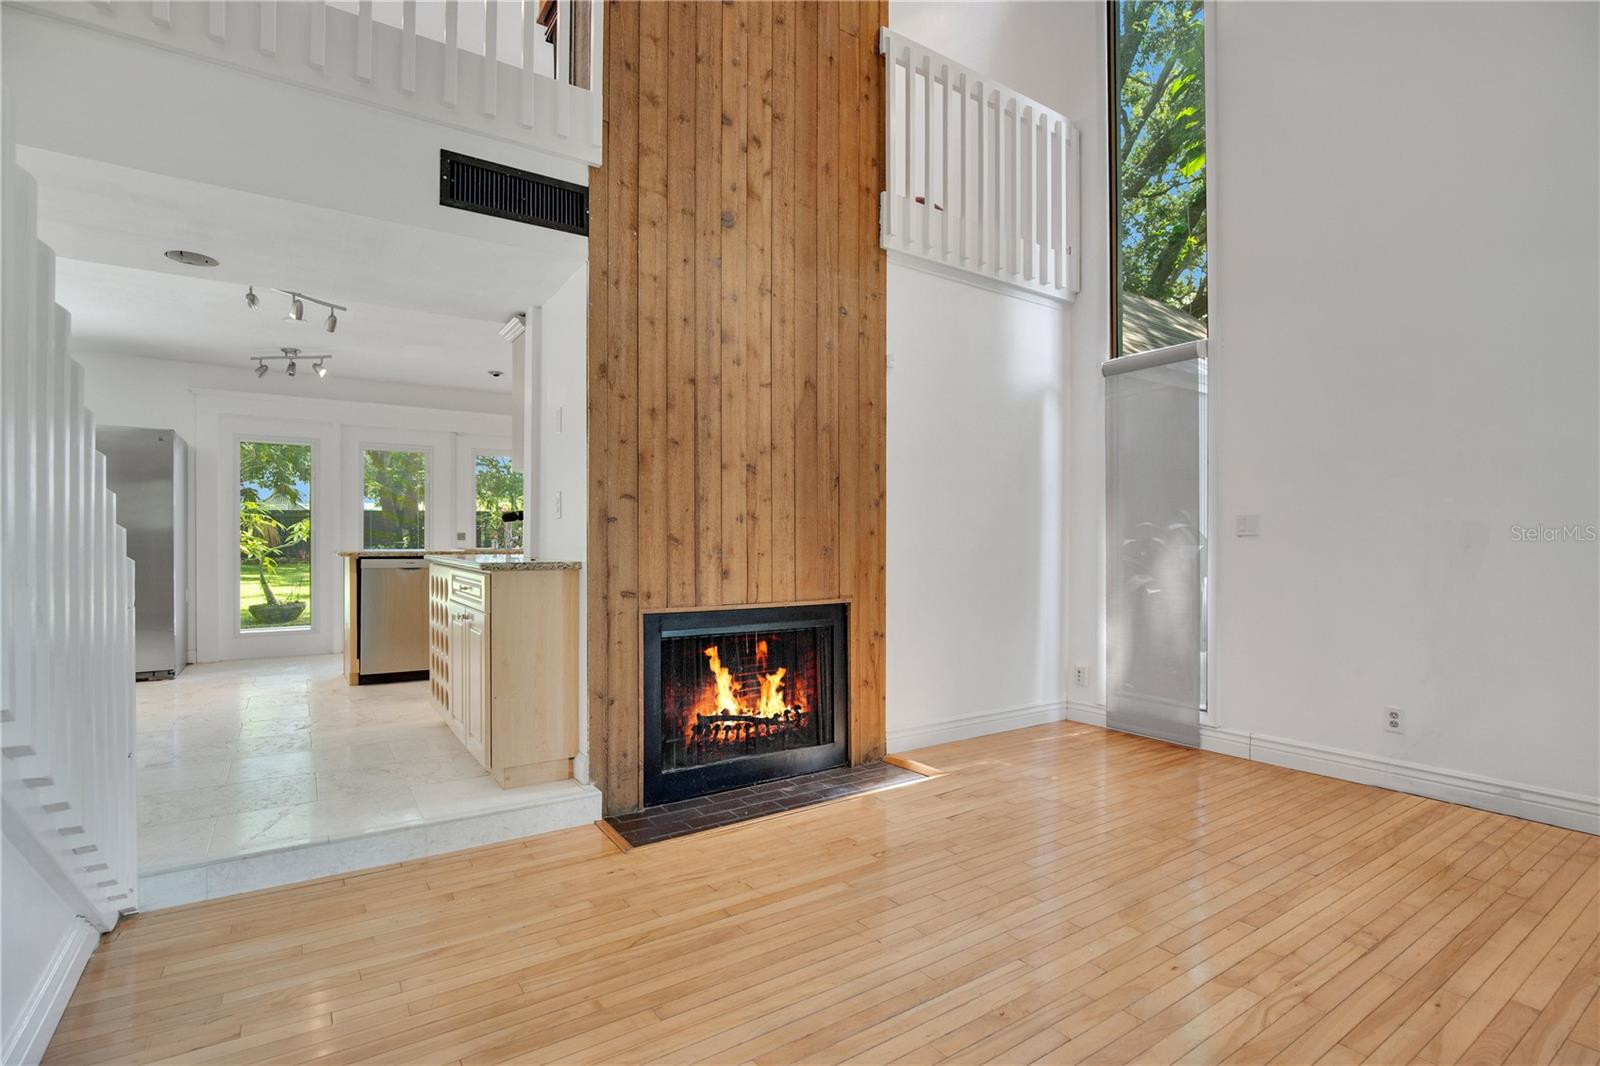
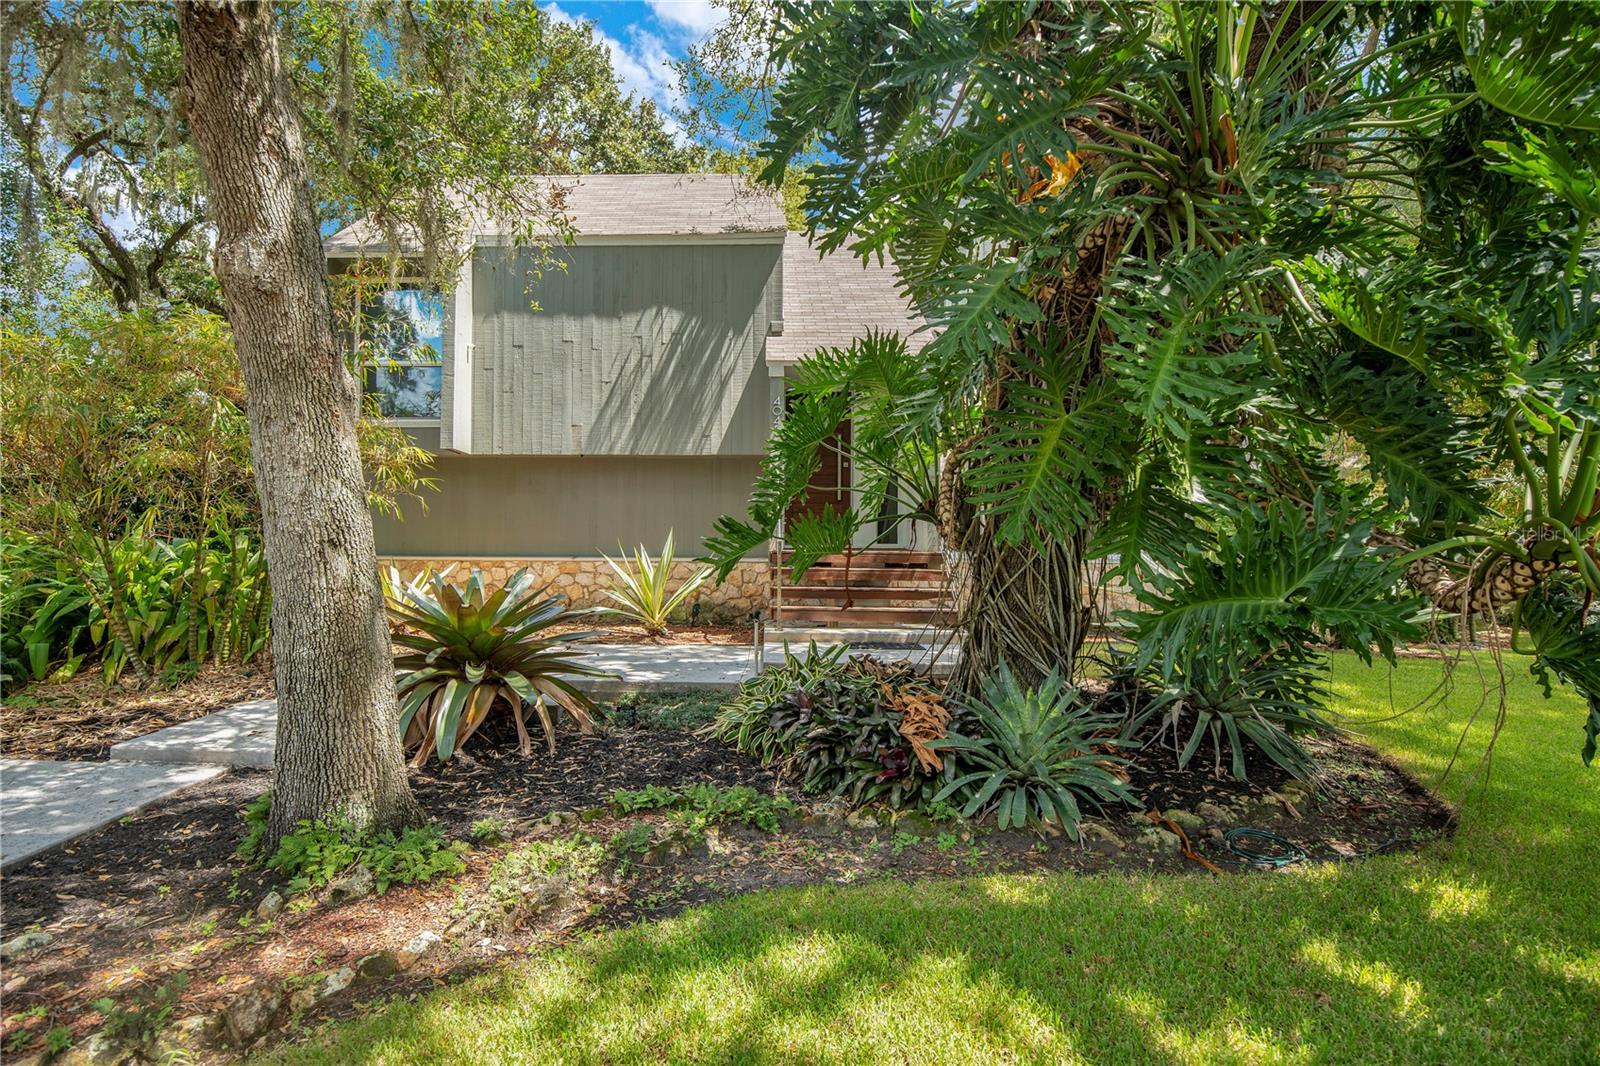
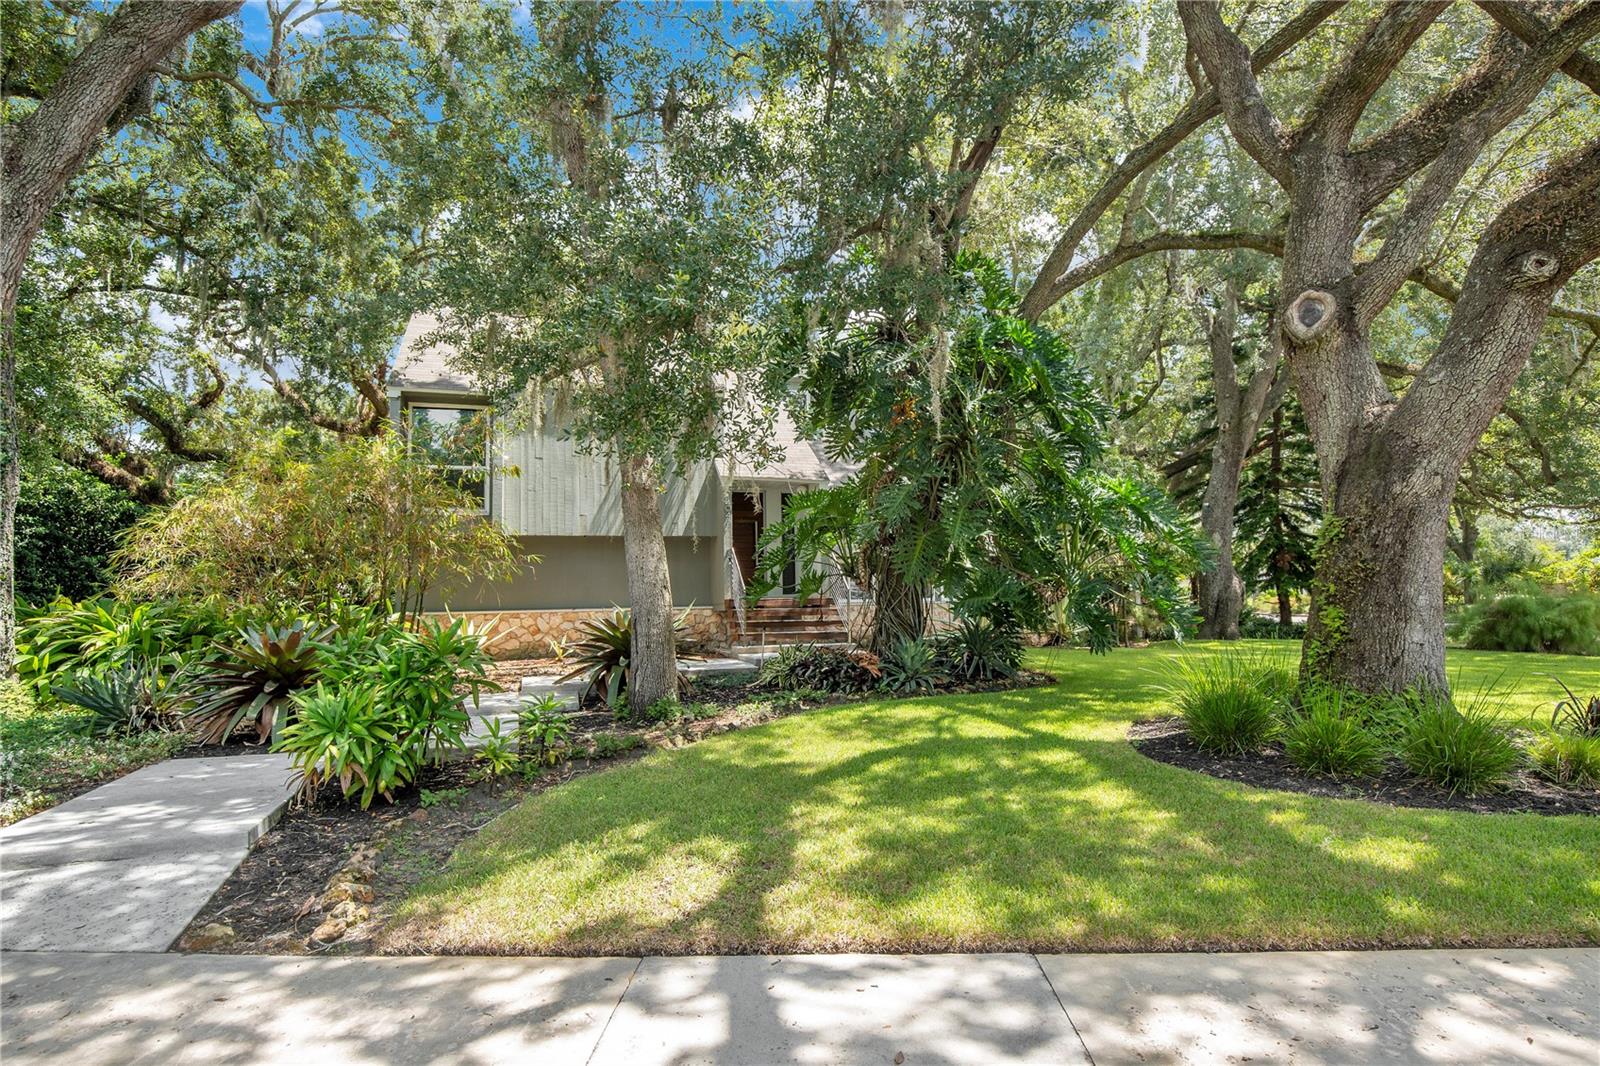
Under contract-accepting backup offers. Shaded beneath centuries-old live oaks and framed by custom tropical landscaping, this corner lot home makes an immediate impression. The approach is refined but welcoming, with architectural details like stainless steel railings, a custom ipe wood front door, and a matching entry stair and landing that set the tone for what’s inside. Step into the marble-floored foyer and the house opens in dramatic fashion: floor-to-ceiling windows flood the living and dining areas with natural light, while a soaring, cedar clad fireplace anchors the main gathering space. The flow is effortless: the dining room sits at the center, and the kitchen opens alongside it so no one’s cut off from the conversation. Marble carries through the kitchen and dining, keeping everything clean, cool, and cohesive. The main level also gives you the kind of layout that actually works day-to-day, offering both convenience and privacy; a true first-floor bedroom suite with an oversized walk-in closet and large private bath, and direct access to the backyard terrace—so mornings can start, and evenings can end, with an easy step outside. A powder bath and dedicated laundry nearby. Upstairs, a loft lives like a second lounge, complete with its own fireplace and a balcony wrapped in stainless railings that look out over the backyard canopy. Here you’ll find three additional bedrooms, one with a private ensuite perfect for guests, and a shared guest bathroom for the other two. Large windows continue throughout, ensuring every space feels bright and connected to the lush surroundings. Outside is where the Florida living really takes off. French doors line the back of the home and open to an expansive terrace and a wide, fully fenced yard—ideal for grilling, dining, playing, or just stretching out under the oaks. The grounds have been professionally designed with exotic tropicals and are fully irrigated, so the look is lush without the maintenance. One of the best parts? Low HOA dues with perks you’ll actually use: a private lakefront park on the Conway Chain with a new dock, boat ramp, picnic tables, and a playground. Fish, paddle, launch the boat, or just catch sunset at the water—your call. Tucked into a quiet, well-kept, golf-cart friendly community, you’re zoned for top-rated schools (Go Braves!) and minutes to local shops and groceries; when it’s time to roam, downtown Orlando, Lake Nona, and major highways are a quick hop away. This home delivers that rare mix—architectural character, functional layout, and real outdoor living—in a location that makes everyday life easy and weekends better.
Build Your Team
Quickly find investor-friendly professionals who can help you succeed in real estate investing at any stage of the investing journey.


Agents
Match with investor-friendly agents who can help you find, analyze, and close your next deal


Lenders
Get the best funding…find investor-friendly lenders who specialize in your deal strategy


Property Managers
Transition to passive investing. Find a trusted property management partnership that lasts.


Tax Pros & Accountants
Taxes and financial reporting made easy—find experts to create tax savings strategies, file taxes, and more
Location
Property Details
Parking
- Description: Garage
- Details: Driveway, Garage Faces Rear, Oversized, Attached
- Garage Spaces: 2
- Spaces Total: 0
Bedroom Information
- # of Bedrooms: 4
Bathroom Information
- # of Baths (Full): 3
- # of Baths (Total): 4.0
Interior Features
- # of Rooms: 10
- # of Stories: 2
- Fireplace: Yes
Exterior Features
- Exterior Walls Materials: Wood
- Foundation: Slab
- Roof Type: Gable or Hip
- Roof Material: Shingle
HOA
- Has HOA: Yes
- Association: Lake Conway Woods / Bruce Sweeny
- HOA Fee: $350/annually
Land Information
- Land Use: Residential
- Land Use Subtype: Single Family Residential
Lot Information
- Parcel ID: 172330439170010
- Lot Size: 15983 sqft
Property Information
- Property Type: Single Family Residence
- Year Built: 1975
Tax Information
- Annual Tax: $3,785
Utilities
- Water & Sewer: Public
- Heating: Central, Electric
- Cooling: Central Air
Location
- County: Orange
Listing Details
Investment Summary
- Monthly Cash Flow
- -$1,360
- Cap Rate
- 3.4%
- Cash-on-Cash Return
- -12.0%
- Debt Coverage Ratio
- 0.55
- Internal Rate of Return (5 years)
- -7.7%
Cash Flow
Net Operating Income (NOI) minus mortgage payments.
Calculation:
NOI - Mortgage Payments
Cap Rate (Market Value)
Capitalization Rate is a rate of return that compares the yearly Net Operating Income (NOI) to the market value.
Calculation:
NOI / Market Value
Cash-on-Cash Return (CoC)
Annual Cash Flow / Cash Invested
Calculation:
Annual cash flow divided by initial cash invested.
Debt Coverage Ratio (DCR)
Net Operating Income (NOI) divided by total debt payments.
Calculation:
NOI / Total Debt Payments
Internal Rate of Return (IRR)
A metric for assessing profitability over time. IRR is the discount rate at which the net present value (NPV) of all future cash flows (positive and negative) from an investment equals zero — including both periodic cash flow (such as rent) and a projected sale at the end of the holding period. It represents the expected annualized return, accounting for income, expenses, and the recovery of capital through a future sale.
Purchase Details
Purchase PriceThe price paid for the property. Purchase price:
| $589,000 |
|---|---|
Amount FinancedThe amount of the purchase financed through a loan. Amount financed:
| -$471,200 |
Down paymentThe initial payment made towards the purchase. Down payment:
| $117,800 |
Closing CostsFees and expenses associated with purchasing a property, typically ranging from 2% to 5% of the home’s purchase price, paid at the end of a home purchase to cover services like lending, title transfer, and taxes. Closing costs:
| $17,670 |
Rehab CostsCosts incurred to repair or improve the property, including: roof, flooring, exterior siding, kitchen, exterior paint, bathrooms, etc. Rehab costs:
| $0 |
Initial Cash InvestedThe total initial cash invested in the property. Calculation:Down payment + Buying costs + Rehab costs Initial cash invested:
| $135,470 |
Square Feet (SQFT)The total square footage of the property. Square feet:
| 2,216 |
Cost Per Square FootCost per square foot of the property. Calculation:Purchase Price / Square Feet Cost per square foot:
| $266 |
Monthly Rent Per Square FootMonthly rent divided by the number of square feet. This ratio helps investors compare rental income efficiency across properties, markets, and unit sizes Calculation:Monthly Rent / Square Feet Monthly rent per square foot:
| $1.31 |
Financing Details
Loan AmountThe total sum of money borrowed from a lender to finance a property purchase. Calculation:Purchase Price - Down Payment
Loan amount:
| $471,200 |
|---|---|
Loan to Value Ratio (LTV)Loan amount divided by the market value of the property. Calculation:Loan Amount / Market Value
Loan to value ratio:
| 80.0% |
Loan TypeThe type of loan (e.g., fixed, adjustable).
Loan type:
| Amortizing |
TermThe loan repayment period in years.
Term:
| 30 years |
Interest RateThe percentage a lender charges on the borrowed amount of a loan, determining the cost of borrowing money.
Interest rate:
| 6.625% |
Principal & Interest (PI)The principal is the portion of the loan payment that reduces the loan balance. The interest is the lender's charge for borrowing money. Calculation:(P * r * (1 + r) ** n) / ((1 + r) ** n - 1) Where:
P = Loan amount (principal)
Principal & interest:
| $3,017 |
Property TaxesAnnual taxes levied by local governments on real estate properties. These taxes fund public services like schools, roads, and emergency services.
Property tax:
| $315 |
InsuranceThe costs for insurance coverage to protect against financial losses due to risks like fire, natural disasters, theft, liability, or tenant-related damages. Calculation:Assumes 7% of gross rental income, unless insurance rates are specified.
Insurance:
| $203 |
Private Mortgage Insurance (PMI)A fee that borrowers pay when they take out a conventional loan with a loan-to-value (LTV) ratio above 80%.
Private mortgage insurance (PMI):
| $0 |
Monthly PaymentThe fixed amount a borrower pays each month to repay a loan. It typically includes principal and interest (P&I) and may also cover property taxes, insurance, HOA fees, and PMI if escrowed. Monthly payment:
| $3,535 |
Operating Income
| % Rent | Monthly | Yearly | |
|---|---|---|---|
Gross RentThe total rental income received from tenants before deducting any expenses. Includes base rent, late fees, pet fees, parking fees, and other recurring charges.
Gross rent:
| $2,900 | $34,800 | |
Vacancy LossExpected loss of rent due to vacancies.
Vacancy loss:
(6%)
| 6% | -$174 | -$2,088 |
Operating IncomeGross rental income minus vacancy loss. Calculation:Gross rent - Vacancy loss
Operating income:
| $2,726 | $32,712 |
Operating Expenses
| % Rent | Monthly | Yearly | |
|---|---|---|---|
Property TaxesAnnual taxes levied by local governments on real estate properties. These taxes fund public services like schools, roads, and emergency services. | 11% | -$315 | -$3,785 |
InsuranceThe costs for insurance coverage to protect against financial losses due to risks like fire, natural disasters, theft, liability, or tenant-related damages. Calculation:Assumes 7% of gross rental income, unless insurance rates are specified. | 7% | -$203 | -$2,436 |
Property ManagementThe costs associated with hiring a property manager to handle the day-to-day operations of a rental property. Includes management fees, leasing fes, eviction fees, etc. Calculation:Assumes 8% of gross rental income. | 8% | -$232 | -$2,784 |
Repairs & MaintenanceOngoing costs for routine upkeep and minor fixes needed to keep a property in good working condition. Calculation:Assumes 5% of gross rental income. Varies by property age and condition. | 5% | -$145 | -$1,740 |
Capital ExpensesLarge, infrequent costs for major improvements or replacements, like a new roof, HVAC system, or appliances. Calculation:Assumes 5% of gross rental income. Varies by property age. | 5% | -$145 | -$1,740 |
HOA FeesRegular dues paid to a Homeowners Association for community maintenance, amenities, and management. Similar fees include: Condo Association Fees, Co-op Maintenance Fees, etc. | 1% | -$29 | -$348 |
Operating ExpensesRecurring costs required to maintain and manage a rental property, including property taxes, insurance, maintenance, repairs, utilities (if paid by the owner), property management fees, and other day-to-day expenses. Calculation:Insurance + Property Taxes + Property Management + Repairs & Maintenance + Capital Expenditures + HOA Fees | 37% | -$1,069 | -$12,833 |
Cash Flow
| Monthly | Yearly | |
|---|---|---|
Net Operating Income (NOI)The income generated from a property after deducting all operating expenses but before deducting mortgage payments, taxes, and capital expenditures. Calculation:Gross Operating Income - Operating Expenses
Net operating income:
| $1,657 | $19,884 |
Mortgage PaymentThe fixed amount a borrower pays each month to repay a loan. It typically includes principal and interest (P&I) and may also cover property taxes, insurance, HOA fees, and PMI if escrowed. | -$3,017 | -$36,204 |
Cash FlowNet Operating Income (NOI) minus mortgage payments. Calculation:NOI - Mortgage Payments | $1,360 | $16,320 |