
$799,000
Investment Summary
- Monthly Cash Flow
- -$2,370
- Cap Rate
- 2.6%
- Cash-on-Cash Return
- -15.5%
- Debt Coverage Ratio
- 0.42
- Internal Rate of Return (5 years)
- -11.0%
Cash Flow
Net Operating Income (NOI) minus mortgage payments.
Calculation:
NOI - Mortgage Payments
Cap Rate (Market Value)
Capitalization Rate is a rate of return that compares the yearly Net Operating Income (NOI) to the market value.
Calculation:
NOI / Market Value
Cash-on-Cash Return (CoC)
Annual Cash Flow / Cash Invested
Calculation:
Annual cash flow divided by initial cash invested.
Debt Coverage Ratio (DCR)
Net Operating Income (NOI) divided by total debt payments.
Calculation:
NOI / Total Debt Payments
Internal Rate of Return (IRR)
A metric for assessing profitability over time. IRR is the discount rate at which the net present value (NPV) of all future cash flows (positive and negative) from an investment equals zero — including both periodic cash flow (such as rent) and a projected sale at the end of the holding period. It represents the expected annualized return, accounting for income, expenses, and the recovery of capital through a future sale.
Property Description
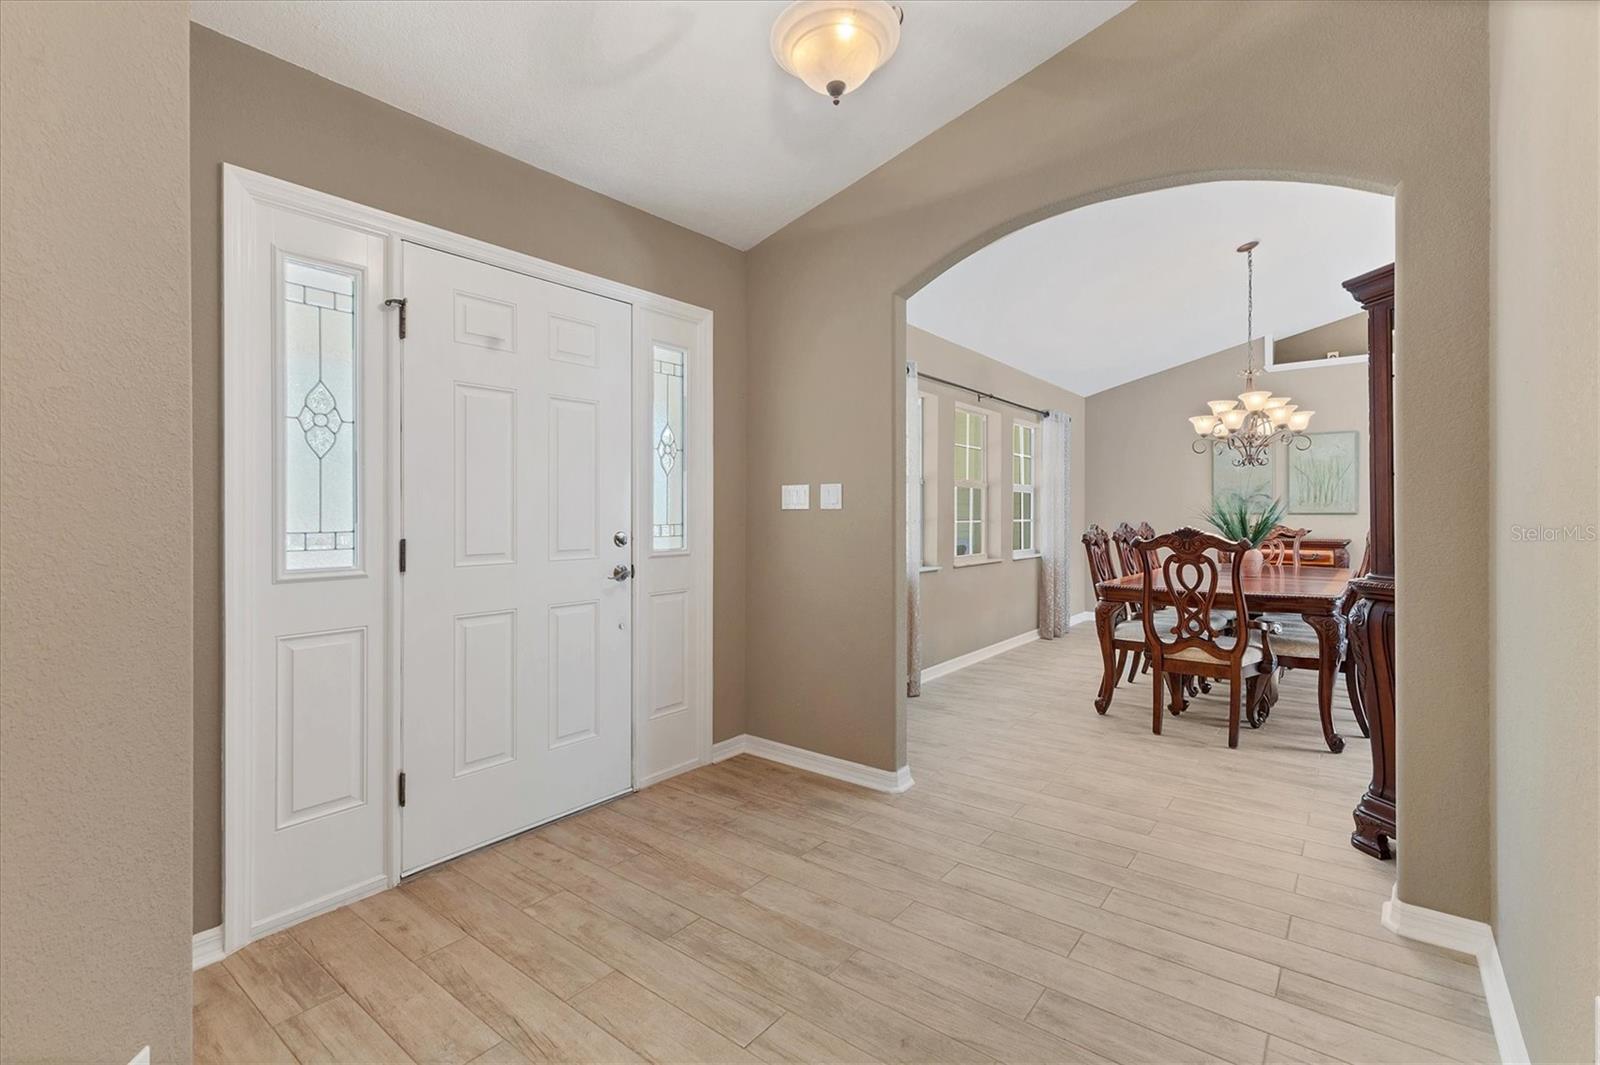
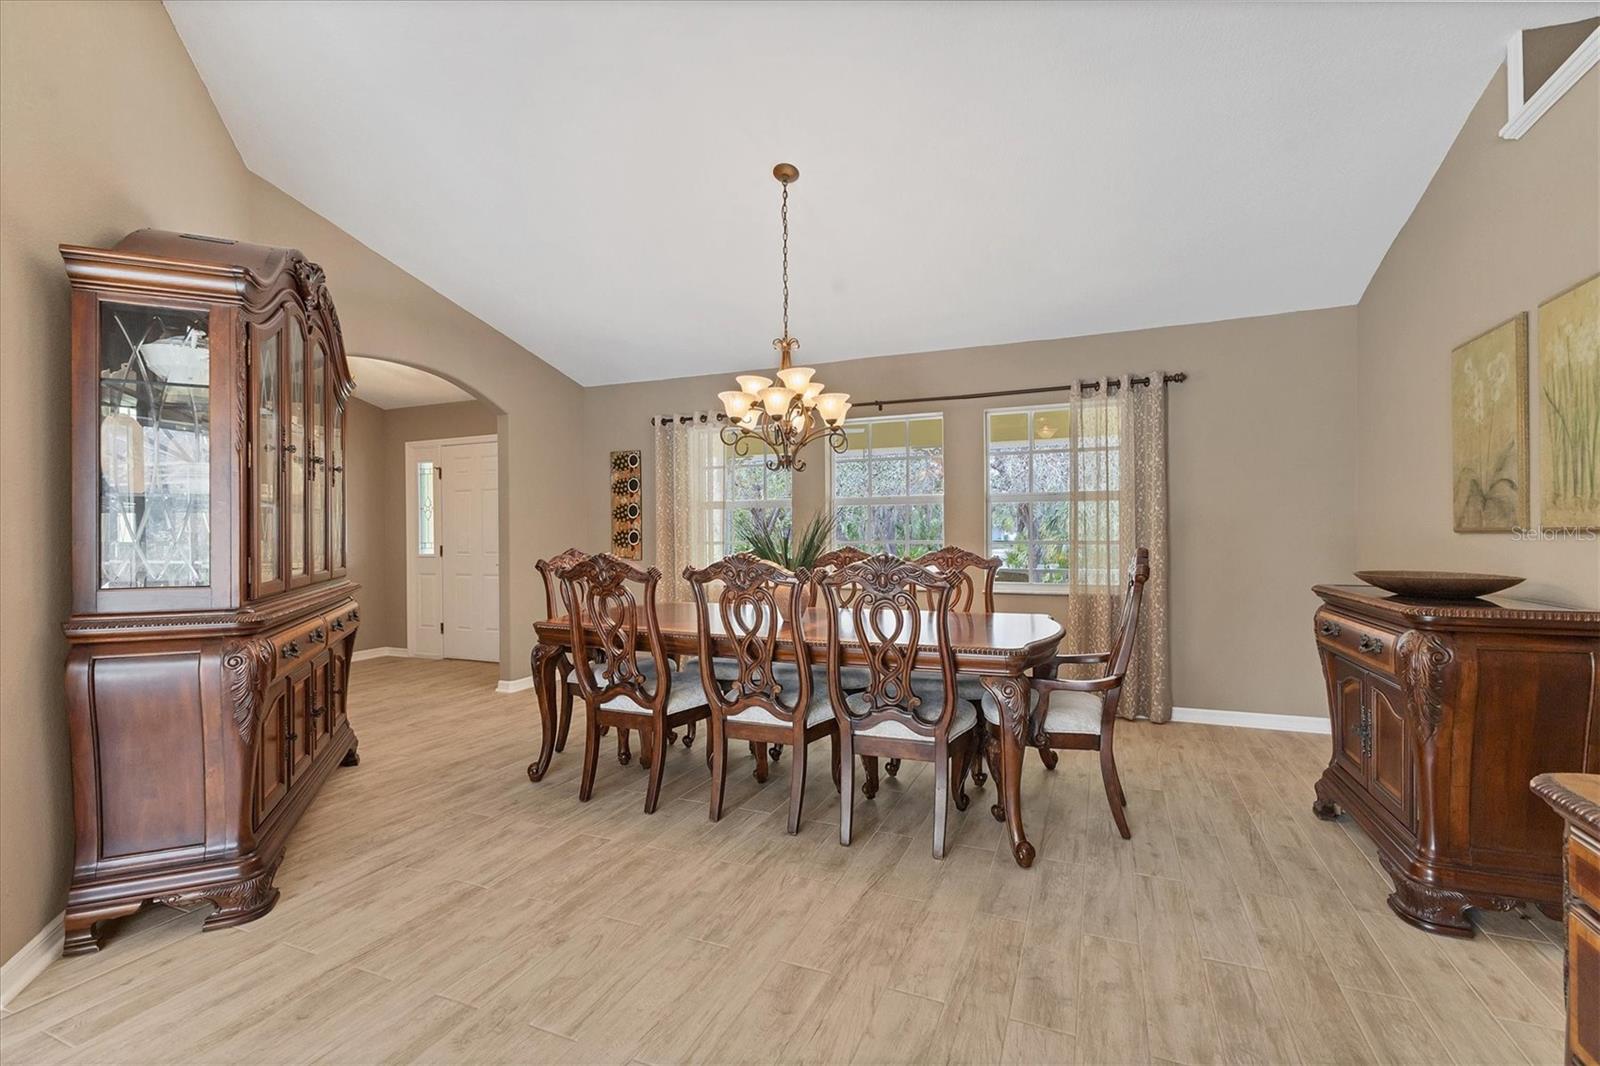
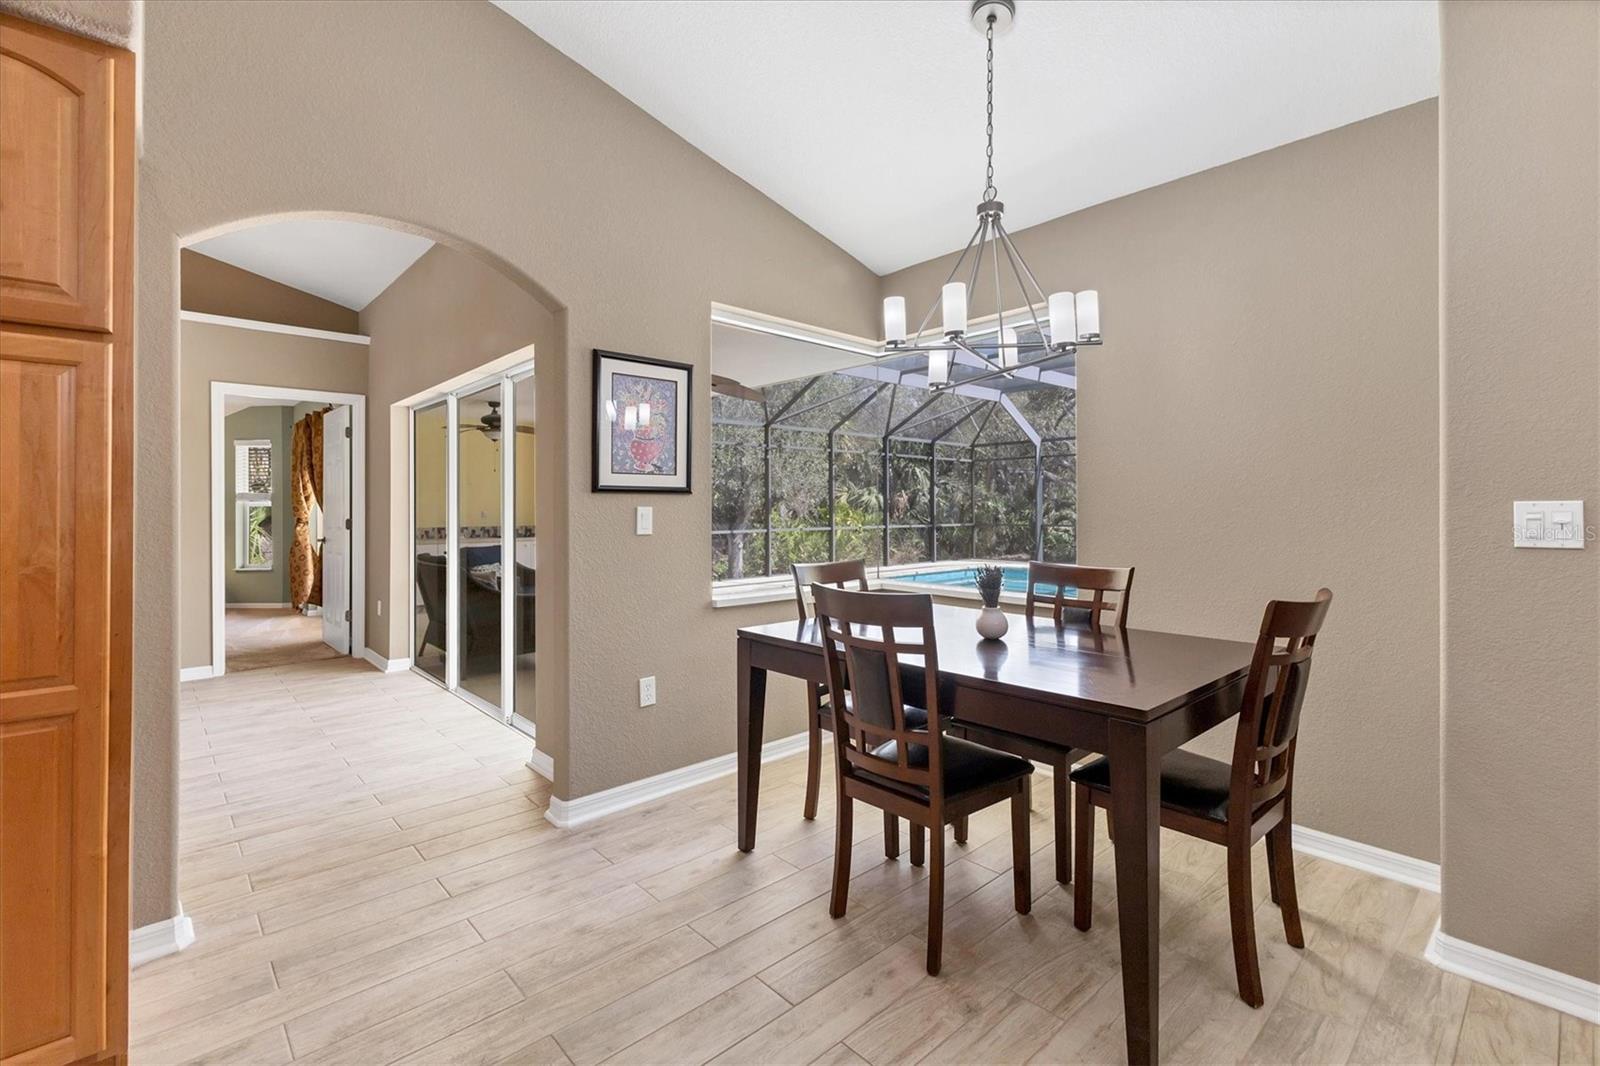
Please click on the walk thru video tour1 New Price! Welcome to your own private sanctuary of tranquility and this one comes with SALTWATER BOATING ACCESS TO PRISTINE CHARLOTTE HARBOR AND THE GULF OF MEXICO! Your dedicated easement is just steps way from your own dock and boat slip on Abhenry Waterway! You will be surrounded by the natural beauty of a Florida preserve on this acre and a half homesite offering a rare combination of privacy and all the amenities of in-town living. The FURNISHED custom home is a true 5 bedroom 3 bath or use the grand size of the 5th bedroom (26x12) as an in law/play room or OFFICE to match your lifestyle. High ceilings and architectural features bring a modern elegance and create a living environment that is as visually stunning as it is functionally practical. The private primary suite opens to the covered lanai and pool through French doors, has dual walk in closets and features a lavish bath with separate vanities, plenty of cabinet space, linen closet, whirlpool tub and a gorgeous, updated walk in shower with striking tile. The guest wing is separate with four good size bedrooms all with views of the preserve or pool and two full baths; one featuring pool access. The kitchen has been reimagined and is perfect for meal prep and effortless entertaining with beautiful unique granite counters, an extended 10' breakfast bar, newer stainless appliances, separate casual eating niche and a full unblocked view of the pool through your aquarium window. It opens to the oversized family room allowing family and guests to mingle with the cook or to join in. The Great Room and dining rooms greet you with warmth and the triple pocketing sliders allow access for you and your guests to the lanai and heated pool. There is plenty of space on the covered lanai with a summer kitchen and oversize pool deck all around the pool for sun and fun. Enjoy the gentle breeze and birdsong as you relax on the welcoming front porch. Other features include ROOF 2022, plank tile flooring in much of the home, enhanced lighting and fan fixtures, new pool cage screening and pool resurfacing, new Pentair variable speed pool pump, new motor for the pool heater. A long winding concrete driveway leads to your side loading garage and additional parking pad/turn around. Located just minutes to shopping, restaurants, schools, County Services Buildings, Tampa Bay Rays Spring Training and beautiful area beaches! Easy access to I75 via Kings Hwy and Ft Myers Regional airport. This extraordinary home is not just a residence; it's a lifestyle! Come check it out!
Build Your Team
Quickly find investor-friendly professionals who can help you succeed in real estate investing at any stage of the investing journey.


Agents
Match with investor-friendly agents who can help you find, analyze, and close your next deal


Lenders
Get the best funding…find investor-friendly lenders who specialize in your deal strategy


Property Managers
Transition to passive investing. Find a trusted property management partnership that lasts.


Tax Pros & Accountants
Taxes and financial reporting made easy—find experts to create tax savings strategies, file taxes, and more
Location
Property Details
Parking
- Description: Circular Driveway, Driveway, Garage Door Opener, Garage Faces Side, Ground Level, Guest, Oversized, Parking Pad
- Details: Circular Driveway, Driveway, Garage Door Opener, Garage Faces Side, Guest, Oversized, Parking Pad, Attached
- Garage Spaces: 2
- Spaces Total: 0
Bedroom Information
- # of Bedrooms: 5
Bathroom Information
- # of Baths (Full): 3
- # of Baths (Total): 3.0
Interior Features
- # of Rooms: 14
- # of Stories: 1
Exterior Features
- Exterior Walls Materials: Stucco
- Foundation: Slab
- Roof Material: Shingle
- Pool: Yes
HOA
- Has HOA: Yes
- Association: Rocksedge Property Owners Assn/Brian Brunderman
- HOA Fee: $68/annually
Land Information
- Land Use: Residential
- Land Use Subtype: Single Family Residential
Lot Information
- Parcel ID: 402229127004
- Lot Size: 60180 sqft
Property Information
- Property Type: Single Family Residence
- Style: Florida, Other, Ranch, Traditional
- Year Built: 2007
Tax Information
- Annual Tax: $3,266
Utilities
- Water & Sewer: Public
- Heating: Central, Electric, Zoned
- Cooling: Central Air, Zoned
Location
- County: Charlotte
Listing Details
Investment Summary
- Monthly Cash Flow
- -$2,370
- Cap Rate
- 2.6%
- Cash-on-Cash Return
- -15.5%
- Debt Coverage Ratio
- 0.42
- Internal Rate of Return (5 years)
- -11.0%
Cash Flow
Net Operating Income (NOI) minus mortgage payments.
Calculation:
NOI - Mortgage Payments
Cap Rate (Market Value)
Capitalization Rate is a rate of return that compares the yearly Net Operating Income (NOI) to the market value.
Calculation:
NOI / Market Value
Cash-on-Cash Return (CoC)
Annual Cash Flow / Cash Invested
Calculation:
Annual cash flow divided by initial cash invested.
Debt Coverage Ratio (DCR)
Net Operating Income (NOI) divided by total debt payments.
Calculation:
NOI / Total Debt Payments
Internal Rate of Return (IRR)
A metric for assessing profitability over time. IRR is the discount rate at which the net present value (NPV) of all future cash flows (positive and negative) from an investment equals zero — including both periodic cash flow (such as rent) and a projected sale at the end of the holding period. It represents the expected annualized return, accounting for income, expenses, and the recovery of capital through a future sale.
Purchase Details
Purchase PriceThe price paid for the property. Purchase price:
| $799,000 |
|---|---|
Amount FinancedThe amount of the purchase financed through a loan. Amount financed:
| -$639,200 |
Down paymentThe initial payment made towards the purchase. Down payment:
| $159,800 |
Closing CostsFees and expenses associated with purchasing a property, typically ranging from 2% to 5% of the home’s purchase price, paid at the end of a home purchase to cover services like lending, title transfer, and taxes. Closing costs:
| $23,970 |
Rehab CostsCosts incurred to repair or improve the property, including: roof, flooring, exterior siding, kitchen, exterior paint, bathrooms, etc. Rehab costs:
| $0 |
Initial Cash InvestedThe total initial cash invested in the property. Calculation:Down payment + Buying costs + Rehab costs Initial cash invested:
| $183,770 |
Square Feet (SQFT)The total square footage of the property. Square feet:
| 2,794 |
Cost Per Square FootCost per square foot of the property. Calculation:Purchase Price / Square Feet Cost per square foot:
| $286 |
Monthly Rent Per Square FootMonthly rent divided by the number of square feet. This ratio helps investors compare rental income efficiency across properties, markets, and unit sizes Calculation:Monthly Rent / Square Feet Monthly rent per square foot:
| $1.04 |
Financing Details
Loan AmountThe total sum of money borrowed from a lender to finance a property purchase. Calculation:Purchase Price - Down Payment
Loan amount:
| $639,200 |
|---|---|
Loan to Value Ratio (LTV)Loan amount divided by the market value of the property. Calculation:Loan Amount / Market Value
Loan to value ratio:
| 80.0% |
Loan TypeThe type of loan (e.g., fixed, adjustable).
Loan type:
| Amortizing |
TermThe loan repayment period in years.
Term:
| 30 years |
Interest RateThe percentage a lender charges on the borrowed amount of a loan, determining the cost of borrowing money.
Interest rate:
| 6.625% |
Principal & Interest (PI)The principal is the portion of the loan payment that reduces the loan balance. The interest is the lender's charge for borrowing money. Calculation:(P * r * (1 + r) ** n) / ((1 + r) ** n - 1) Where:
P = Loan amount (principal)
Principal & interest:
| $4,093 |
Property TaxesAnnual taxes levied by local governments on real estate properties. These taxes fund public services like schools, roads, and emergency services.
Property tax:
| $272 |
InsuranceThe costs for insurance coverage to protect against financial losses due to risks like fire, natural disasters, theft, liability, or tenant-related damages. Calculation:Assumes 7% of gross rental income, unless insurance rates are specified.
Insurance:
| $203 |
Private Mortgage Insurance (PMI)A fee that borrowers pay when they take out a conventional loan with a loan-to-value (LTV) ratio above 80%.
Private mortgage insurance (PMI):
| $0 |
Monthly PaymentThe fixed amount a borrower pays each month to repay a loan. It typically includes principal and interest (P&I) and may also cover property taxes, insurance, HOA fees, and PMI if escrowed. Monthly payment:
| $4,568 |
Operating Income
| % Rent | Monthly | Yearly | |
|---|---|---|---|
Gross RentThe total rental income received from tenants before deducting any expenses. Includes base rent, late fees, pet fees, parking fees, and other recurring charges.
Gross rent:
| $2,900 | $34,800 | |
Vacancy LossExpected loss of rent due to vacancies.
Vacancy loss:
(6%)
| 6% | -$174 | -$2,088 |
Operating IncomeGross rental income minus vacancy loss. Calculation:Gross rent - Vacancy loss
Operating income:
| $2,726 | $32,712 |
Operating Expenses
| % Rent | Monthly | Yearly | |
|---|---|---|---|
Property TaxesAnnual taxes levied by local governments on real estate properties. These taxes fund public services like schools, roads, and emergency services. | 9% | -$272 | -$3,266 |
InsuranceThe costs for insurance coverage to protect against financial losses due to risks like fire, natural disasters, theft, liability, or tenant-related damages. Calculation:Assumes 7% of gross rental income, unless insurance rates are specified. | 7% | -$203 | -$2,436 |
Property ManagementThe costs associated with hiring a property manager to handle the day-to-day operations of a rental property. Includes management fees, leasing fes, eviction fees, etc. Calculation:Assumes 8% of gross rental income. | 8% | -$232 | -$2,784 |
Repairs & MaintenanceOngoing costs for routine upkeep and minor fixes needed to keep a property in good working condition. Calculation:Assumes 5% of gross rental income. Varies by property age and condition. | 5% | -$145 | -$1,740 |
Capital ExpensesLarge, infrequent costs for major improvements or replacements, like a new roof, HVAC system, or appliances. Calculation:Assumes 5% of gross rental income. Varies by property age. | 5% | -$145 | -$1,740 |
HOA FeesRegular dues paid to a Homeowners Association for community maintenance, amenities, and management. Similar fees include: Condo Association Fees, Co-op Maintenance Fees, etc. | 0% | -$6 | -$72 |
Operating ExpensesRecurring costs required to maintain and manage a rental property, including property taxes, insurance, maintenance, repairs, utilities (if paid by the owner), property management fees, and other day-to-day expenses. Calculation:Insurance + Property Taxes + Property Management + Repairs & Maintenance + Capital Expenditures + HOA Fees | 35% | -$1,003 | -$12,038 |
Cash Flow
| Monthly | Yearly | |
|---|---|---|
Net Operating Income (NOI)The income generated from a property after deducting all operating expenses but before deducting mortgage payments, taxes, and capital expenditures. Calculation:Gross Operating Income - Operating Expenses
Net operating income:
| $1,723 | $20,676 |
Mortgage PaymentThe fixed amount a borrower pays each month to repay a loan. It typically includes principal and interest (P&I) and may also cover property taxes, insurance, HOA fees, and PMI if escrowed. | -$4,093 | -$49,116 |
Cash FlowNet Operating Income (NOI) minus mortgage payments. Calculation:NOI - Mortgage Payments | $2,370 | $28,440 |