
$700,000
Investment Summary
- Monthly Cash Flow
- -$26
- Cap Rate
- 5.6%
- Cash-on-Cash Return
- -0.2%
- Debt Coverage Ratio
- 0.99
- Internal Rate of Return (5 years)
- 3.8%
Cash Flow
Net Operating Income (NOI) minus mortgage payments.
Calculation:
NOI - Mortgage Payments
Cap Rate (Market Value)
Capitalization Rate is a rate of return that compares the yearly Net Operating Income (NOI) to the market value.
Calculation:
NOI / Market Value
Cash-on-Cash Return (CoC)
Annual Cash Flow / Cash Invested
Calculation:
Annual cash flow divided by initial cash invested.
Debt Coverage Ratio (DCR)
Net Operating Income (NOI) divided by total debt payments.
Calculation:
NOI / Total Debt Payments
Internal Rate of Return (IRR)
A metric for assessing profitability over time. IRR is the discount rate at which the net present value (NPV) of all future cash flows (positive and negative) from an investment equals zero — including both periodic cash flow (such as rent) and a projected sale at the end of the holding period. It represents the expected annualized return, accounting for income, expenses, and the recovery of capital through a future sale.
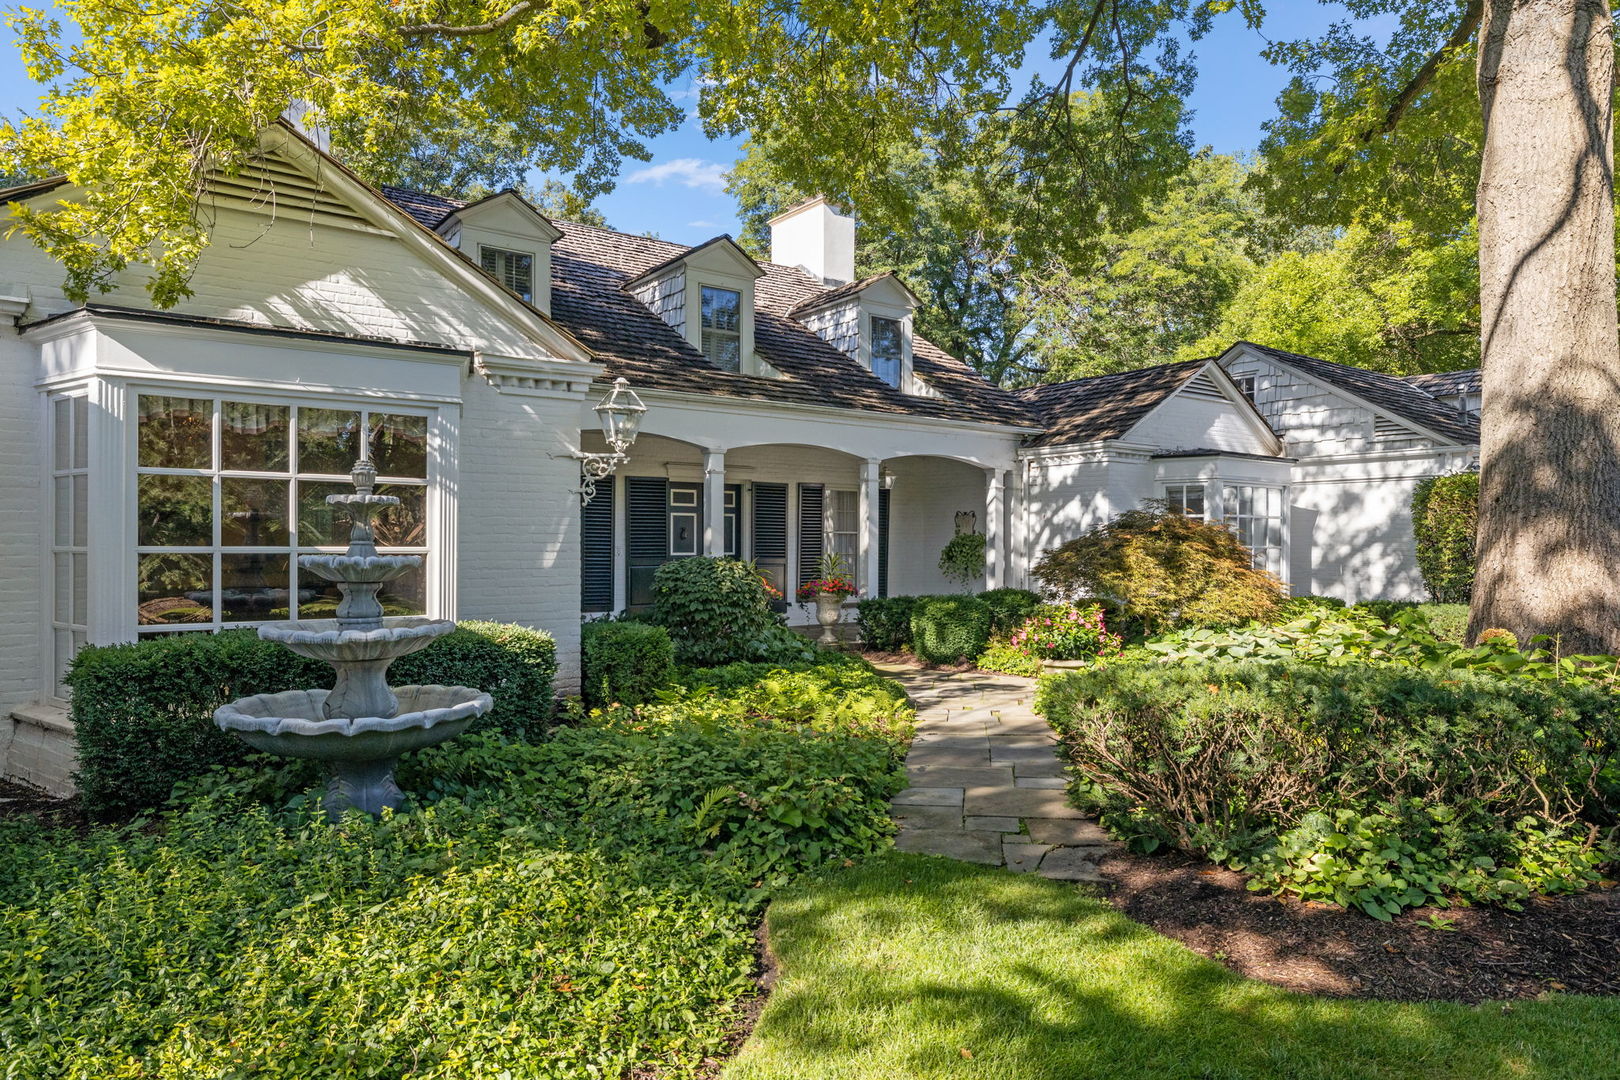
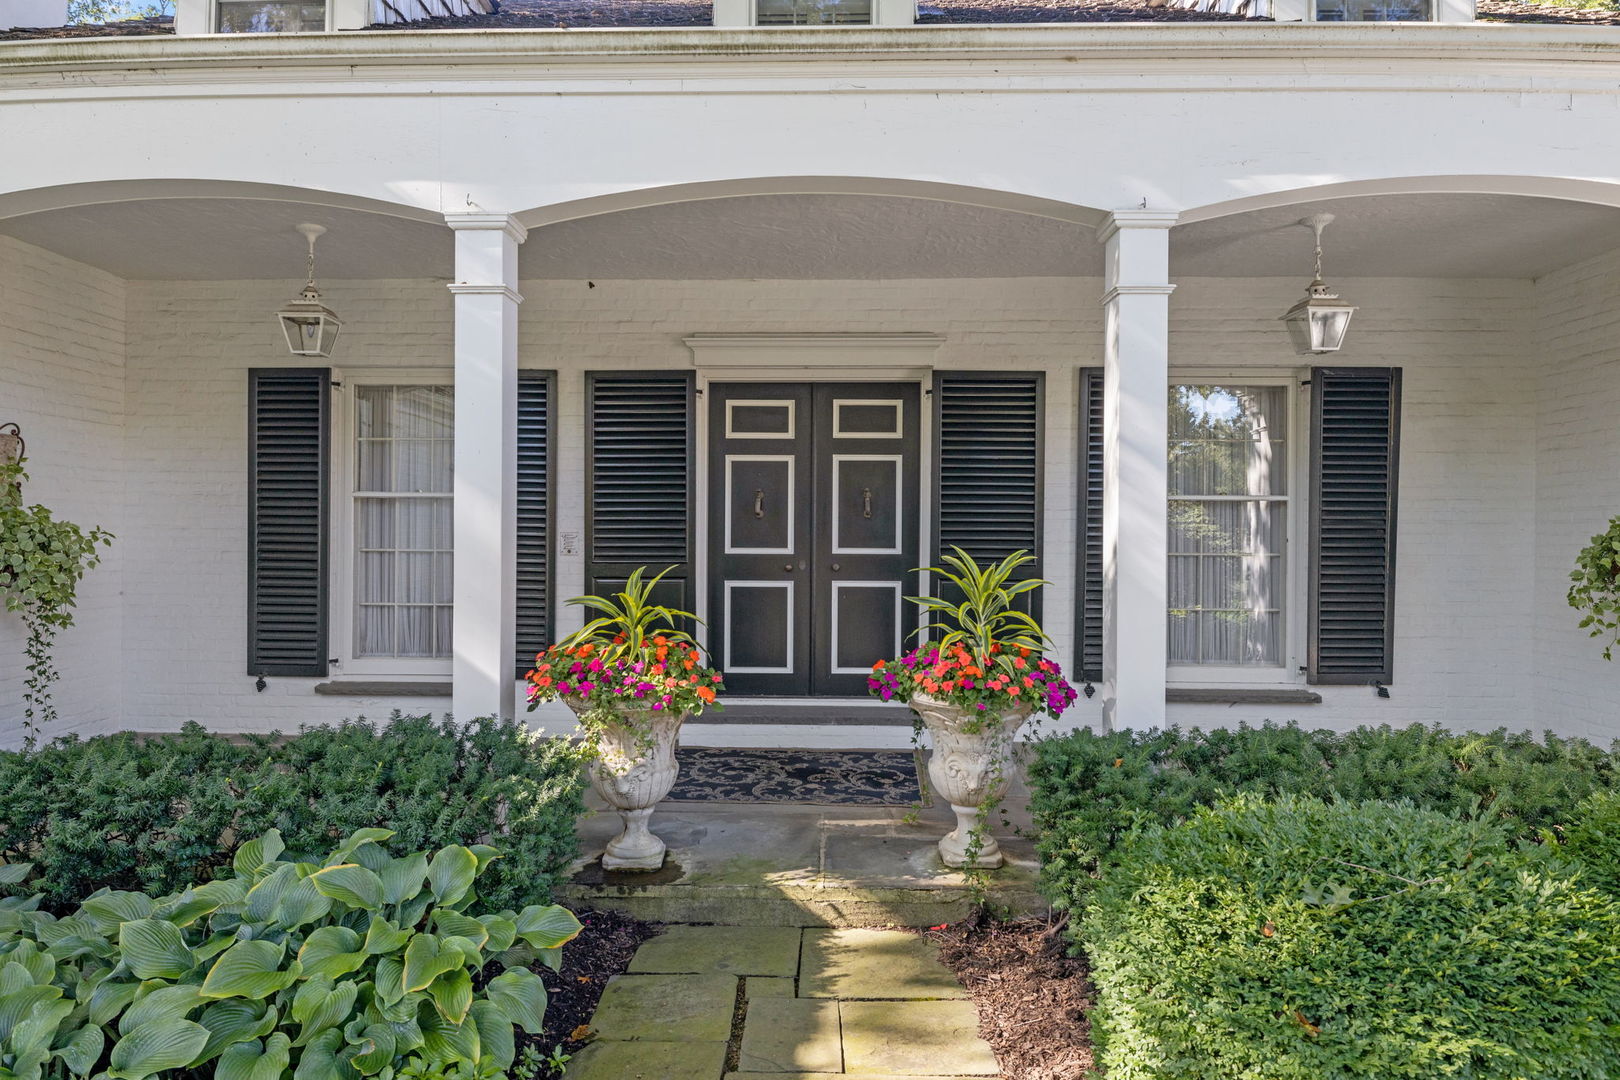
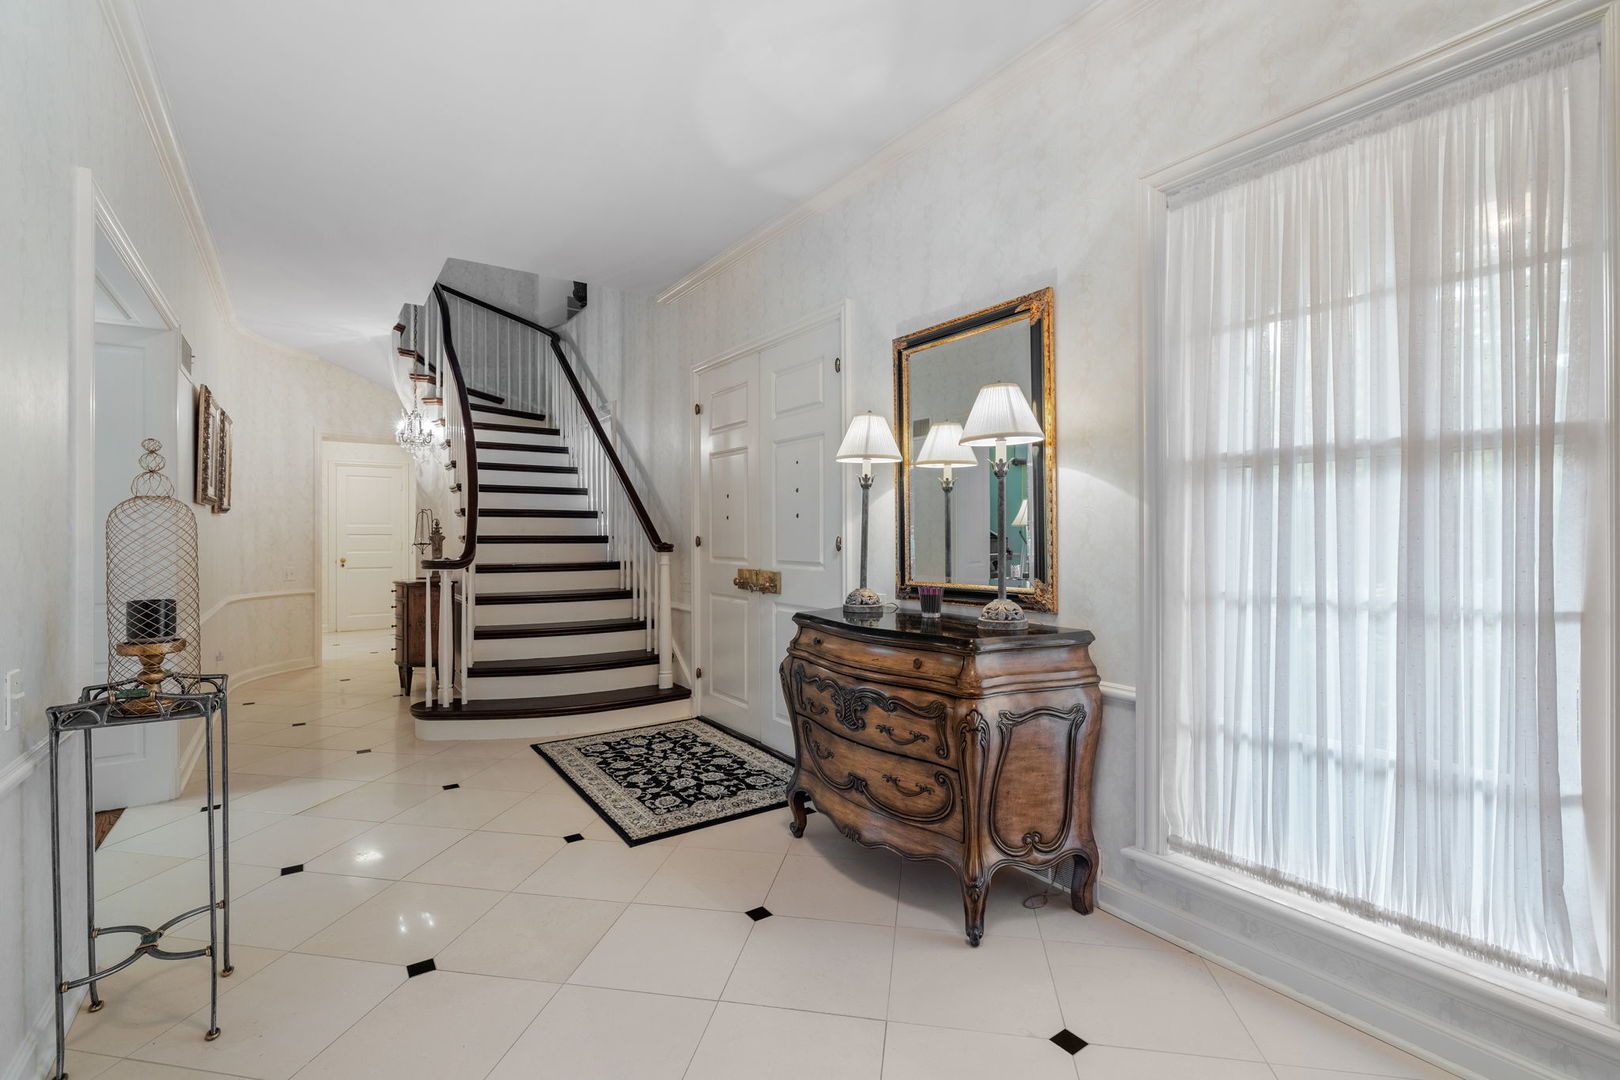
Property Description
Luxury Estate in sought after Timberline subdivision designed by Jerome Cerny Architects. Mr. Cerny specialized in designing luxury homes for the influential families in the area. His work is commonly found in Lake Forest IL and the Chicago North Shore which makes this home even more unique. This country french style home is situated on over an acre of pristine property. It offers 4 bedrooms/ 3 full bathrooms & 2 half bathrooms with a spectacular kitchen, heated garages, and finished walkout basement. Drive up the paver brick driveway to find a one of a kind home on a wooded lot. Enjoy a grand entrance from the covered front porch into the foyer with heated tile floor & elegant staircase. Access the huge living room with fireplace and bay window overlooking the professionally landscaped yard. Across the foyer find the formal dining room, which is perfect for family gatherings. Eat in chef's kitchen offers top of the line stainless steel appliances, granite countertops, custom cabinets, butler's pantry, coffee station, and table space. Off the kitchen you will find a laundry room, half bathroom, and mud room with access to the garages and a paver brick patio. The executive office/den offers custom built in shelving and views of the wooded lot. The family room has a brick fireplace, wet bar with wine fridge, and hardwood floors. Connected to the family room is the "GREAT" room. This room is 1000 sq feet and has multiple purposes depending on your family's needs. TV room, game room, rec room, workout room, etc. This room also has access to the back patio. Main level primary bedroom has an en suite with oversized custom shower, jacuzzi tub, and double vanity. Upstairs has three additional great size bedrooms with multiple closets, two of which offer Jack and Jill style full bathroom, while the other offers shared access to the full hall bathroom with stand in shower. Walk out basement offers an additional family room, fireplace, two large storage rooms, half bathroom, and mechanical room. Access the stone patio with a built in gas grill, beverage fridge, firepit, and seating area. A few steps off the patio you will find a custom turf chipping and putting green. Attached is a 2 car garage with two interior heated stalls that are split by a drive in covered carport for a 3rd vehicle. Above the garage spaces is a partially finished attic space. Paver brick driveway, professional landscaping & lighting, security system, sprinkler system, and more. This home has been extremely well maintained over the years, all while still keeping its architectural integrity. Close to interstate access, shopping, restaurants and all that Joliet and the surrounding suburbs have to offer! Home is being sold as-is.
Build Your Team
Quickly find investor-friendly professionals who can help you succeed in real estate investing at any stage of the investing journey.


Agents
Match with investor-friendly agents who can help you find, analyze, and close your next deal


Lenders
Get the best funding…find investor-friendly lenders who specialize in your deal strategy


Property Managers
Transition to passive investing. Find a trusted property management partnership that lasts.


Tax Pros & Accountants
Taxes and financial reporting made easy—find experts to create tax savings strategies, file taxes, and more
Location
Property Details
Parking
- Description: Garage
- Details: Garage Door Opener, Carport, Heated Garage, On Site, Attached, Garage, Driveway
- Garage Spaces: 3
- Spaces Total: 3
Bedroom Information
- # of Bedrooms: 4
Bathroom Information
- # of Baths (Full): 3
- # of Baths (Partial): 2
- # of Baths (Total): 5.0
Interior Features
- # of Rooms: 11
- Basement: Yes
- Basement Description: Sump Pump, Finished, Full
- Fireplace: Yes
Exterior Features
- Foundation: Concrete Perimeter
- Roof Material: Shake
Land Information
- Land Use: Residential
- Land Use Subtype: Single Family Residential
Lot Information
- Parcel ID: 050611206003
- Lot Size: 0 sqft
Property Information
- Property Type: Single Family Residence
- Style: Other
- Year Built: 1967
Tax Information
- Annual Tax: $17,683
Utilities
- Water & Sewer: Well
- Heating: Natural Gas, Forced Air, Radiant Floor
- Cooling: Central Air
Location
- County: Will
Listing Details
Investment Summary
- Monthly Cash Flow
- -$26
- Cap Rate
- 5.6%
- Cash-on-Cash Return
- -0.2%
- Debt Coverage Ratio
- 0.99
- Internal Rate of Return (5 years)
- 3.8%
Cash Flow
Net Operating Income (NOI) minus mortgage payments.
Calculation:
NOI - Mortgage Payments
Cap Rate (Market Value)
Capitalization Rate is a rate of return that compares the yearly Net Operating Income (NOI) to the market value.
Calculation:
NOI / Market Value
Cash-on-Cash Return (CoC)
Annual Cash Flow / Cash Invested
Calculation:
Annual cash flow divided by initial cash invested.
Debt Coverage Ratio (DCR)
Net Operating Income (NOI) divided by total debt payments.
Calculation:
NOI / Total Debt Payments
Internal Rate of Return (IRR)
A metric for assessing profitability over time. IRR is the discount rate at which the net present value (NPV) of all future cash flows (positive and negative) from an investment equals zero — including both periodic cash flow (such as rent) and a projected sale at the end of the holding period. It represents the expected annualized return, accounting for income, expenses, and the recovery of capital through a future sale.
Purchase Details
Purchase PriceThe price paid for the property. Purchase price:
| $700,000 |
|---|---|
Amount FinancedThe amount of the purchase financed through a loan. Amount financed:
| -$560,000 |
Down paymentThe initial payment made towards the purchase. Down payment:
| $140,000 |
Closing CostsFees and expenses associated with purchasing a property, typically ranging from 2% to 5% of the home’s purchase price, paid at the end of a home purchase to cover services like lending, title transfer, and taxes. Closing costs:
| $21,000 |
Rehab CostsCosts incurred to repair or improve the property, including: roof, flooring, exterior siding, kitchen, exterior paint, bathrooms, etc. Rehab costs:
| $0 |
Initial Cash InvestedThe total initial cash invested in the property. Calculation:Down payment + Buying costs + Rehab costs Initial cash invested:
| $161,000 |
Square Feet (SQFT)The total square footage of the property. Square feet:
| 4,723 |
Cost Per Square FootCost per square foot of the property. Calculation:Purchase Price / Square Feet Cost per square foot:
| $148 |
Monthly Rent Per Square FootMonthly rent divided by the number of square feet. This ratio helps investors compare rental income efficiency across properties, markets, and unit sizes Calculation:Monthly Rent / Square Feet Monthly rent per square foot:
| $1.46 |
Financing Details
Loan AmountThe total sum of money borrowed from a lender to finance a property purchase. Calculation:Purchase Price - Down Payment
Loan amount:
| $560,000 |
|---|---|
Loan to Value Ratio (LTV)Loan amount divided by the market value of the property. Calculation:Loan Amount / Market Value
Loan to value ratio:
| 80.0% |
Loan TypeThe type of loan (e.g., fixed, adjustable).
Loan type:
| Amortizing |
TermThe loan repayment period in years.
Term:
| 30 years |
Interest RateThe percentage a lender charges on the borrowed amount of a loan, determining the cost of borrowing money.
Interest rate:
| 5.875% |
Principal & Interest (PI)The principal is the portion of the loan payment that reduces the loan balance. The interest is the lender's charge for borrowing money. Calculation:(P * r * (1 + r) ** n) / ((1 + r) ** n - 1) Where:
P = Loan amount (principal)
Principal & interest:
| $3,313 |
Property TaxesAnnual taxes levied by local governments on real estate properties. These taxes fund public services like schools, roads, and emergency services.
Property tax:
| $1,474 |
InsuranceThe costs for insurance coverage to protect against financial losses due to risks like fire, natural disasters, theft, liability, or tenant-related damages. Calculation:Assumes 7% of gross rental income, unless insurance rates are specified.
Insurance:
| $483 |
Private Mortgage Insurance (PMI)A fee that borrowers pay when they take out a conventional loan with a loan-to-value (LTV) ratio above 80%.
Private mortgage insurance (PMI):
| $0 |
Monthly PaymentThe fixed amount a borrower pays each month to repay a loan. It typically includes principal and interest (P&I) and may also cover property taxes, insurance, HOA fees, and PMI if escrowed. Monthly payment:
| $5,270 |
Operating Income
| % Rent | Monthly | Yearly | |
|---|---|---|---|
Gross RentThe total rental income received from tenants before deducting any expenses. Includes base rent, late fees, pet fees, parking fees, and other recurring charges.
Gross rent:
| $6,900 | $82,800 | |
Vacancy LossExpected loss of rent due to vacancies.
Vacancy loss:
(6%)
| 6% | -$414 | -$4,968 |
Operating IncomeGross rental income minus vacancy loss. Calculation:Gross rent - Vacancy loss
Operating income:
| $6,486 | $77,832 |
Operating Expenses
| % Rent | Monthly | Yearly | |
|---|---|---|---|
Property TaxesAnnual taxes levied by local governments on real estate properties. These taxes fund public services like schools, roads, and emergency services. | 21% | -$1,474 | -$17,683 |
InsuranceThe costs for insurance coverage to protect against financial losses due to risks like fire, natural disasters, theft, liability, or tenant-related damages. Calculation:Assumes 7% of gross rental income, unless insurance rates are specified. | 7% | -$483 | -$5,796 |
Property ManagementThe costs associated with hiring a property manager to handle the day-to-day operations of a rental property. Includes management fees, leasing fes, eviction fees, etc. Calculation:Assumes 8% of gross rental income. | 8% | -$552 | -$6,624 |
Repairs & MaintenanceOngoing costs for routine upkeep and minor fixes needed to keep a property in good working condition. Calculation:Assumes 5% of gross rental income. Varies by property age and condition. | 5% | -$345 | -$4,140 |
Capital ExpensesLarge, infrequent costs for major improvements or replacements, like a new roof, HVAC system, or appliances. Calculation:Assumes 5% of gross rental income. Varies by property age. | 5% | -$345 | -$4,140 |
HOA FeesRegular dues paid to a Homeowners Association for community maintenance, amenities, and management. Similar fees include: Condo Association Fees, Co-op Maintenance Fees, etc. | n/a | n/a | n/a |
Operating ExpensesRecurring costs required to maintain and manage a rental property, including property taxes, insurance, maintenance, repairs, utilities (if paid by the owner), property management fees, and other day-to-day expenses. Calculation:Insurance + Property Taxes + Property Management + Repairs & Maintenance + Capital Expenditures + HOA Fees | 46% | -$3,199 | -$38,383 |
Cash Flow
| Monthly | Yearly | |
|---|---|---|
Net Operating Income (NOI)The income generated from a property after deducting all operating expenses but before deducting mortgage payments, taxes, and capital expenditures. Calculation:Gross Operating Income - Operating Expenses
Net operating income:
| $3,287 | $39,444 |
Mortgage PaymentThe fixed amount a borrower pays each month to repay a loan. It typically includes principal and interest (P&I) and may also cover property taxes, insurance, HOA fees, and PMI if escrowed. | -$3,313 | -$39,756 |
Cash FlowNet Operating Income (NOI) minus mortgage payments. Calculation:NOI - Mortgage Payments | -$26 | -$312 |