
$1,100,000
Investment Summary
- Monthly Cash Flow
- -$2,596
- Cap Rate
- 2.8%
- Cash-on-Cash Return
- -12.3%
- Debt Coverage Ratio
- 0.50
- Internal Rate of Return (5 years)
- -7.9%
Cash Flow
Net Operating Income (NOI) minus mortgage payments.
Calculation:
NOI - Mortgage Payments
Cap Rate (Market Value)
Capitalization Rate is a rate of return that compares the yearly Net Operating Income (NOI) to the market value.
Calculation:
NOI / Market Value
Cash-on-Cash Return (CoC)
Annual Cash Flow / Cash Invested
Calculation:
Annual cash flow divided by initial cash invested.
Debt Coverage Ratio (DCR)
Net Operating Income (NOI) divided by total debt payments.
Calculation:
NOI / Total Debt Payments
Internal Rate of Return (IRR)
A metric for assessing profitability over time. IRR is the discount rate at which the net present value (NPV) of all future cash flows (positive and negative) from an investment equals zero — including both periodic cash flow (such as rent) and a projected sale at the end of the holding period. It represents the expected annualized return, accounting for income, expenses, and the recovery of capital through a future sale.
Property Description
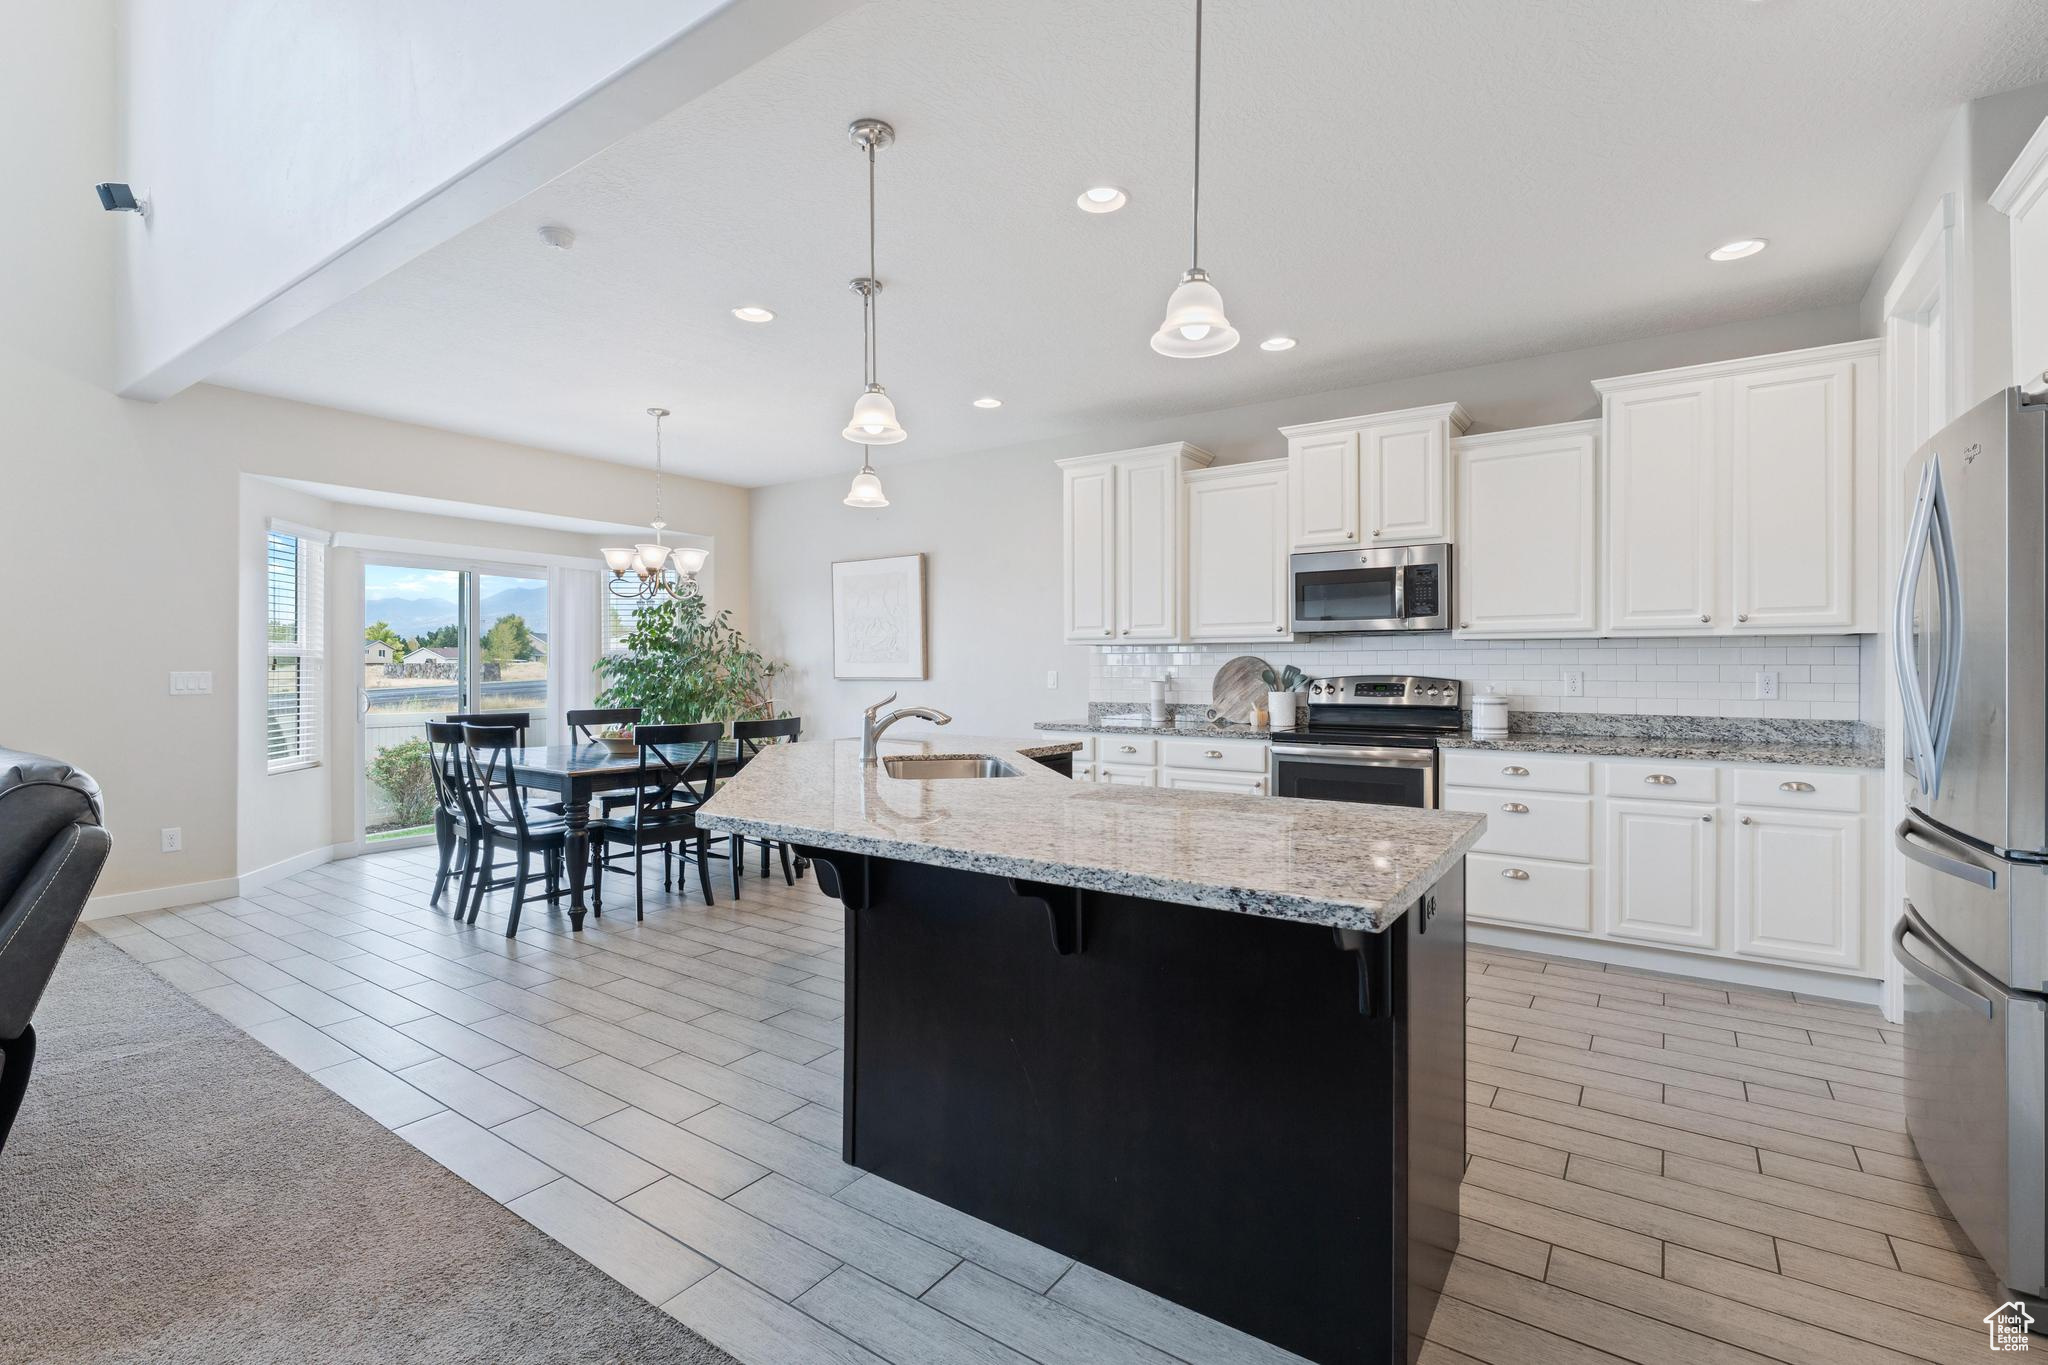
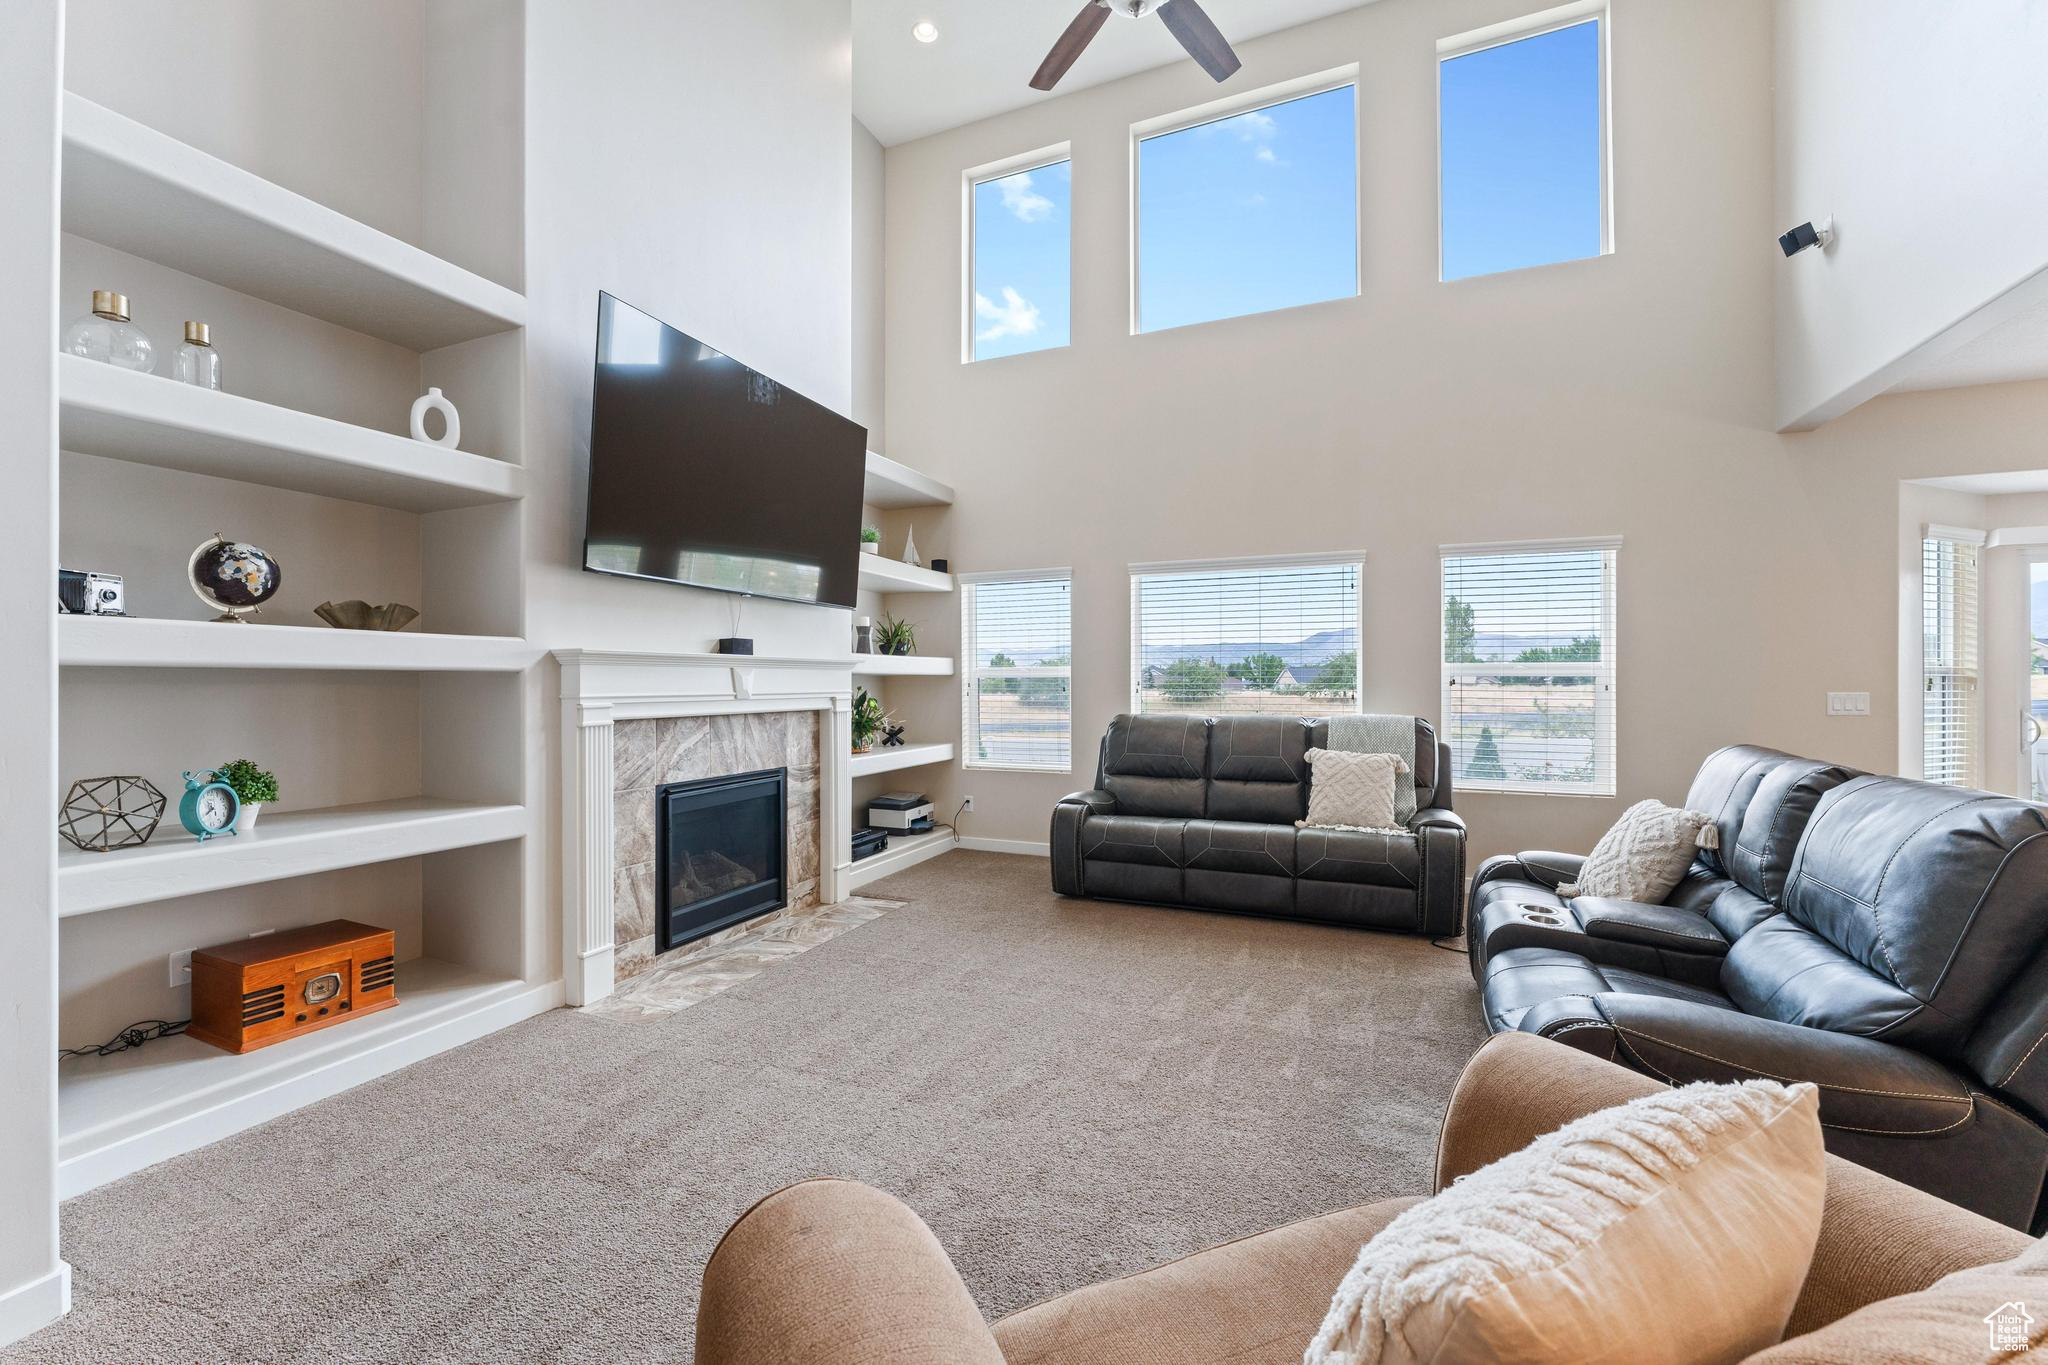
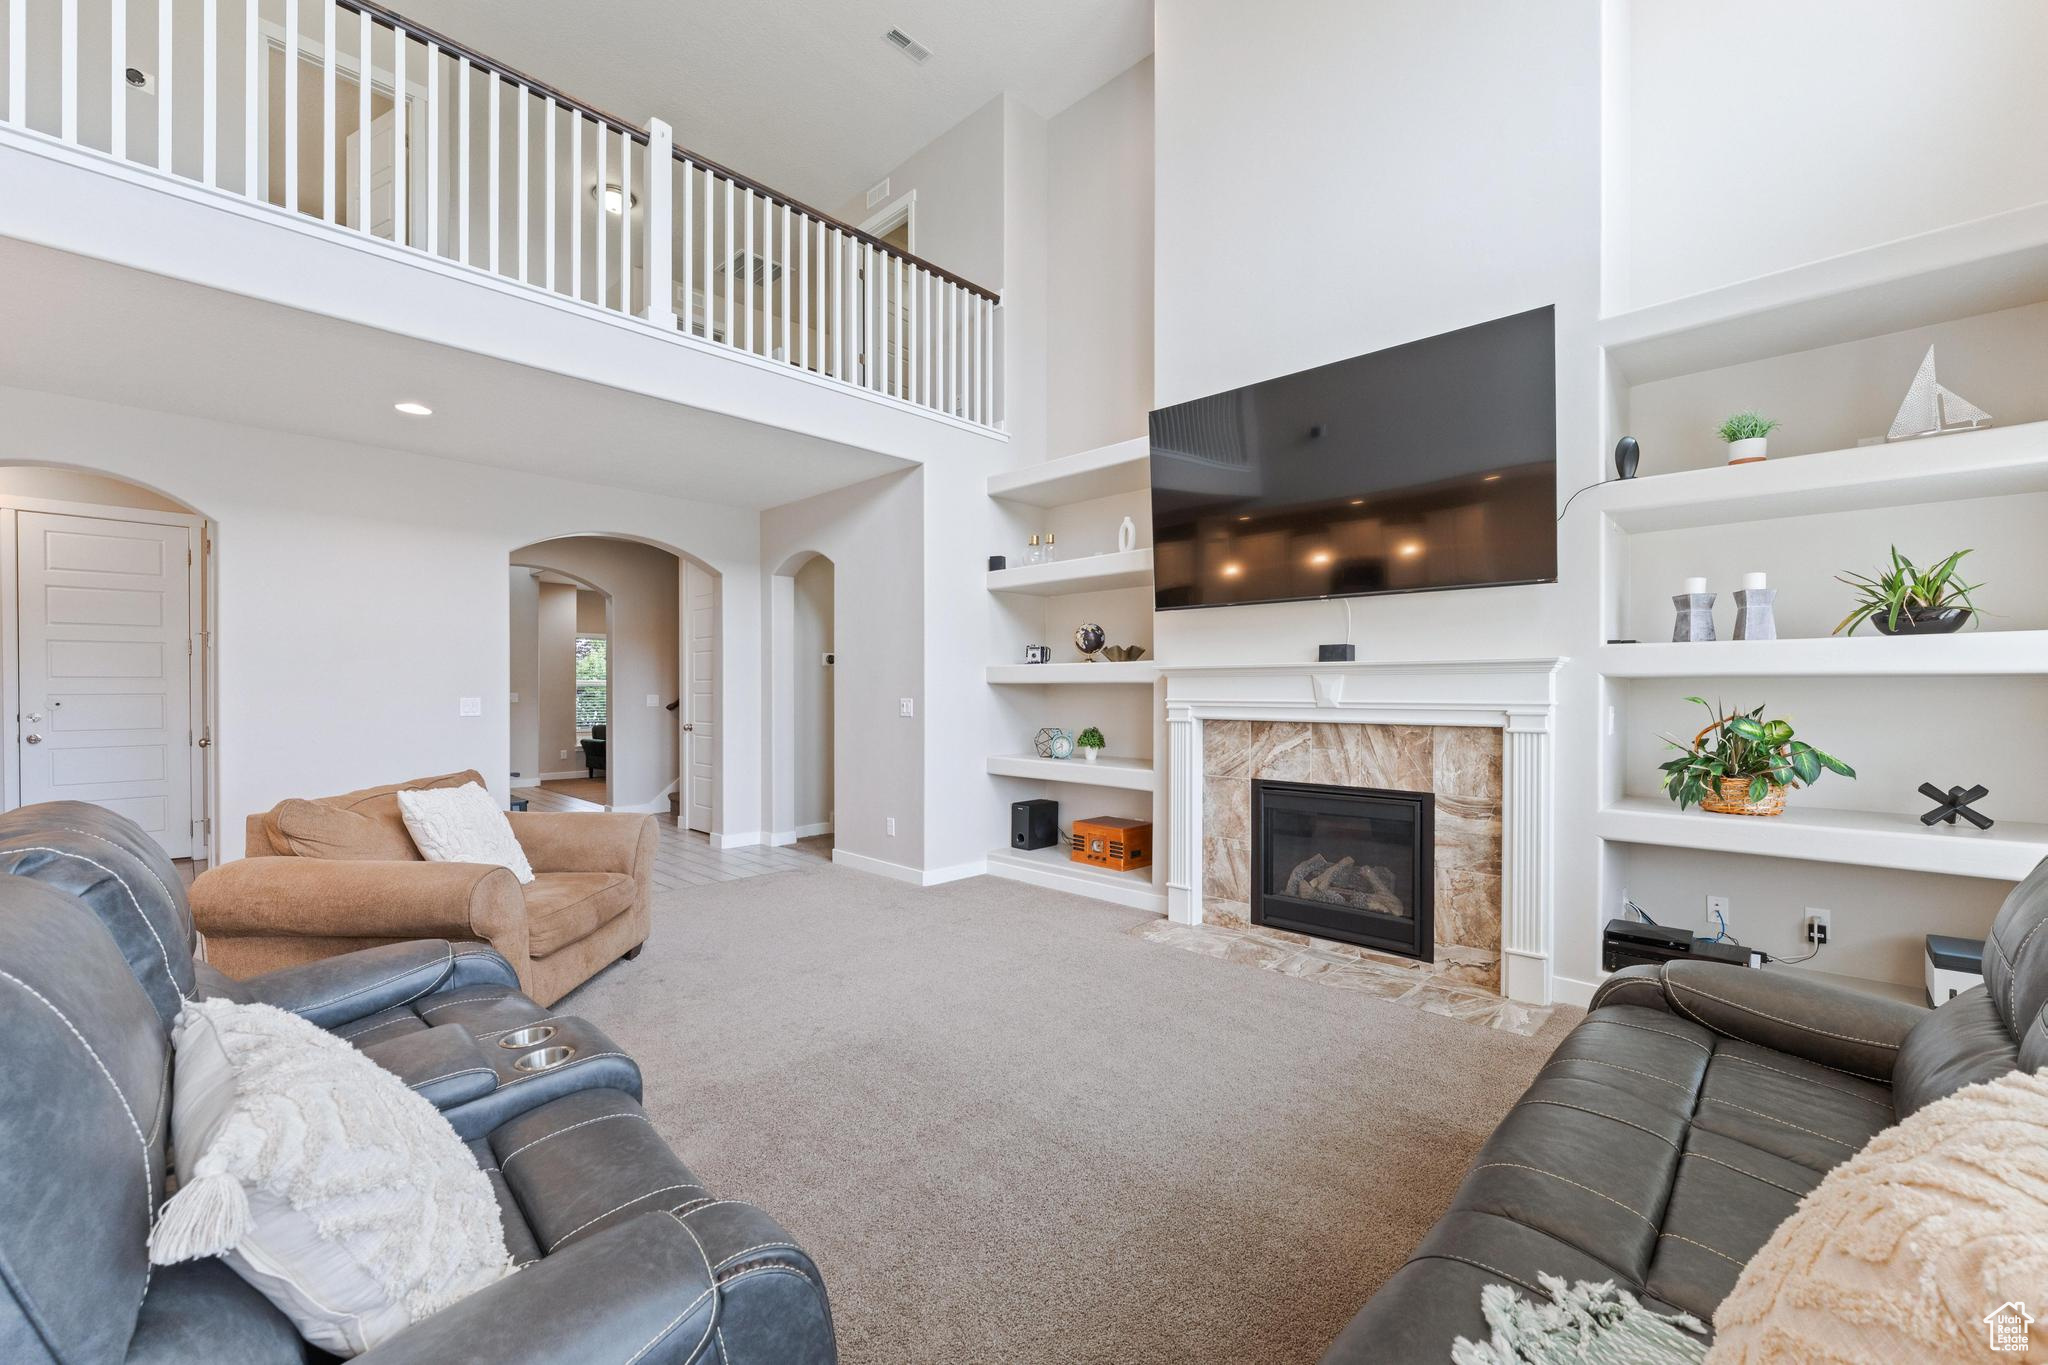
This well-appointed seven (7) bedroom (4) bathroom home on nearly a QUARTER-ACRE LOT with a full ACCESSORY APARTMENT is everything you've been looking for in your next chapter. This home's well designed floor plan contributes to a life well-lived. From the gorgeous FORMAL LIVING ROOM with a bay window and window seat, the flex space that could be used as a home office or FORMAL DINING ROOM, and the UPSTAIRS LOFT, there is flexibility here for every part of life to take shape. Picture this: You pull into your OVERSIZED 3-CAR GARAGE after getting back from a quick trip to Harmons at The District Shopping Center a few minutes away, and then head to your spacious, light-filled kitchen to unpack your groceries in the WALK-IN PANTRY. You whip out a charcuterie spread that looks gorgeous on your granite countertops before settling into the living room with your friends, who are already gathered around the FIREPLACE visiting and getting ready to watch the game. It's easy to relax and be present in your GREAT ROOM, which feels expansive and warm thanks to the soaring ceilings and ample oversized windows that flood it with natural light during the day. At some point during the evening, you pour yourself a glass of your favorite drink and head outside to your SPACIOUS, FENCED YARD and sit under the pergola to watch the sunset. You look over at the OUTDOOR BUILT-IN PIZZA OVEN AND GRILL and smile at all the late night memories you've made enjoying delicious food and relaxing with loved ones in this space. This backyard comes equipped with 220 V. TO SET UP A HOT TUB. By this point you've probably installed a jacuzzi, and you think you'll probably enjoy a dip in it tomorrow morning before you start your day. Or maybe you'll take a jog, stroll, or bike ride along the 50+ MILES OF MANICURED TRAILS that you can access steps away from your home. You love having the beautifully planned DAYBREAK COMMUNITY ADJACENT to your neighborhood. You get to enjoy all the perks of Daybreak living- such as parks, trails, summer concerts, and farmers markets- without the big HOA bill. When your guests leave, your SPA-LIKE ENSUITE BATHROOM AND LUXURIOUS WALK-IN CLOSET in the primary bedroom are waiting for you. You will have to decide whether to relax in your oversized shower or soaker tub, but you won't have to lug your clothes anywhere. Your beautiful walk-in closet with a window and seating also has its own laundry (one of THREE LAUNDRY ROOMS in this home). What a life! And it's all because you made it yours. Schedule your private showing with the listing agents or your favorite local Realtor today. All information including square footage figures are provided as a courtesy estimate only. Buyer advised to independently verify all information.
Build Your Team
Quickly find investor-friendly professionals who can help you succeed in real estate investing at any stage of the investing journey.


Agents
Match with investor-friendly agents who can help you find, analyze, and close your next deal


Lenders
Get the best funding…find investor-friendly lenders who specialize in your deal strategy


Property Managers
Transition to passive investing. Find a trusted property management partnership that lasts.


Tax Pros & Accountants
Taxes and financial reporting made easy—find experts to create tax savings strategies, file taxes, and more
Location
Property Details
Parking
- Description: Open, Covered, Garage
- Details: Attached
- Garage Spaces: 3
- Spaces Total: 9
Bedroom Information
- # of Bedrooms: 7
Bathroom Information
- # of Baths (Full): 4
- # of Baths (Partial): 1
- # of Baths (Total): 5.0
Interior Features
- # of Rooms: 24
- # of Stories: 3
- Basement: Yes
- Basement Description: Walk-Out Access
- Fireplace: Yes
Exterior Features
- Exterior Walls Materials: Stucco
- Roof Material: Asphalt, Metal
- Solar Panels: Yes
HOA
- Has HOA: Yes
- Association: Desert Edge
- HOA Fee: $24/monthly
Land Information
- Land Use: Residential
- Land Use Subtype: Planned Unit Development
Lot Information
- Parcel ID: 2719280026
- Lot Size: 9583 sqft
Property Information
- Property Type: Single Family Residence
- Style: Stories: 2
- Year Built: 2015
Tax Information
- Annual Tax: $4,827
Utilities
- Heating: Fireplace Insert, Central, Natural Gas, Forced Air
- Cooling: Ceiling Fan(s), Central Air
Location
- County: Salt Lake
Listing Details
Investment Summary
- Monthly Cash Flow
- -$2,596
- Cap Rate
- 2.8%
- Cash-on-Cash Return
- -12.3%
- Debt Coverage Ratio
- 0.50
- Internal Rate of Return (5 years)
- -7.9%
Cash Flow
Net Operating Income (NOI) minus mortgage payments.
Calculation:
NOI - Mortgage Payments
Cap Rate (Market Value)
Capitalization Rate is a rate of return that compares the yearly Net Operating Income (NOI) to the market value.
Calculation:
NOI / Market Value
Cash-on-Cash Return (CoC)
Annual Cash Flow / Cash Invested
Calculation:
Annual cash flow divided by initial cash invested.
Debt Coverage Ratio (DCR)
Net Operating Income (NOI) divided by total debt payments.
Calculation:
NOI / Total Debt Payments
Internal Rate of Return (IRR)
A metric for assessing profitability over time. IRR is the discount rate at which the net present value (NPV) of all future cash flows (positive and negative) from an investment equals zero — including both periodic cash flow (such as rent) and a projected sale at the end of the holding period. It represents the expected annualized return, accounting for income, expenses, and the recovery of capital through a future sale.
Purchase Details
Purchase PriceThe price paid for the property. Purchase price:
| $1,100,000 |
|---|---|
Amount FinancedThe amount of the purchase financed through a loan. Amount financed:
| -$880,000 |
Down paymentThe initial payment made towards the purchase. Down payment:
| $220,000 |
Closing CostsFees and expenses associated with purchasing a property, typically ranging from 2% to 5% of the home’s purchase price, paid at the end of a home purchase to cover services like lending, title transfer, and taxes. Closing costs:
| $33,000 |
Rehab CostsCosts incurred to repair or improve the property, including: roof, flooring, exterior siding, kitchen, exterior paint, bathrooms, etc. Rehab costs:
| $0 |
Initial Cash InvestedThe total initial cash invested in the property. Calculation:Down payment + Buying costs + Rehab costs Initial cash invested:
| $253,000 |
Square Feet (SQFT)The total square footage of the property. Square feet:
| 5,100 |
Cost Per Square FootCost per square foot of the property. Calculation:Purchase Price / Square Feet Cost per square foot:
| $216 |
Monthly Rent Per Square FootMonthly rent divided by the number of square feet. This ratio helps investors compare rental income efficiency across properties, markets, and unit sizes Calculation:Monthly Rent / Square Feet Monthly rent per square foot:
| $0.86 |
Financing Details
Loan AmountThe total sum of money borrowed from a lender to finance a property purchase. Calculation:Purchase Price - Down Payment
Loan amount:
| $880,000 |
|---|---|
Loan to Value Ratio (LTV)Loan amount divided by the market value of the property. Calculation:Loan Amount / Market Value
Loan to value ratio:
| 80.0% |
Loan TypeThe type of loan (e.g., fixed, adjustable).
Loan type:
| Amortizing |
TermThe loan repayment period in years.
Term:
| 30 years |
Interest RateThe percentage a lender charges on the borrowed amount of a loan, determining the cost of borrowing money.
Interest rate:
| 5.875% |
Principal & Interest (PI)The principal is the portion of the loan payment that reduces the loan balance. The interest is the lender's charge for borrowing money. Calculation:(P * r * (1 + r) ** n) / ((1 + r) ** n - 1) Where:
P = Loan amount (principal)
Principal & interest:
| $5,206 |
Property TaxesAnnual taxes levied by local governments on real estate properties. These taxes fund public services like schools, roads, and emergency services.
Property tax:
| $402 |
InsuranceThe costs for insurance coverage to protect against financial losses due to risks like fire, natural disasters, theft, liability, or tenant-related damages. Calculation:Assumes 7% of gross rental income, unless insurance rates are specified.
Insurance:
| $308 |
Private Mortgage Insurance (PMI)A fee that borrowers pay when they take out a conventional loan with a loan-to-value (LTV) ratio above 80%.
Private mortgage insurance (PMI):
| $0 |
Monthly PaymentThe fixed amount a borrower pays each month to repay a loan. It typically includes principal and interest (P&I) and may also cover property taxes, insurance, HOA fees, and PMI if escrowed. Monthly payment:
| $5,916 |
Operating Income
| % Rent | Monthly | Yearly | |
|---|---|---|---|
Gross RentThe total rental income received from tenants before deducting any expenses. Includes base rent, late fees, pet fees, parking fees, and other recurring charges.
Gross rent:
| $4,400 | $52,800 | |
Vacancy LossExpected loss of rent due to vacancies.
Vacancy loss:
(6%)
| 6% | -$264 | -$3,168 |
Operating IncomeGross rental income minus vacancy loss. Calculation:Gross rent - Vacancy loss
Operating income:
| $4,136 | $49,632 |
Operating Expenses
| % Rent | Monthly | Yearly | |
|---|---|---|---|
Property TaxesAnnual taxes levied by local governments on real estate properties. These taxes fund public services like schools, roads, and emergency services. | 9% | -$402 | -$4,827 |
InsuranceThe costs for insurance coverage to protect against financial losses due to risks like fire, natural disasters, theft, liability, or tenant-related damages. Calculation:Assumes 7% of gross rental income, unless insurance rates are specified. | 7% | -$308 | -$3,696 |
Property ManagementThe costs associated with hiring a property manager to handle the day-to-day operations of a rental property. Includes management fees, leasing fes, eviction fees, etc. Calculation:Assumes 8% of gross rental income. | 8% | -$352 | -$4,224 |
Repairs & MaintenanceOngoing costs for routine upkeep and minor fixes needed to keep a property in good working condition. Calculation:Assumes 5% of gross rental income. Varies by property age and condition. | 5% | -$220 | -$2,640 |
Capital ExpensesLarge, infrequent costs for major improvements or replacements, like a new roof, HVAC system, or appliances. Calculation:Assumes 5% of gross rental income. Varies by property age. | 5% | -$220 | -$2,640 |
HOA FeesRegular dues paid to a Homeowners Association for community maintenance, amenities, and management. Similar fees include: Condo Association Fees, Co-op Maintenance Fees, etc. | 1% | -$24 | -$288 |
Operating ExpensesRecurring costs required to maintain and manage a rental property, including property taxes, insurance, maintenance, repairs, utilities (if paid by the owner), property management fees, and other day-to-day expenses. Calculation:Insurance + Property Taxes + Property Management + Repairs & Maintenance + Capital Expenditures + HOA Fees | 35% | -$1,526 | -$18,315 |
Cash Flow
| Monthly | Yearly | |
|---|---|---|
Net Operating Income (NOI)The income generated from a property after deducting all operating expenses but before deducting mortgage payments, taxes, and capital expenditures. Calculation:Gross Operating Income - Operating Expenses
Net operating income:
| $2,610 | $31,320 |
Mortgage PaymentThe fixed amount a borrower pays each month to repay a loan. It typically includes principal and interest (P&I) and may also cover property taxes, insurance, HOA fees, and PMI if escrowed. | -$5,206 | -$62,472 |
Cash FlowNet Operating Income (NOI) minus mortgage payments. Calculation:NOI - Mortgage Payments | $2,596 | $31,152 |