
$895,000
Investment Summary
- Monthly Cash Flow
- -$2,801
- Cap Rate
- 2.4%
- Cash-on-Cash Return
- -16.3%
- Debt Coverage Ratio
- 0.39
- Internal Rate of Return (5 years)
- -11.8%
Cash Flow
Net Operating Income (NOI) minus mortgage payments.
Calculation:
NOI - Mortgage Payments
Cap Rate (Market Value)
Capitalization Rate is a rate of return that compares the yearly Net Operating Income (NOI) to the market value.
Calculation:
NOI / Market Value
Cash-on-Cash Return (CoC)
Annual Cash Flow / Cash Invested
Calculation:
Annual cash flow divided by initial cash invested.
Debt Coverage Ratio (DCR)
Net Operating Income (NOI) divided by total debt payments.
Calculation:
NOI / Total Debt Payments
Internal Rate of Return (IRR)
A metric for assessing profitability over time. IRR is the discount rate at which the net present value (NPV) of all future cash flows (positive and negative) from an investment equals zero — including both periodic cash flow (such as rent) and a projected sale at the end of the holding period. It represents the expected annualized return, accounting for income, expenses, and the recovery of capital through a future sale.
Property Description
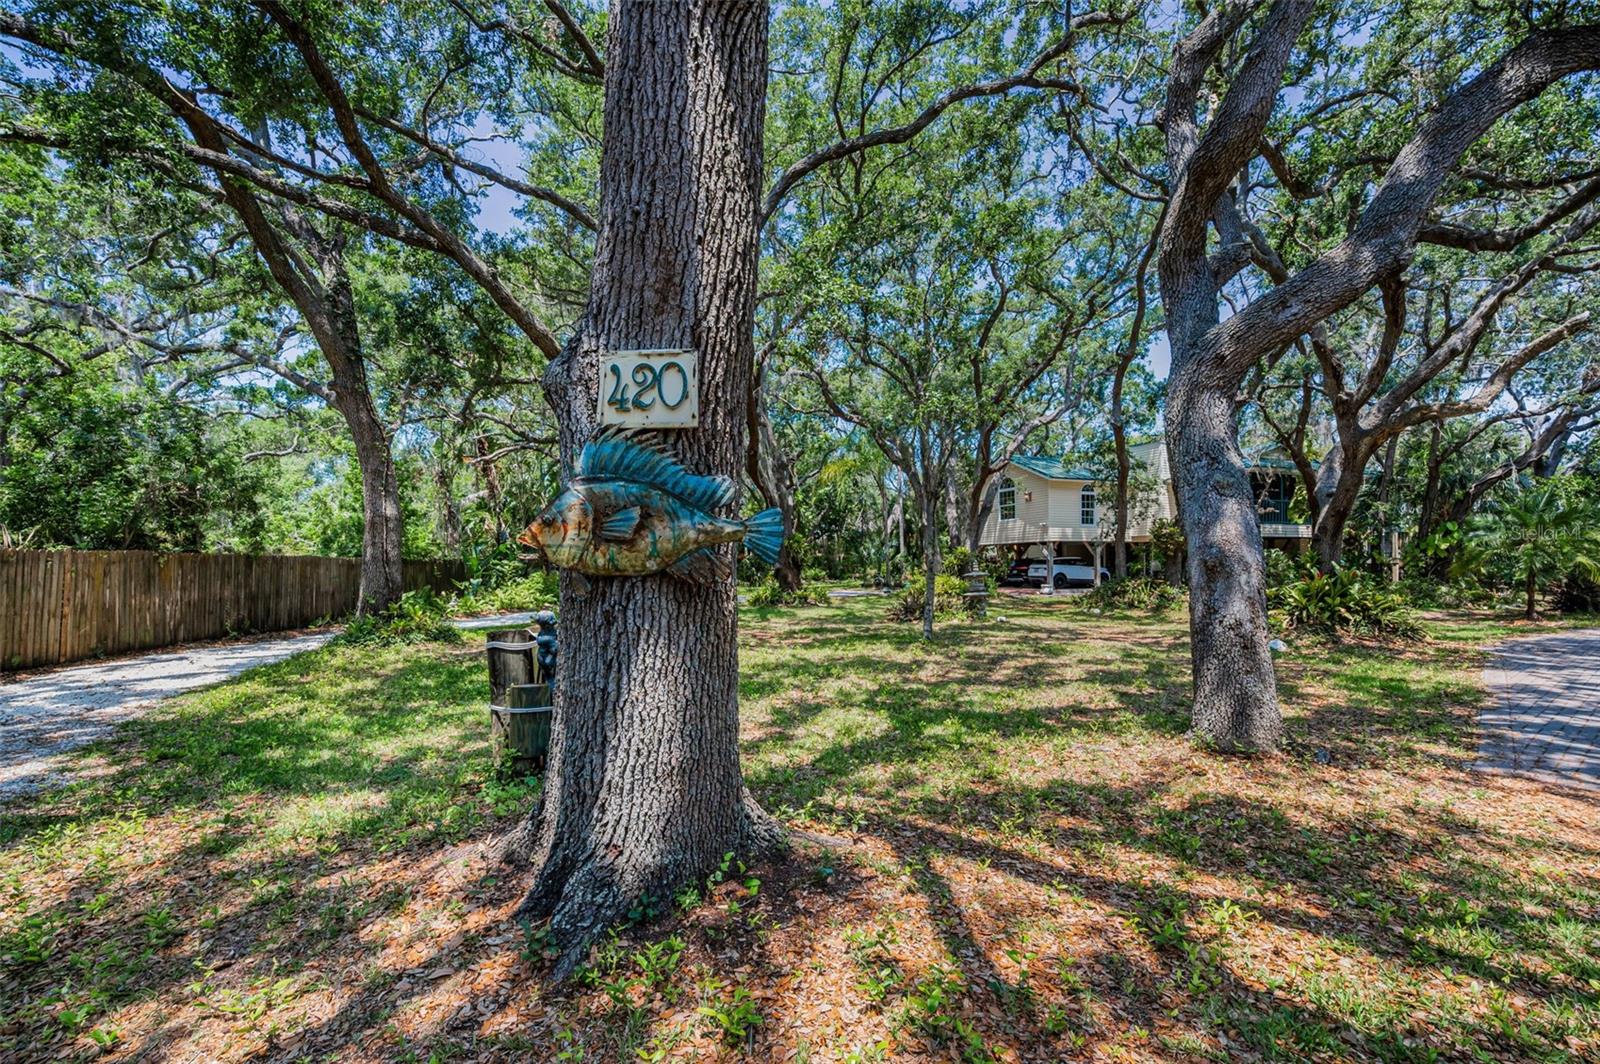
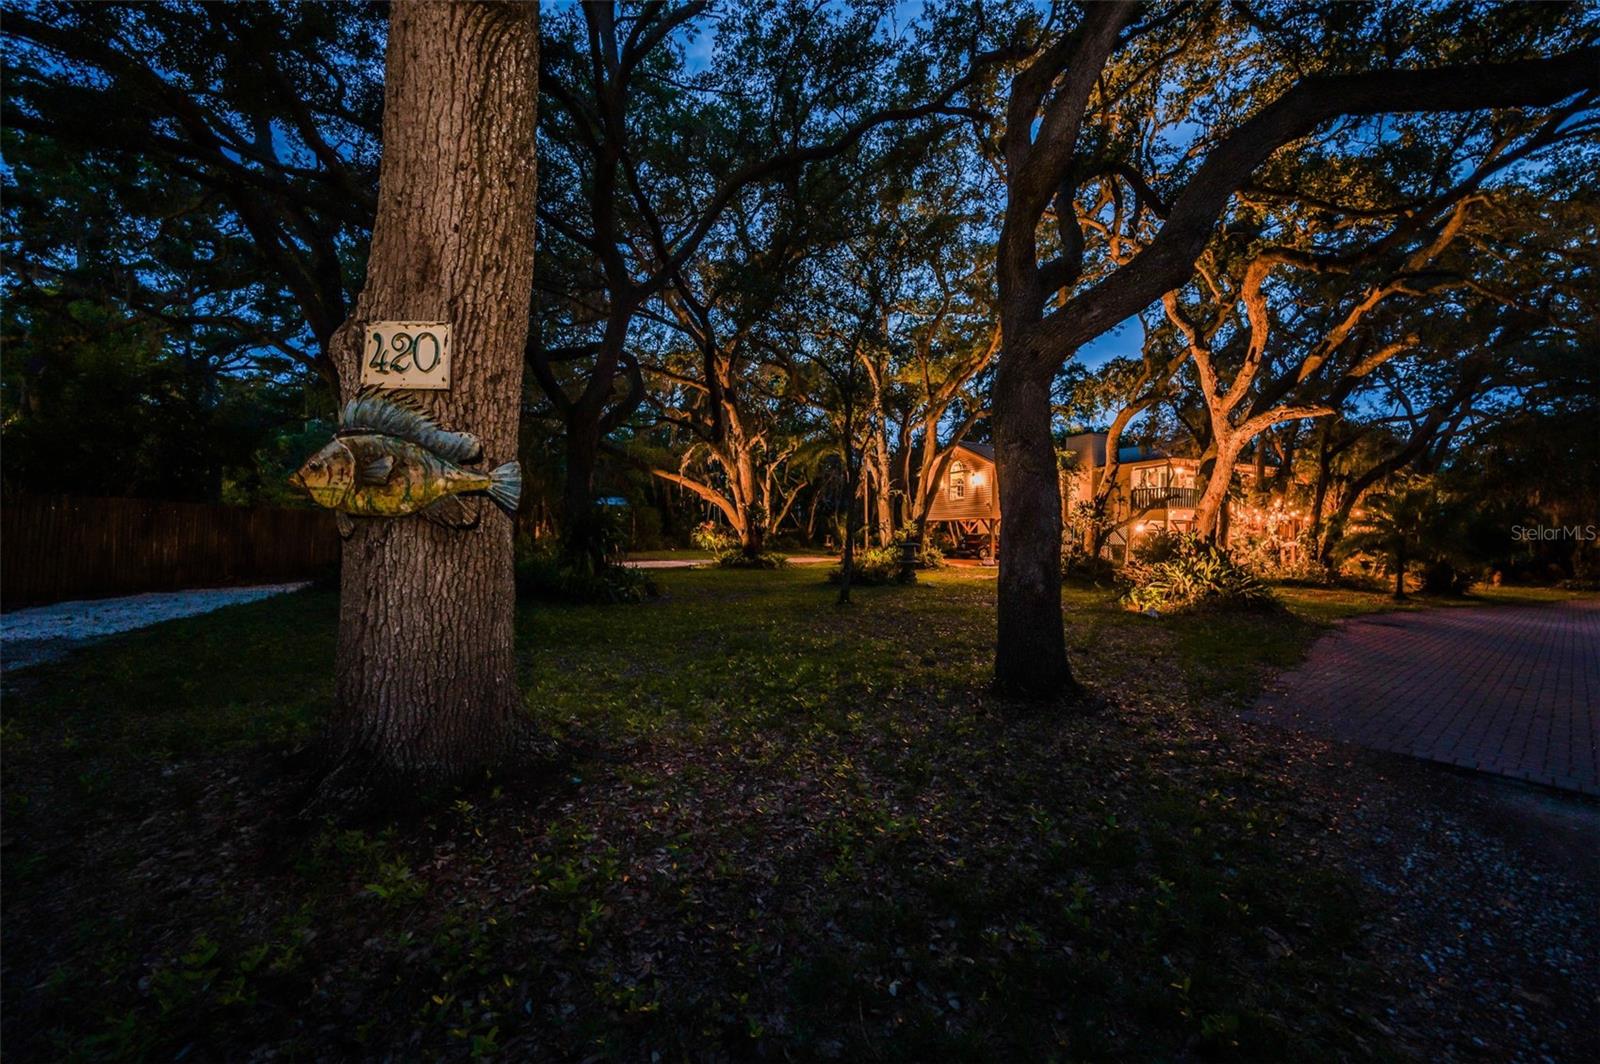
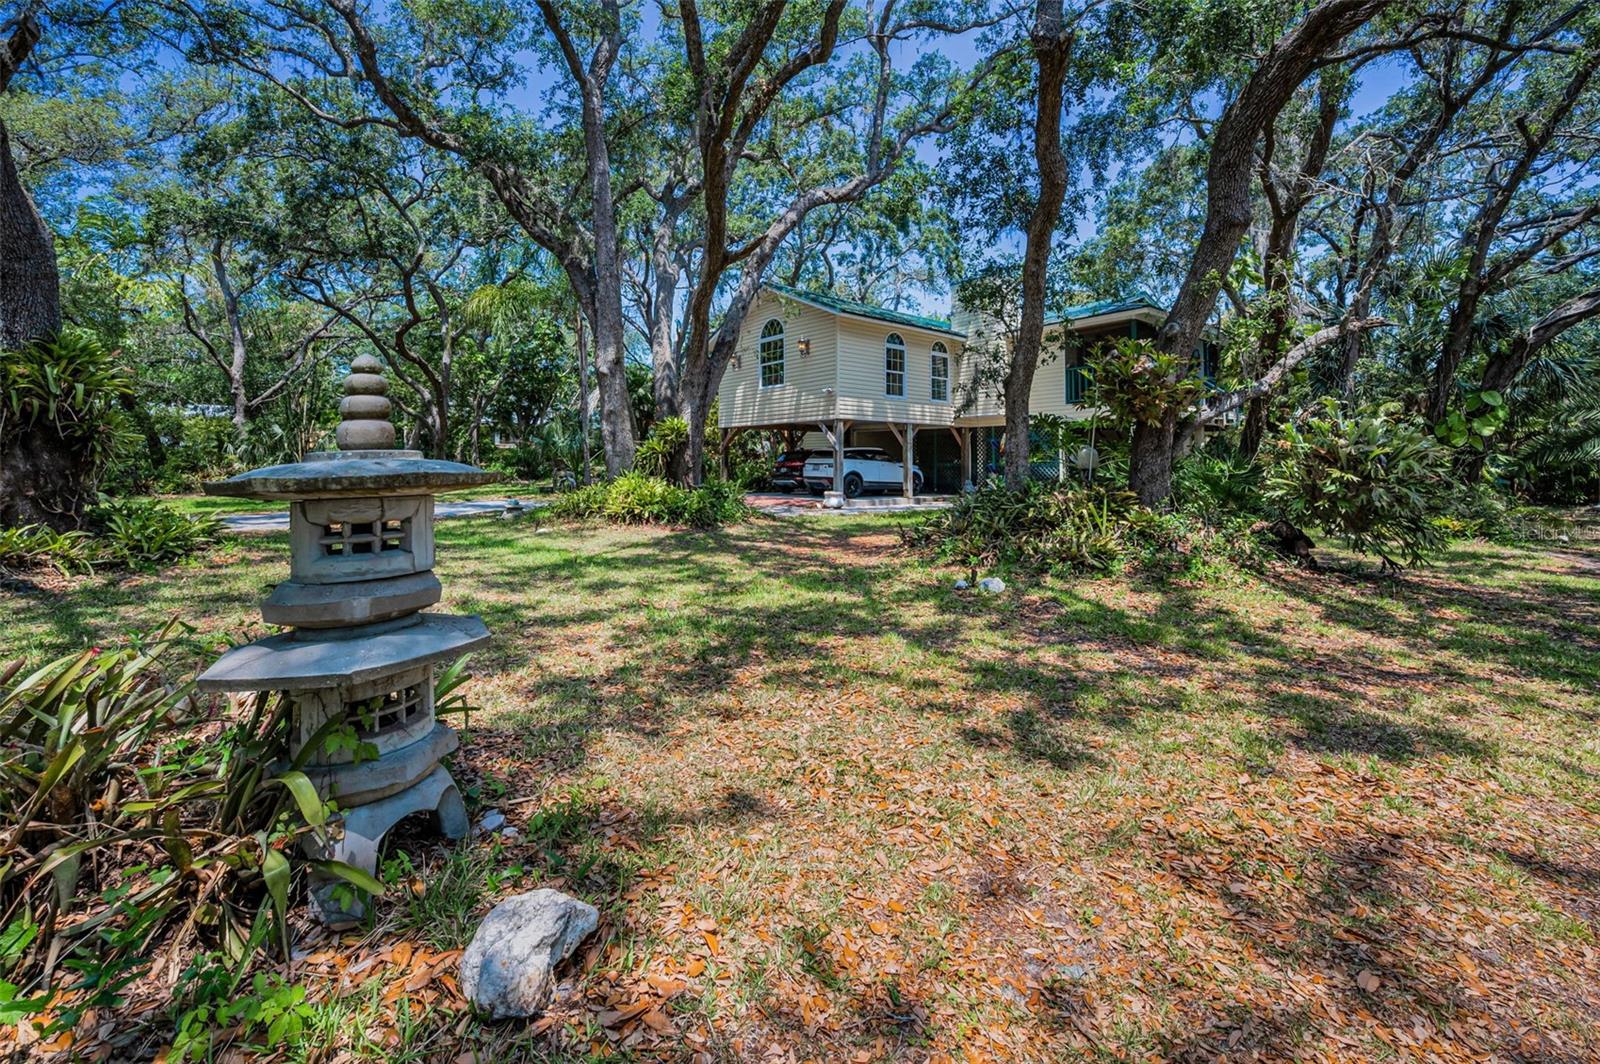
Tucked away in the serene and historic community of Crystal Beach, Florida, this secluded 0.58-acre property offers a rare opportunity to experience coastal living at its finest. Parcel of land is large enough to divide in two. As you journey down the private road, a distinctive metal fish hanging from a tree marks the entrance to this hidden gem. The stone driveway meanders through a lush landscape adorned with majestic century-old oak trees, graced with 8 grand staghorn ferns, and a variety of tropical plants that create a tranquil and inviting atmosphere. Ascending the exterior staircase, you're welcomed by a spacious wrap-around screened porch, perfect for savoring the gentle coastal breezes and panoramic views. Inside, the open-concept living area features bamboo flooring, a cozy gas-burning fireplace, and a galley-style kitchen with a convenient breakfast bar. The adjacent sunroom, bathed in natural light through its expansive windows and vaulted ceiling, boasts a striking chandelier and can easily serve as a third bedroom, complete with two large storage closets. The generously sized primary bedroom comfortably accommodates king-size furniture and includes a walk-in closet. French doors lead to an en-suite bathroom featuring a walk-in shower and a luxurious slipper tub, strategically positioned to offer tranquil garden views—perfect for unwinding after a long day. Additional amenities include laundry hookups both in a hall closet within the main house and in the carport storage room, as well as covered carport parking for up to three vehicles. The back property line is fenced and offers direct gated access to the Pinellas Trail, ideal for walking, biking, and enjoying the outdoors. Just a short stroll away, you'll find Live Oak Park, Gulf Shore Park, scenic shoreline walking paths, and a new community pier currently under construction. Crystal Beach is renowned for its laid-back, coastal lifestyle and rich history dating back to the 1900s. Residents enjoy easy access to the Gulf waters, opportunities for kayaking and paddleboarding in calm bays and inlets, and a close-knit community atmosphere. The area's charm is further enhanced by its proximity to historic Tarpon Springs and Ozona, offering a blend of cultural experiences and natural beauty. With ample space for recreational vehicles and the freedom to personalize your property, this home presents endless possibilities. Whether you're seeking a peaceful retreat, a family residence, or a unique investment opportunity, this Crystal Beach haven is ready to fulfill your vision. This exclusive property is available by appointment only, with access via a private road. Don't miss the chance to own a slice of paradise in one of Florida's most desirable coastal communities. Contact us today to arrange your private viewing. As the locals say, "If you're lucky enough to live in Crystal Beach, you're lucky enough."
Build Your Team
Quickly find investor-friendly professionals who can help you succeed in real estate investing at any stage of the investing journey.


Agents
Match with investor-friendly agents who can help you find, analyze, and close your next deal


Lenders
Get the best funding…find investor-friendly lenders who specialize in your deal strategy


Property Managers
Transition to passive investing. Find a trusted property management partnership that lasts.


Tax Pros & Accountants
Taxes and financial reporting made easy—find experts to create tax savings strategies, file taxes, and more
Location
Property Details
Parking
- Description: Carport
- Details: Tandem, Basement
- Garage Spaces: 0
- Spaces Total: 0
Bedroom Information
- # of Bedrooms: 2
Bathroom Information
- # of Baths (Full): 2
- # of Baths (Total): 2.0
Interior Features
- # of Rooms: 7
- # of Stories: 1
- Fireplace: Yes
Exterior Features
- Exterior Walls Materials: Wood
- Foundation: Slab
- Roof Type: Gable
- Roof Material: Metal
Land Information
- Land Use: Residential
- Land Use Subtype: Single Family Residential
Lot Information
- Parcel ID: 352715000002301510
- Lot Size: 24921 sqft
Property Information
- Property Type: Single Family Residence
- Style: Coastal, Elevated, Florida
- Year Built: 1981
Tax Information
- Annual Tax: $2,597
Utilities
- Water & Sewer: Public
- Heating: Central
- Cooling: Central Air
Location
- County: Pinellas
Listing Details
Investment Summary
- Monthly Cash Flow
- -$2,801
- Cap Rate
- 2.4%
- Cash-on-Cash Return
- -16.3%
- Debt Coverage Ratio
- 0.39
- Internal Rate of Return (5 years)
- -11.8%
Cash Flow
Net Operating Income (NOI) minus mortgage payments.
Calculation:
NOI - Mortgage Payments
Cap Rate (Market Value)
Capitalization Rate is a rate of return that compares the yearly Net Operating Income (NOI) to the market value.
Calculation:
NOI / Market Value
Cash-on-Cash Return (CoC)
Annual Cash Flow / Cash Invested
Calculation:
Annual cash flow divided by initial cash invested.
Debt Coverage Ratio (DCR)
Net Operating Income (NOI) divided by total debt payments.
Calculation:
NOI / Total Debt Payments
Internal Rate of Return (IRR)
A metric for assessing profitability over time. IRR is the discount rate at which the net present value (NPV) of all future cash flows (positive and negative) from an investment equals zero — including both periodic cash flow (such as rent) and a projected sale at the end of the holding period. It represents the expected annualized return, accounting for income, expenses, and the recovery of capital through a future sale.
Purchase Details
Purchase PriceThe price paid for the property. Purchase price:
| $895,000 |
|---|---|
Amount FinancedThe amount of the purchase financed through a loan. Amount financed:
| -$716,000 |
Down paymentThe initial payment made towards the purchase. Down payment:
| $179,000 |
Closing CostsFees and expenses associated with purchasing a property, typically ranging from 2% to 5% of the home’s purchase price, paid at the end of a home purchase to cover services like lending, title transfer, and taxes. Closing costs:
| $26,850 |
Rehab CostsCosts incurred to repair or improve the property, including: roof, flooring, exterior siding, kitchen, exterior paint, bathrooms, etc. Rehab costs:
| $0 |
Initial Cash InvestedThe total initial cash invested in the property. Calculation:Down payment + Buying costs + Rehab costs Initial cash invested:
| $205,850 |
Square Feet (SQFT)The total square footage of the property. Square feet:
| 1,844 |
Cost Per Square FootCost per square foot of the property. Calculation:Purchase Price / Square Feet Cost per square foot:
| $485 |
Monthly Rent Per Square FootMonthly rent divided by the number of square feet. This ratio helps investors compare rental income efficiency across properties, markets, and unit sizes Calculation:Monthly Rent / Square Feet Monthly rent per square foot:
| $1.57 |
Financing Details
Loan AmountThe total sum of money borrowed from a lender to finance a property purchase. Calculation:Purchase Price - Down Payment
Loan amount:
| $716,000 |
|---|---|
Loan to Value Ratio (LTV)Loan amount divided by the market value of the property. Calculation:Loan Amount / Market Value
Loan to value ratio:
| 80.0% |
Loan TypeThe type of loan (e.g., fixed, adjustable).
Loan type:
| Amortizing |
TermThe loan repayment period in years.
Term:
| 30 years |
Interest RateThe percentage a lender charges on the borrowed amount of a loan, determining the cost of borrowing money.
Interest rate:
| 6.625% |
Principal & Interest (PI)The principal is the portion of the loan payment that reduces the loan balance. The interest is the lender's charge for borrowing money. Calculation:(P * r * (1 + r) ** n) / ((1 + r) ** n - 1) Where:
P = Loan amount (principal)
Principal & interest:
| $4,585 |
Property TaxesAnnual taxes levied by local governments on real estate properties. These taxes fund public services like schools, roads, and emergency services.
Property tax:
| $217 |
InsuranceThe costs for insurance coverage to protect against financial losses due to risks like fire, natural disasters, theft, liability, or tenant-related damages. Calculation:Assumes 7% of gross rental income, unless insurance rates are specified.
Insurance:
| $203 |
Private Mortgage Insurance (PMI)A fee that borrowers pay when they take out a conventional loan with a loan-to-value (LTV) ratio above 80%.
Private mortgage insurance (PMI):
| $0 |
Monthly PaymentThe fixed amount a borrower pays each month to repay a loan. It typically includes principal and interest (P&I) and may also cover property taxes, insurance, HOA fees, and PMI if escrowed. Monthly payment:
| $5,005 |
Operating Income
| % Rent | Monthly | Yearly | |
|---|---|---|---|
Gross RentThe total rental income received from tenants before deducting any expenses. Includes base rent, late fees, pet fees, parking fees, and other recurring charges.
Gross rent:
| $2,900 | $34,800 | |
Vacancy LossExpected loss of rent due to vacancies.
Vacancy loss:
(6%)
| 6% | -$174 | -$2,088 |
Operating IncomeGross rental income minus vacancy loss. Calculation:Gross rent - Vacancy loss
Operating income:
| $2,726 | $32,712 |
Operating Expenses
| % Rent | Monthly | Yearly | |
|---|---|---|---|
Property TaxesAnnual taxes levied by local governments on real estate properties. These taxes fund public services like schools, roads, and emergency services. | 7% | -$217 | -$2,598 |
InsuranceThe costs for insurance coverage to protect against financial losses due to risks like fire, natural disasters, theft, liability, or tenant-related damages. Calculation:Assumes 7% of gross rental income, unless insurance rates are specified. | 7% | -$203 | -$2,436 |
Property ManagementThe costs associated with hiring a property manager to handle the day-to-day operations of a rental property. Includes management fees, leasing fes, eviction fees, etc. Calculation:Assumes 8% of gross rental income. | 8% | -$232 | -$2,784 |
Repairs & MaintenanceOngoing costs for routine upkeep and minor fixes needed to keep a property in good working condition. Calculation:Assumes 5% of gross rental income. Varies by property age and condition. | 5% | -$145 | -$1,740 |
Capital ExpensesLarge, infrequent costs for major improvements or replacements, like a new roof, HVAC system, or appliances. Calculation:Assumes 5% of gross rental income. Varies by property age. | 5% | -$145 | -$1,740 |
HOA FeesRegular dues paid to a Homeowners Association for community maintenance, amenities, and management. Similar fees include: Condo Association Fees, Co-op Maintenance Fees, etc. | n/a | n/a | n/a |
Operating ExpensesRecurring costs required to maintain and manage a rental property, including property taxes, insurance, maintenance, repairs, utilities (if paid by the owner), property management fees, and other day-to-day expenses. Calculation:Insurance + Property Taxes + Property Management + Repairs & Maintenance + Capital Expenditures + HOA Fees | 32% | -$942 | -$11,298 |
Cash Flow
| Monthly | Yearly | |
|---|---|---|
Net Operating Income (NOI)The income generated from a property after deducting all operating expenses but before deducting mortgage payments, taxes, and capital expenditures. Calculation:Gross Operating Income - Operating Expenses
Net operating income:
| $1,784 | $21,408 |
Mortgage PaymentThe fixed amount a borrower pays each month to repay a loan. It typically includes principal and interest (P&I) and may also cover property taxes, insurance, HOA fees, and PMI if escrowed. | -$4,585 | -$55,020 |
Cash FlowNet Operating Income (NOI) minus mortgage payments. Calculation:NOI - Mortgage Payments | $2,801 | $33,612 |