$399,000
Investment Summary
- Monthly Cash Flow
- -$633
- Cap Rate
- 3.8%
- Cash-on-Cash Return
- -8.3%
- Debt Coverage Ratio
- 0.66
- Internal Rate of Return (5 years)
- -4.0%
Cash Flow
Net Operating Income (NOI) minus mortgage payments.
Calculation:
NOI - Mortgage Payments
Cap Rate (Market Value)
Capitalization Rate is a rate of return that compares the yearly Net Operating Income (NOI) to the market value.
Calculation:
NOI / Market Value
Cash-on-Cash Return (CoC)
Annual Cash Flow / Cash Invested
Calculation:
Annual cash flow divided by initial cash invested.
Debt Coverage Ratio (DCR)
Net Operating Income (NOI) divided by total debt payments.
Calculation:
NOI / Total Debt Payments
Internal Rate of Return (IRR)
A metric for assessing profitability over time. IRR is the discount rate at which the net present value (NPV) of all future cash flows (positive and negative) from an investment equals zero — including both periodic cash flow (such as rent) and a projected sale at the end of the holding period. It represents the expected annualized return, accounting for income, expenses, and the recovery of capital through a future sale.
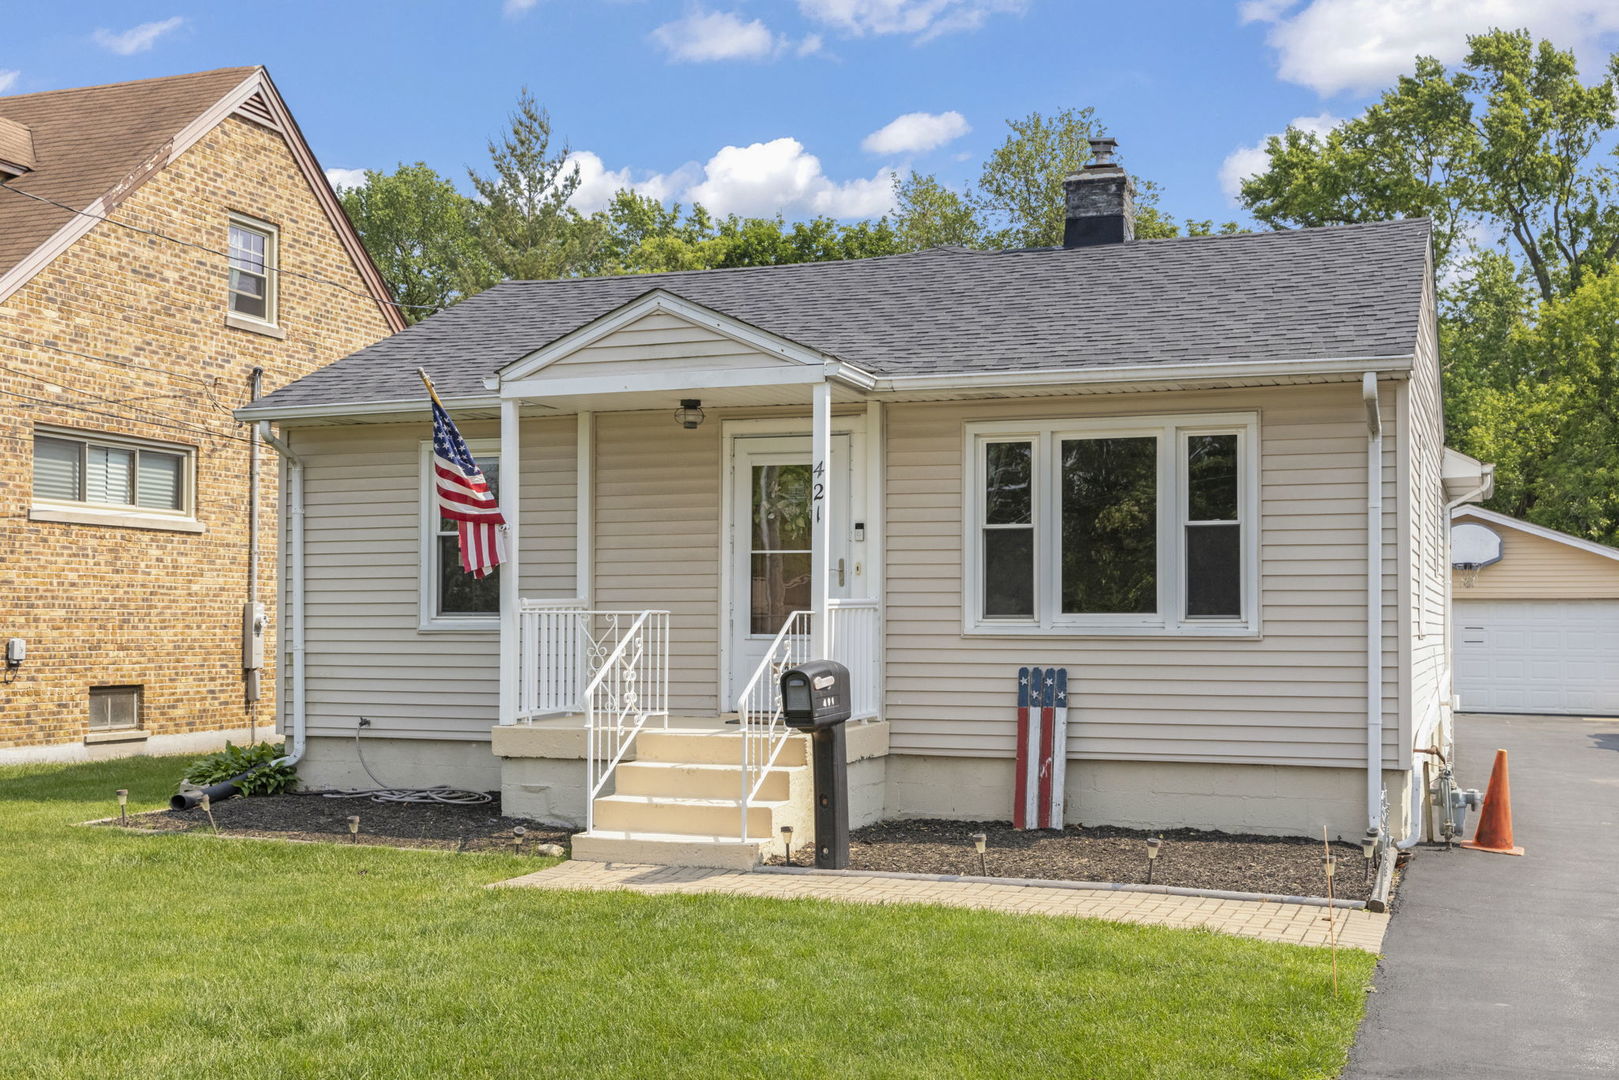
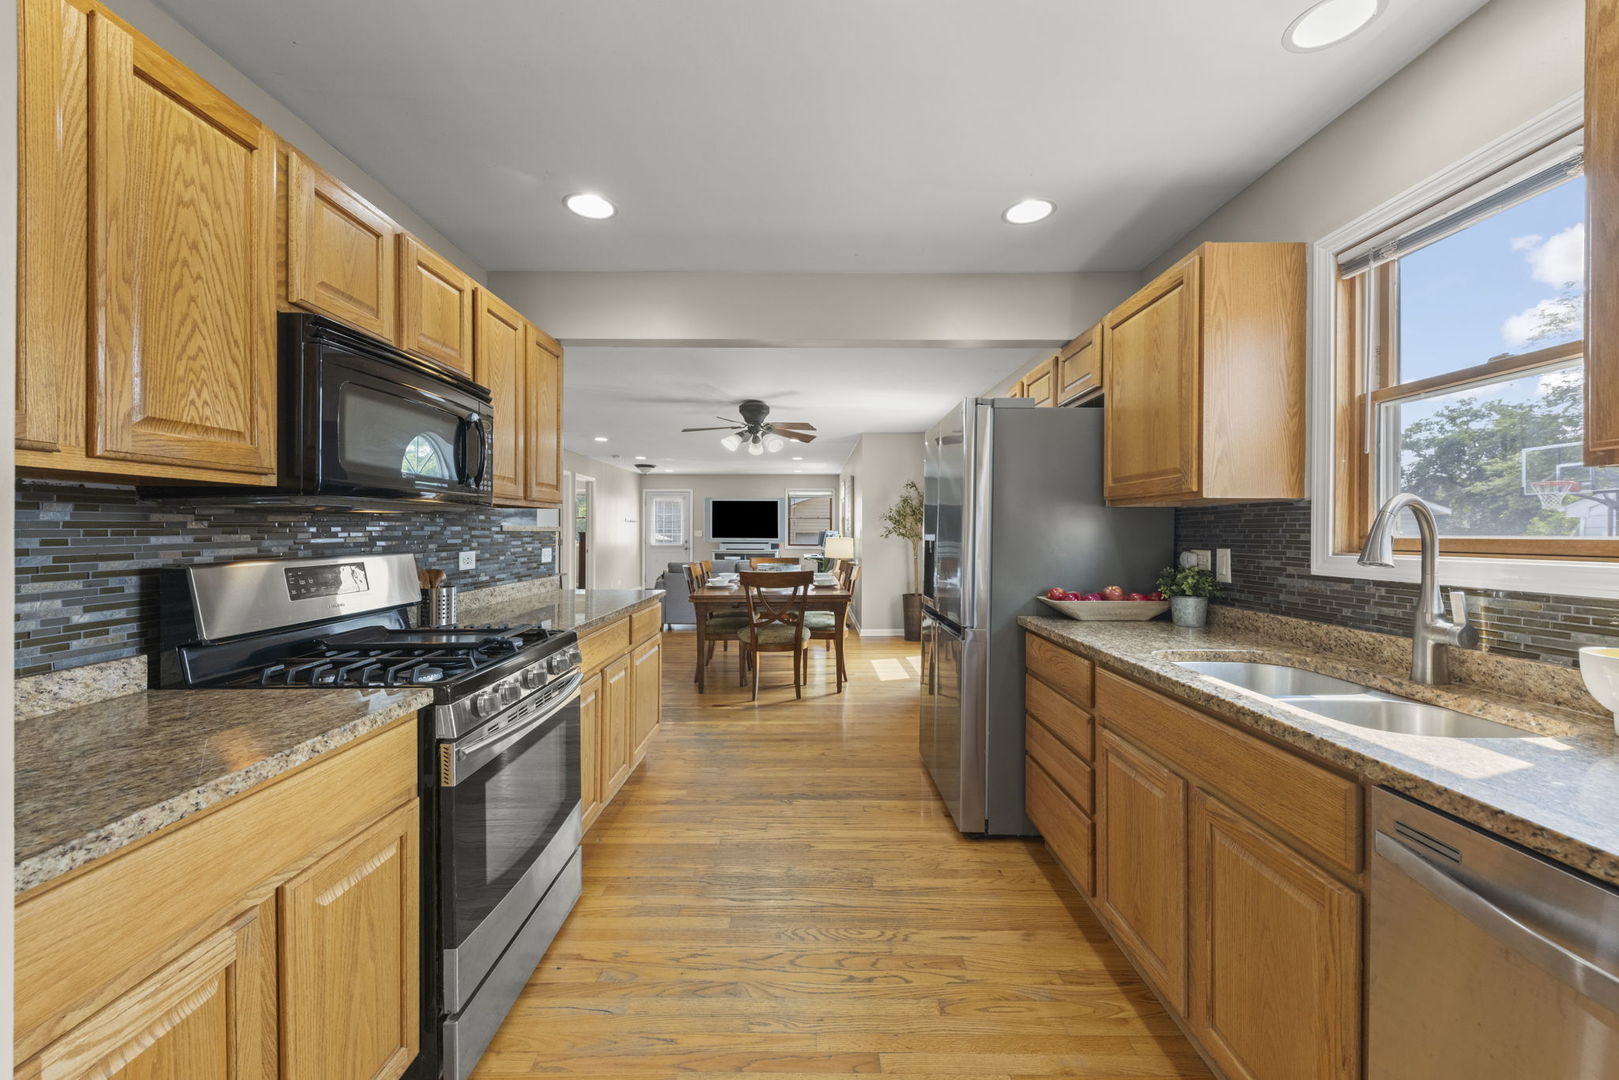
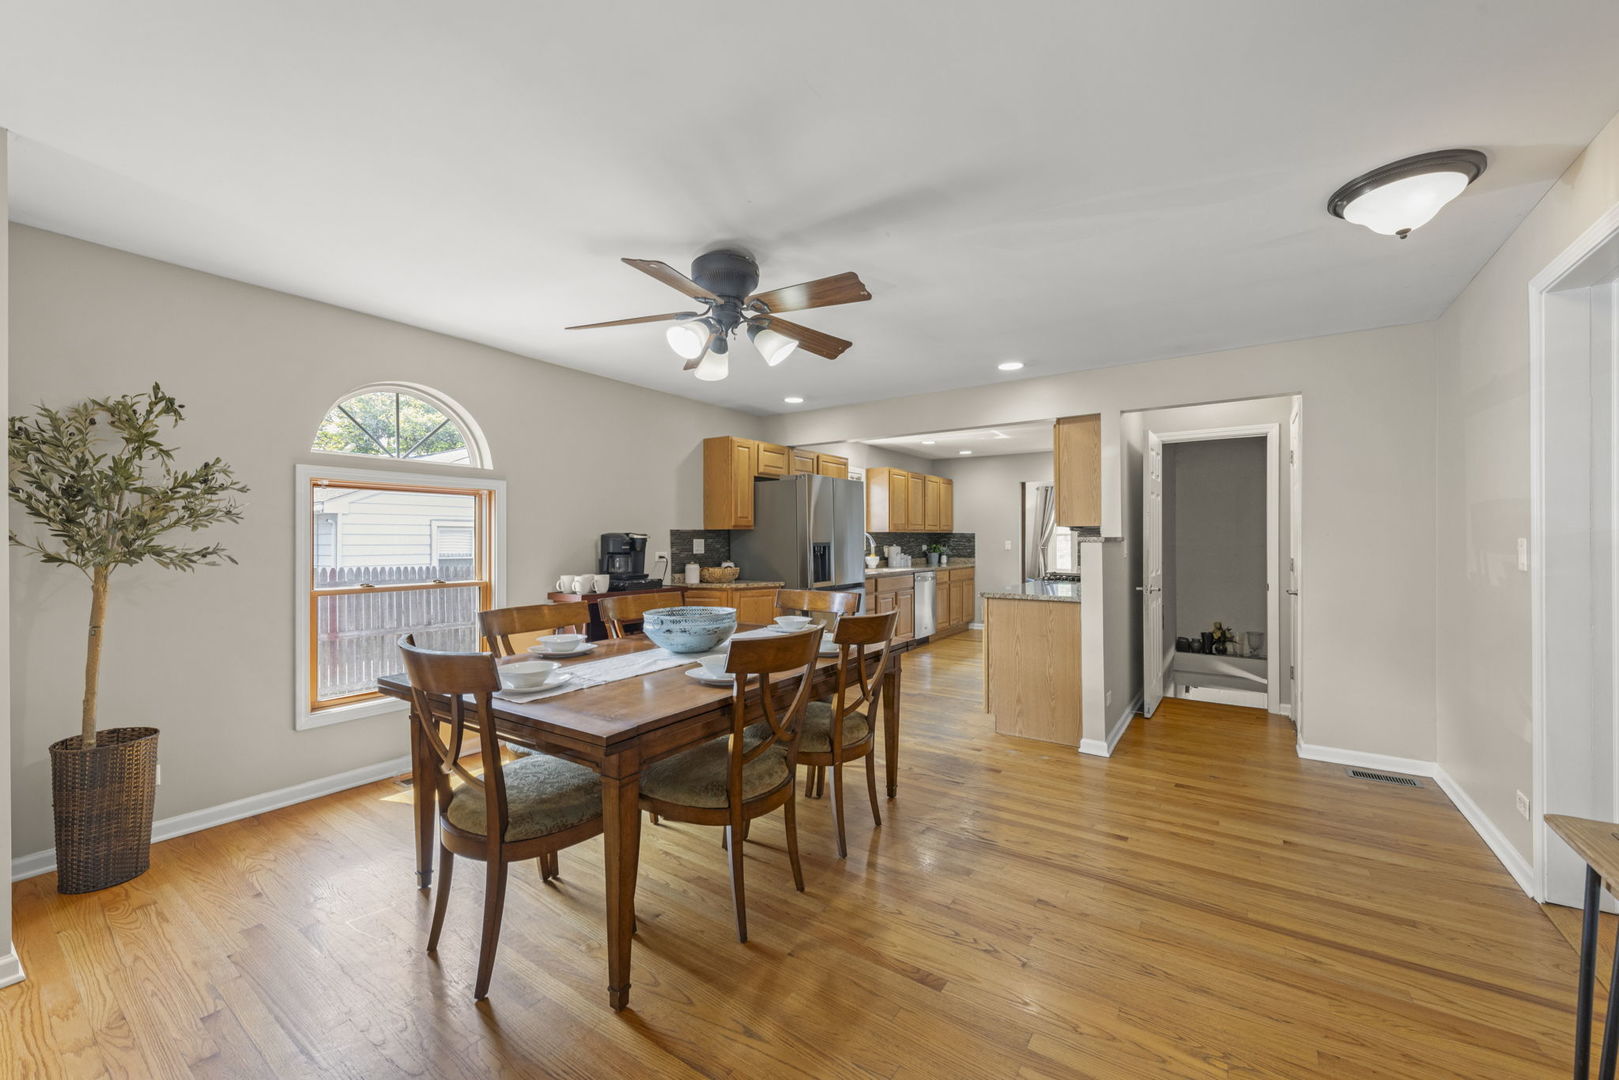
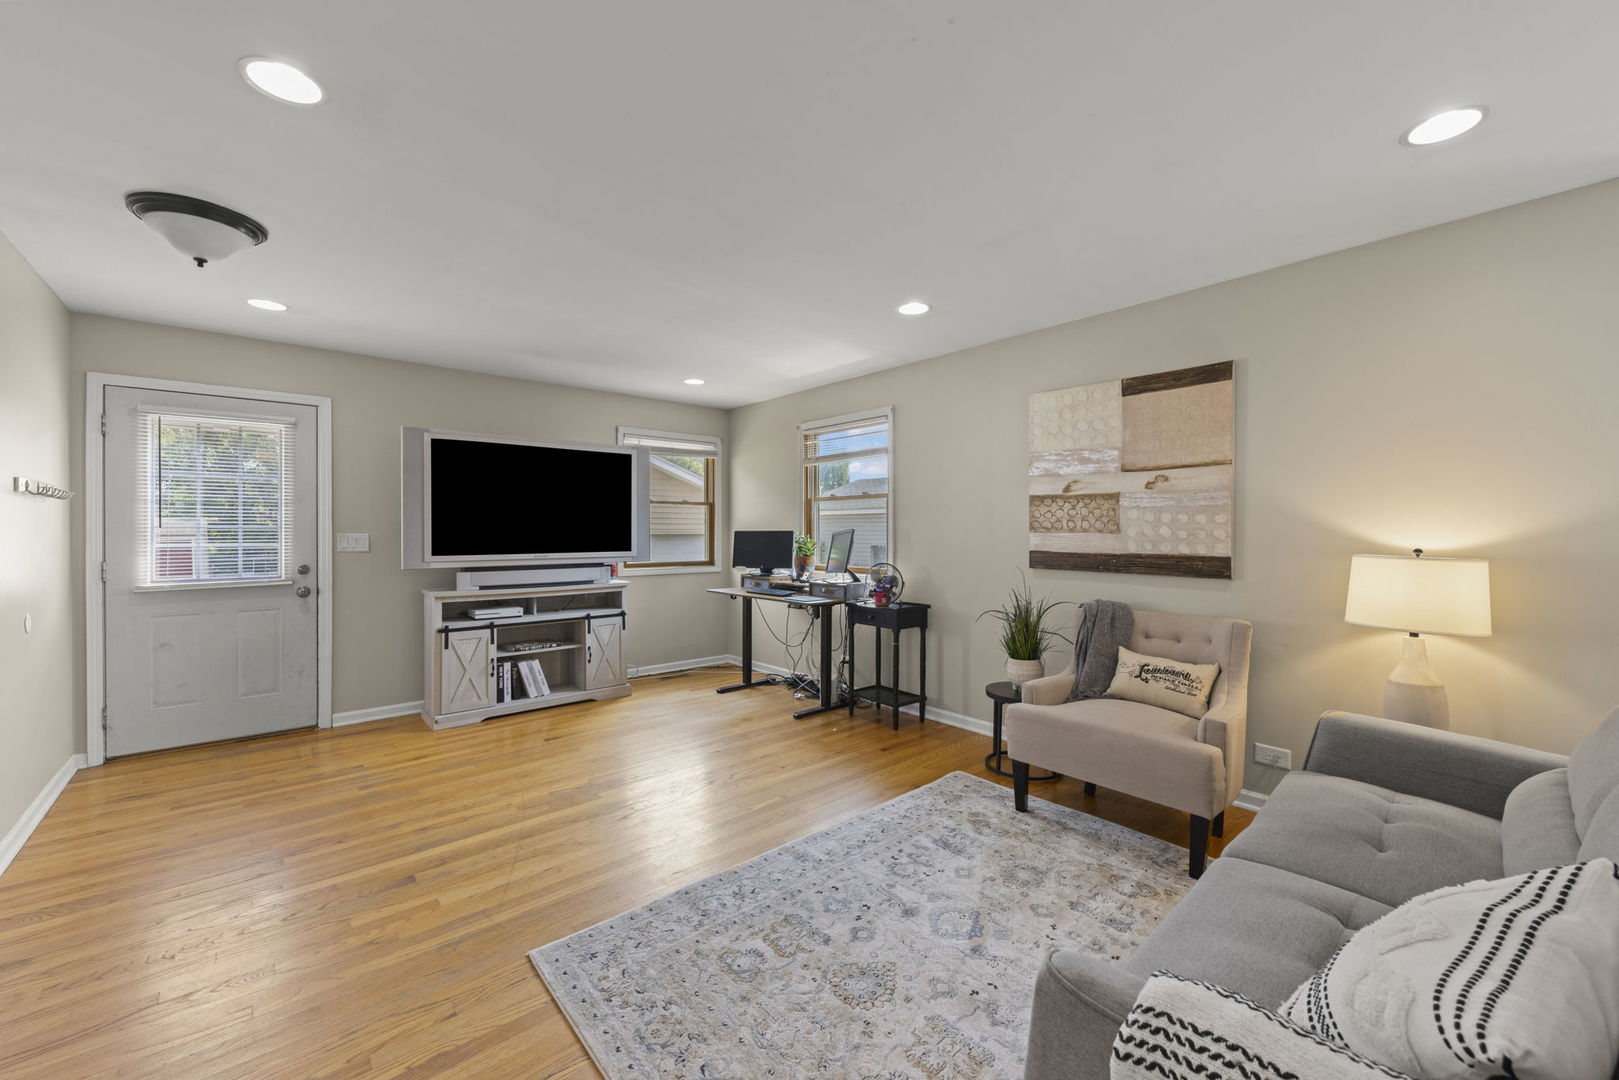
Property Description
Check out this ONE LEVEL LIVING 3 Bedroom-2 FULL Bathroom home with just under 3,000 Square Feet of combined Living, Storage and Basement space. Hardwood Floors, Heated Garage, 2 Living Spaces and Fenced Yard too! Kitchen complete with Granite Countertops, Updated Cabinets, Stainless Steel Appliances, Hardwood Floors, Large Arched Window, for natural light and a pantry for additional storage space. The open area great room has Hardwood Floors, Recessed Lighting and Space for your Large Dining Room Table and sideboard in addition to your Oversized Living Room furniture too. This Great Room is the heart of the home- Living, Dining, Entertaining, Cooking and Relaxing all in one space! Light and Bright Primary Bedroom has walk in closet to keep everything organized and direct access to FULLY updated bathroom with walk in shower, custom tile and glass shower doors - making your morning routine a breeze! Double Decker Linen Closet for additional storage too. Second Living Space has Hardwood Floors, Large Windows and Sliding Barn door for additional privacy. 2nd Bedroom has Walk in Closet, Vinyl Flooring and ceiling fan. 3rd Bedroom has an extra wide closet, ceiling fan and southern facing windows for plenty of natural light. Basement is partially finished with carpet and wall framing for possibility of 4th bedroom or home office. Extra Deep 227' fenced yard. Walk in Shed for your additional storage needs. 2.5 Car Heated and Insulated Garage with Dayton Gas Heater- Plenty of space for your cars and additional items. Complete Tear Off Roof (2017), Dual Zoned Goodman 97% High Efficiency Furnaces (2019 and 2024) in addition to Lenox AC units all which has been annually serviced and maintained. All main level windows have been replaced (except one) and the Basement Windows were replaced in 2023, Full driveway excavation and replacement (2018), 100 amp panel with 60 amp garage sub panel with 240 Volt capacity for devices that require higher power. Heart of Lombard Living is here! Directly across from Lombard Commons Park - Enjoy having Direct Access to 50 Acres to Parks with the award-winning Paradise Bay Water Park, 9-Hole Disc Golf Course, Soccer and Baseball Fields, Basketball Courts, Playgrounds, Walking Trails and Picnic Shelter Area. Blocks to Downtown Lombard for shopping, dining and entertainment. Nestled in a neighborhood filled with mature trees, sidewalks, close to the Metra Union Pacific West Line, Lilacia Park-Lombard's world-renowned horticultural showcase, Newly Built Helen Plum Library, Historical Landmark Dairy Queen, Farmer's Market, The Great Western Trail, Prairie Path, Medical Offices, Pharmacy, Post Office and Hardware Store are all right here. Also Close to Marianos, Target, Starbucks, and Trader Joes. Enjoy close proximity to downtown Lombard in addition to Downtown Glen Ellyn ,Downtown Villa Park and Oak Brook for additional Dining, Shopping, and Entertainment options. Easy access to I-355, I-294, I-290, and I-88 access makes this hidden gem exactly where you want to be. Take a look today!
Build Your Team
Quickly find investor-friendly professionals who can help you succeed in real estate investing at any stage of the investing journey.


Agents
Match with investor-friendly agents who can help you find, analyze, and close your next deal


Lenders
Get the best funding…find investor-friendly lenders who specialize in your deal strategy


Property Managers
Transition to passive investing. Find a trusted property management partnership that lasts.


Tax Pros & Accountants
Taxes and financial reporting made easy—find experts to create tax savings strategies, file taxes, and more
Location
Property Details
Parking
- Description: Detached Garage
- Details: Asphalt, Garage Door Opener, Heated Garage, On Site, Detached, Garage
- Garage Spaces: 2
- Spaces Total: 2
Bedroom Information
- # of Bedrooms: 3
Bathroom Information
- # of Baths (Full): 2
- # of Baths (Total): 2.0
Interior Features
- # of Rooms: 7
- Basement: Yes
- Basement Description: Partially Finished, Partial
Exterior Features
- Exterior Walls Materials: Siding (Alum/Vinyl)
- Roof Material: Asphalt
Land Information
- Land Use: Residential
- Land Use Subtype: Single Family Residential (Assumed)
Lot Information
- Parcel ID: 0608212007
- Lot Size: 0 sqft
Property Information
- Property Type: Single Family Residence
- Style: Ranch
- Year Built: 1951
Tax Information
- Annual Tax: $8,956
Utilities
- Heating: Natural Gas
- Cooling: Central Air
Location
- County: Du Page
Listing Details
Investment Summary
- Monthly Cash Flow
- -$633
- Cap Rate
- 3.8%
- Cash-on-Cash Return
- -8.3%
- Debt Coverage Ratio
- 0.66
- Internal Rate of Return (5 years)
- -4.0%
Cash Flow
Net Operating Income (NOI) minus mortgage payments.
Calculation:
NOI - Mortgage Payments
Cap Rate (Market Value)
Capitalization Rate is a rate of return that compares the yearly Net Operating Income (NOI) to the market value.
Calculation:
NOI / Market Value
Cash-on-Cash Return (CoC)
Annual Cash Flow / Cash Invested
Calculation:
Annual cash flow divided by initial cash invested.
Debt Coverage Ratio (DCR)
Net Operating Income (NOI) divided by total debt payments.
Calculation:
NOI / Total Debt Payments
Internal Rate of Return (IRR)
A metric for assessing profitability over time. IRR is the discount rate at which the net present value (NPV) of all future cash flows (positive and negative) from an investment equals zero — including both periodic cash flow (such as rent) and a projected sale at the end of the holding period. It represents the expected annualized return, accounting for income, expenses, and the recovery of capital through a future sale.
Purchase Details
Purchase PriceThe price paid for the property. Purchase price:
| $399,000 |
|---|---|
Amount FinancedThe amount of the purchase financed through a loan. Amount financed:
| -$319,200 |
Down paymentThe initial payment made towards the purchase. Down payment:
| $79,800 |
Closing CostsFees and expenses associated with purchasing a property, typically ranging from 2% to 5% of the home’s purchase price, paid at the end of a home purchase to cover services like lending, title transfer, and taxes. Closing costs:
| $11,970 |
Rehab CostsCosts incurred to repair or improve the property, including: roof, flooring, exterior siding, kitchen, exterior paint, bathrooms, etc. Rehab costs:
| $0 |
Initial Cash InvestedThe total initial cash invested in the property. Calculation:Down payment + Buying costs + Rehab costs Initial cash invested:
| $91,770 |
Square Feet (SQFT)The total square footage of the property. Square feet:
| 1,593 |
Cost Per Square FootCost per square foot of the property. Calculation:Purchase Price / Square Feet Cost per square foot:
| $250 |
Monthly Rent Per Square FootMonthly rent divided by the number of square feet. This ratio helps investors compare rental income efficiency across properties, markets, and unit sizes Calculation:Monthly Rent / Square Feet Monthly rent per square foot:
| $1.82 |
Financing Details
Loan AmountThe total sum of money borrowed from a lender to finance a property purchase. Calculation:Purchase Price - Down Payment
Loan amount:
| $319,200 |
|---|---|
Loan to Value Ratio (LTV)Loan amount divided by the market value of the property. Calculation:Loan Amount / Market Value
Loan to value ratio:
| 80.0% |
Loan TypeThe type of loan (e.g., fixed, adjustable).
Loan type:
| Amortizing |
TermThe loan repayment period in years.
Term:
| 30 years |
Interest RateThe percentage a lender charges on the borrowed amount of a loan, determining the cost of borrowing money.
Interest rate:
| 5.875% |
Principal & Interest (PI)The principal is the portion of the loan payment that reduces the loan balance. The interest is the lender's charge for borrowing money. Calculation:(P * r * (1 + r) ** n) / ((1 + r) ** n - 1) Where:
P = Loan amount (principal)
Principal & interest:
| $1,888 |
Property TaxesAnnual taxes levied by local governments on real estate properties. These taxes fund public services like schools, roads, and emergency services.
Property tax:
| $746 |
InsuranceThe costs for insurance coverage to protect against financial losses due to risks like fire, natural disasters, theft, liability, or tenant-related damages. Calculation:Assumes 7% of gross rental income, unless insurance rates are specified.
Insurance:
| $203 |
Private Mortgage Insurance (PMI)A fee that borrowers pay when they take out a conventional loan with a loan-to-value (LTV) ratio above 80%.
Private mortgage insurance (PMI):
| $0 |
Monthly PaymentThe fixed amount a borrower pays each month to repay a loan. It typically includes principal and interest (P&I) and may also cover property taxes, insurance, HOA fees, and PMI if escrowed. Monthly payment:
| $2,837 |
Operating Income
| % Rent | Monthly | Yearly | |
|---|---|---|---|
Gross RentThe total rental income received from tenants before deducting any expenses. Includes base rent, late fees, pet fees, parking fees, and other recurring charges.
Gross rent:
| $2,900 | $34,800 | |
Vacancy LossExpected loss of rent due to vacancies.
Vacancy loss:
(6%)
| 6% | -$174 | -$2,088 |
Operating IncomeGross rental income minus vacancy loss. Calculation:Gross rent - Vacancy loss
Operating income:
| $2,726 | $32,712 |
Operating Expenses
| % Rent | Monthly | Yearly | |
|---|---|---|---|
Property TaxesAnnual taxes levied by local governments on real estate properties. These taxes fund public services like schools, roads, and emergency services. | 26% | -$746 | -$8,956 |
InsuranceThe costs for insurance coverage to protect against financial losses due to risks like fire, natural disasters, theft, liability, or tenant-related damages. Calculation:Assumes 7% of gross rental income, unless insurance rates are specified. | 7% | -$203 | -$2,436 |
Property ManagementThe costs associated with hiring a property manager to handle the day-to-day operations of a rental property. Includes management fees, leasing fes, eviction fees, etc. Calculation:Assumes 8% of gross rental income. | 8% | -$232 | -$2,784 |
Repairs & MaintenanceOngoing costs for routine upkeep and minor fixes needed to keep a property in good working condition. Calculation:Assumes 5% of gross rental income. Varies by property age and condition. | 5% | -$145 | -$1,740 |
Capital ExpensesLarge, infrequent costs for major improvements or replacements, like a new roof, HVAC system, or appliances. Calculation:Assumes 5% of gross rental income. Varies by property age. | 5% | -$145 | -$1,740 |
HOA FeesRegular dues paid to a Homeowners Association for community maintenance, amenities, and management. Similar fees include: Condo Association Fees, Co-op Maintenance Fees, etc. | n/a | n/a | n/a |
Operating ExpensesRecurring costs required to maintain and manage a rental property, including property taxes, insurance, maintenance, repairs, utilities (if paid by the owner), property management fees, and other day-to-day expenses. Calculation:Insurance + Property Taxes + Property Management + Repairs & Maintenance + Capital Expenditures + HOA Fees | 51% | -$1,471 | -$17,656 |
Cash Flow
| Monthly | Yearly | |
|---|---|---|
Net Operating Income (NOI)The income generated from a property after deducting all operating expenses but before deducting mortgage payments, taxes, and capital expenditures. Calculation:Gross Operating Income - Operating Expenses
Net operating income:
| $1,255 | $15,060 |
Mortgage PaymentThe fixed amount a borrower pays each month to repay a loan. It typically includes principal and interest (P&I) and may also cover property taxes, insurance, HOA fees, and PMI if escrowed. | -$1,888 | -$22,656 |
Cash FlowNet Operating Income (NOI) minus mortgage payments. Calculation:NOI - Mortgage Payments | $633 | $7,596 |