$2,199,000
Investment Summary
- Monthly Cash Flow
- -$7,910
- Cap Rate
- 1.8%
- Cash-on-Cash Return
- -18.8%
- Debt Coverage Ratio
- 0.30
- Internal Rate of Return (5 years)
- -14.1%
Cash Flow
Net Operating Income (NOI) minus mortgage payments.
Calculation:
NOI - Mortgage Payments
Cap Rate (Market Value)
Capitalization Rate is a rate of return that compares the yearly Net Operating Income (NOI) to the market value.
Calculation:
NOI / Market Value
Cash-on-Cash Return (CoC)
Annual Cash Flow / Cash Invested
Calculation:
Annual cash flow divided by initial cash invested.
Debt Coverage Ratio (DCR)
Net Operating Income (NOI) divided by total debt payments.
Calculation:
NOI / Total Debt Payments
Internal Rate of Return (IRR)
A metric for assessing profitability over time. IRR is the discount rate at which the net present value (NPV) of all future cash flows (positive and negative) from an investment equals zero — including both periodic cash flow (such as rent) and a projected sale at the end of the holding period. It represents the expected annualized return, accounting for income, expenses, and the recovery of capital through a future sale.
Property Description
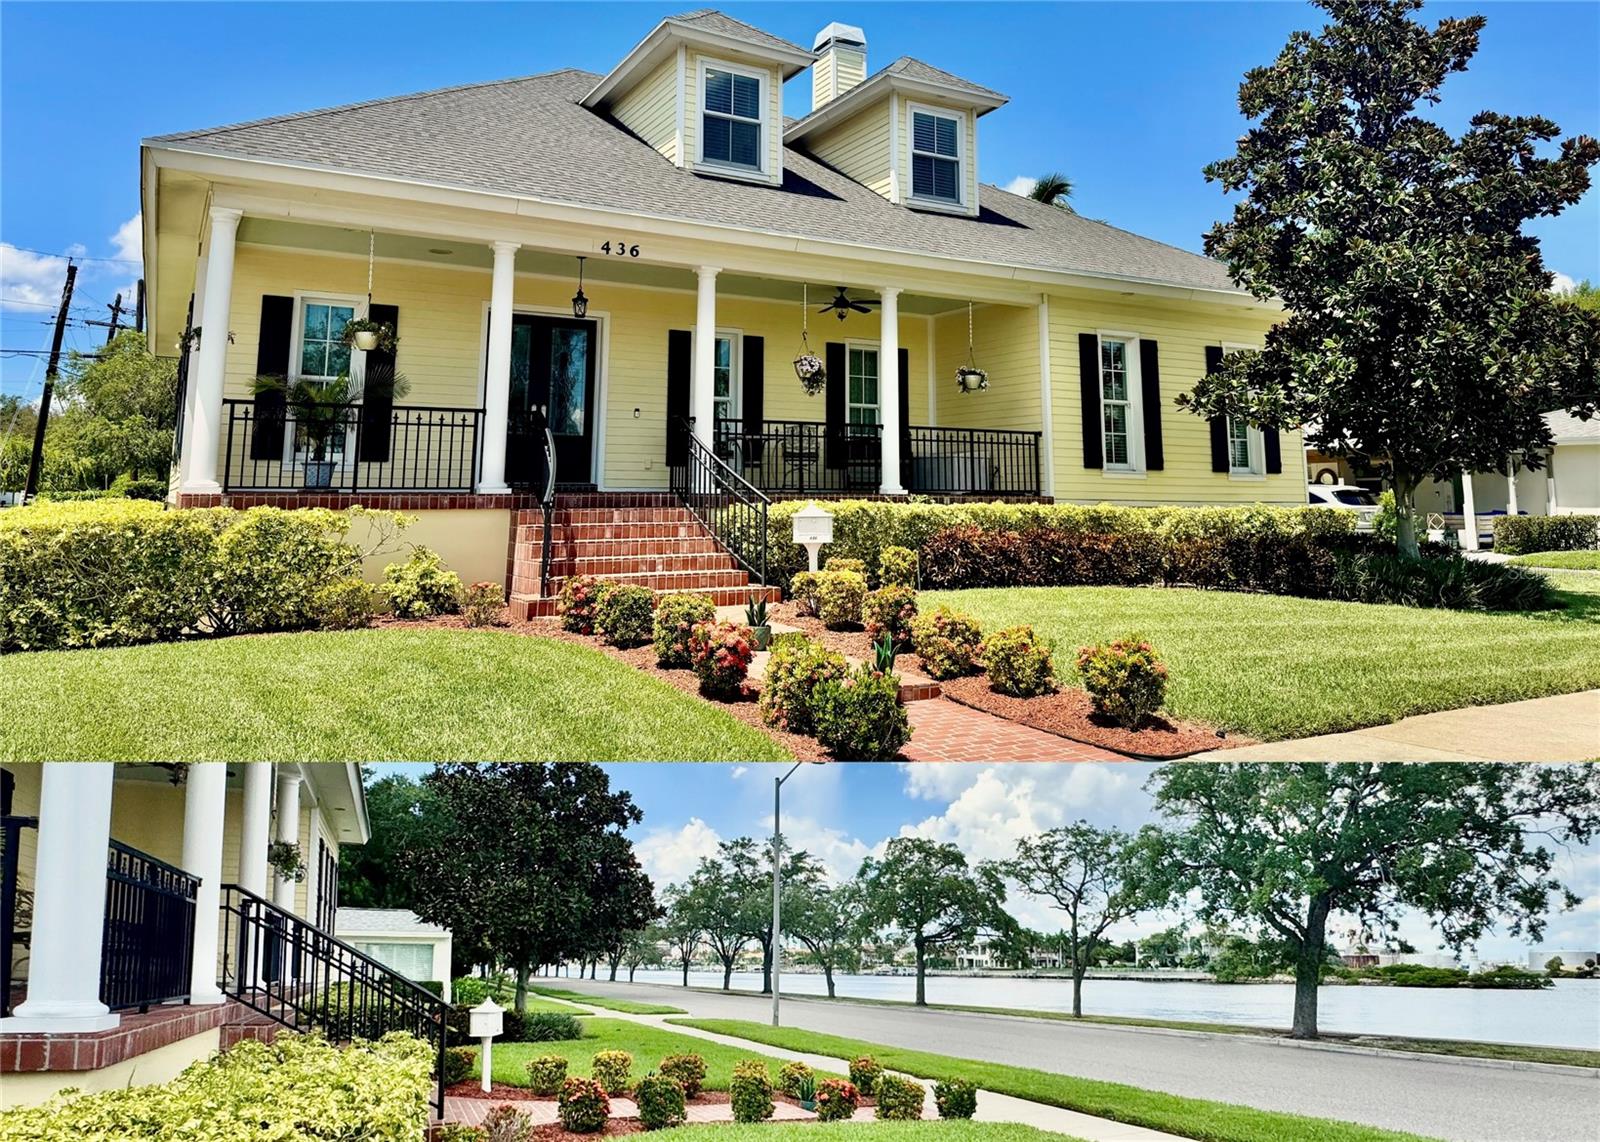
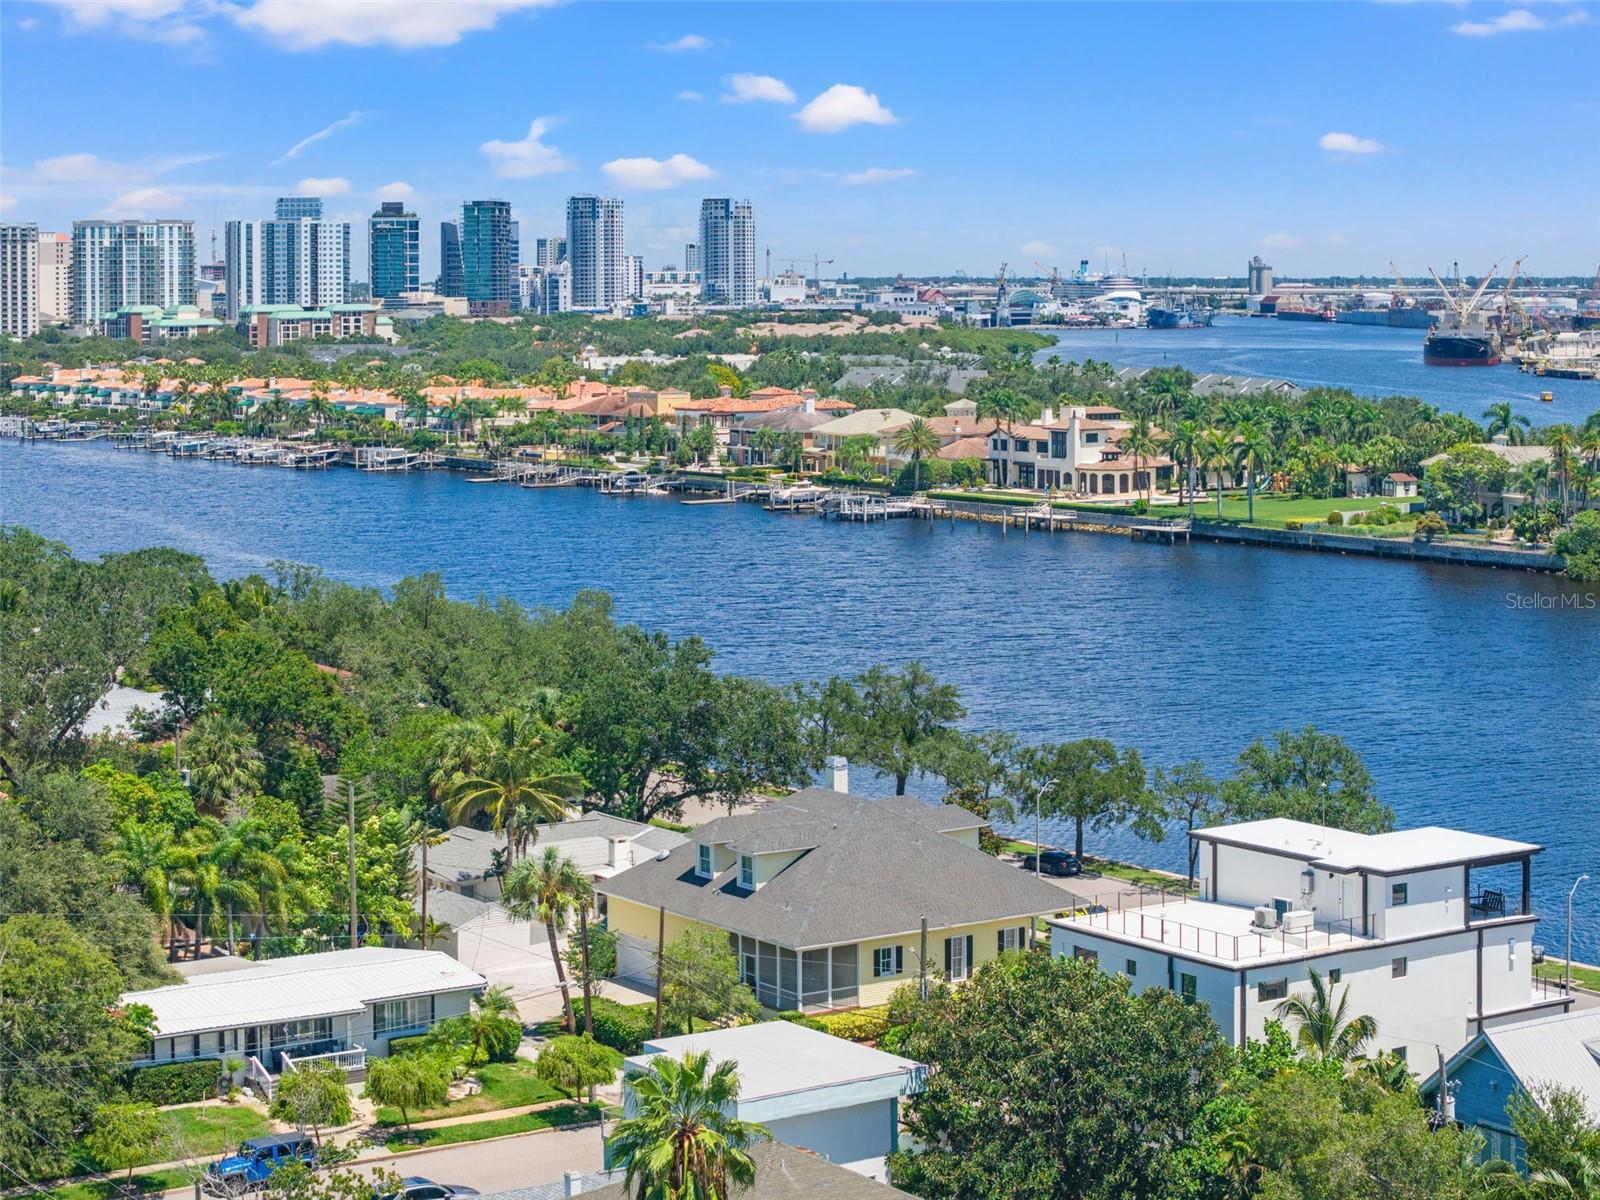
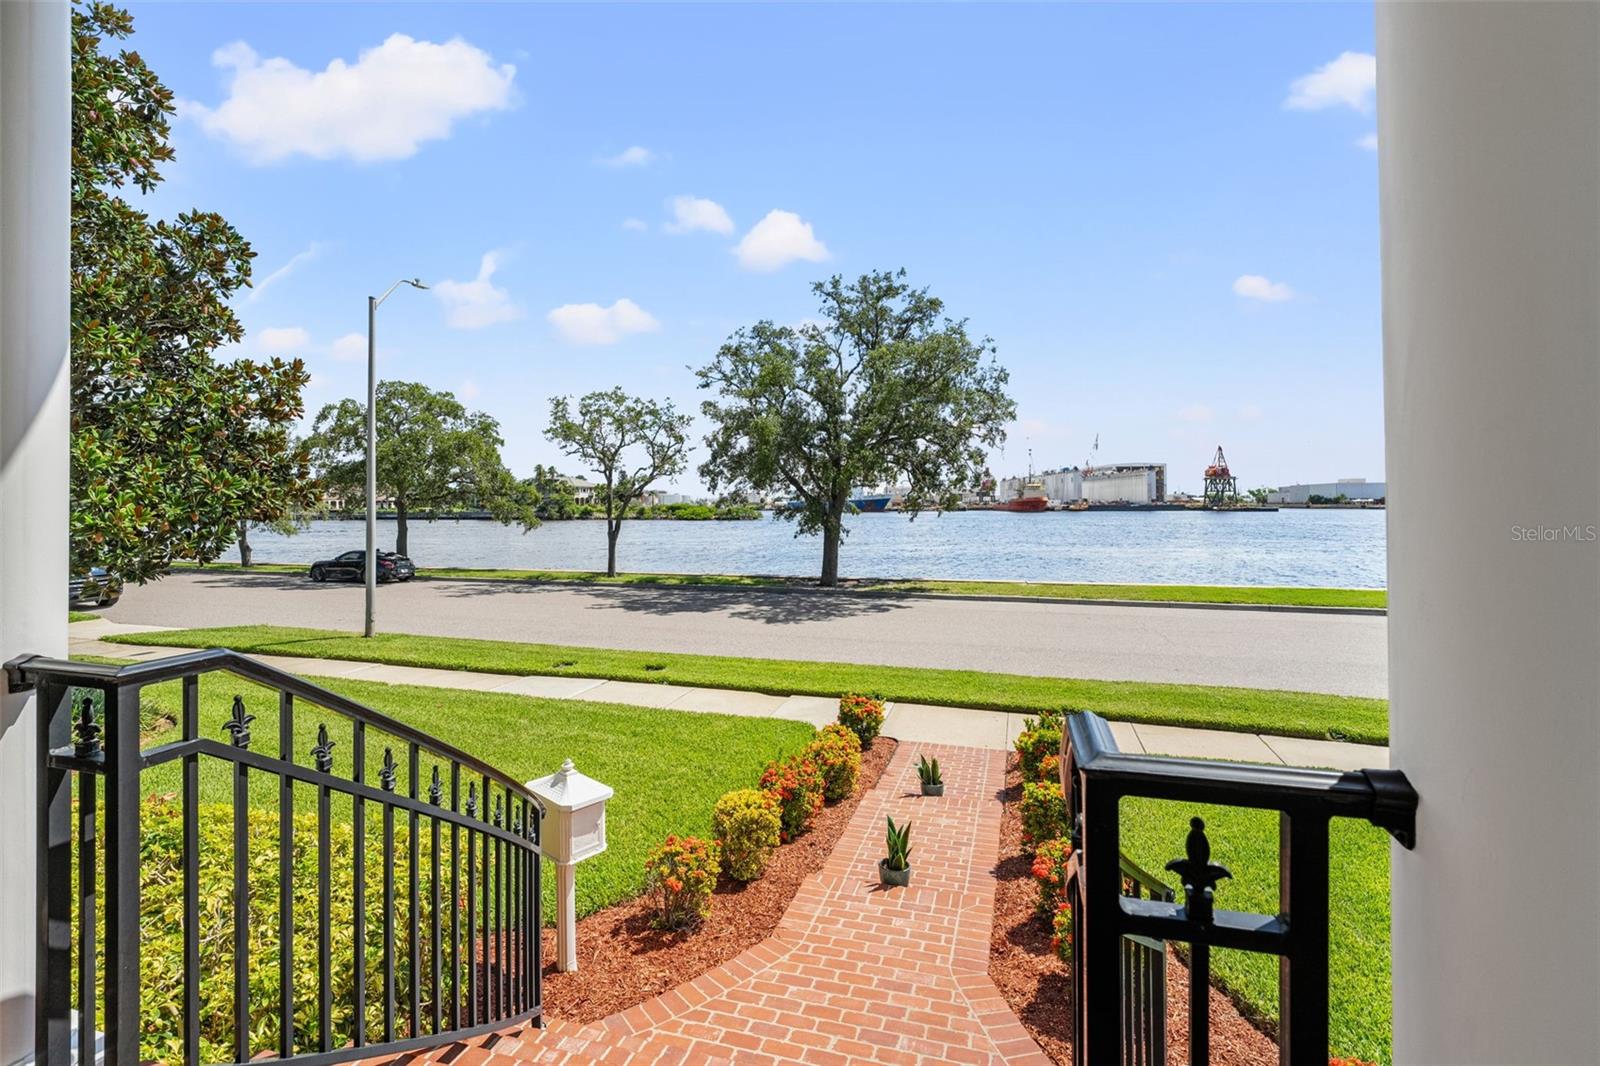
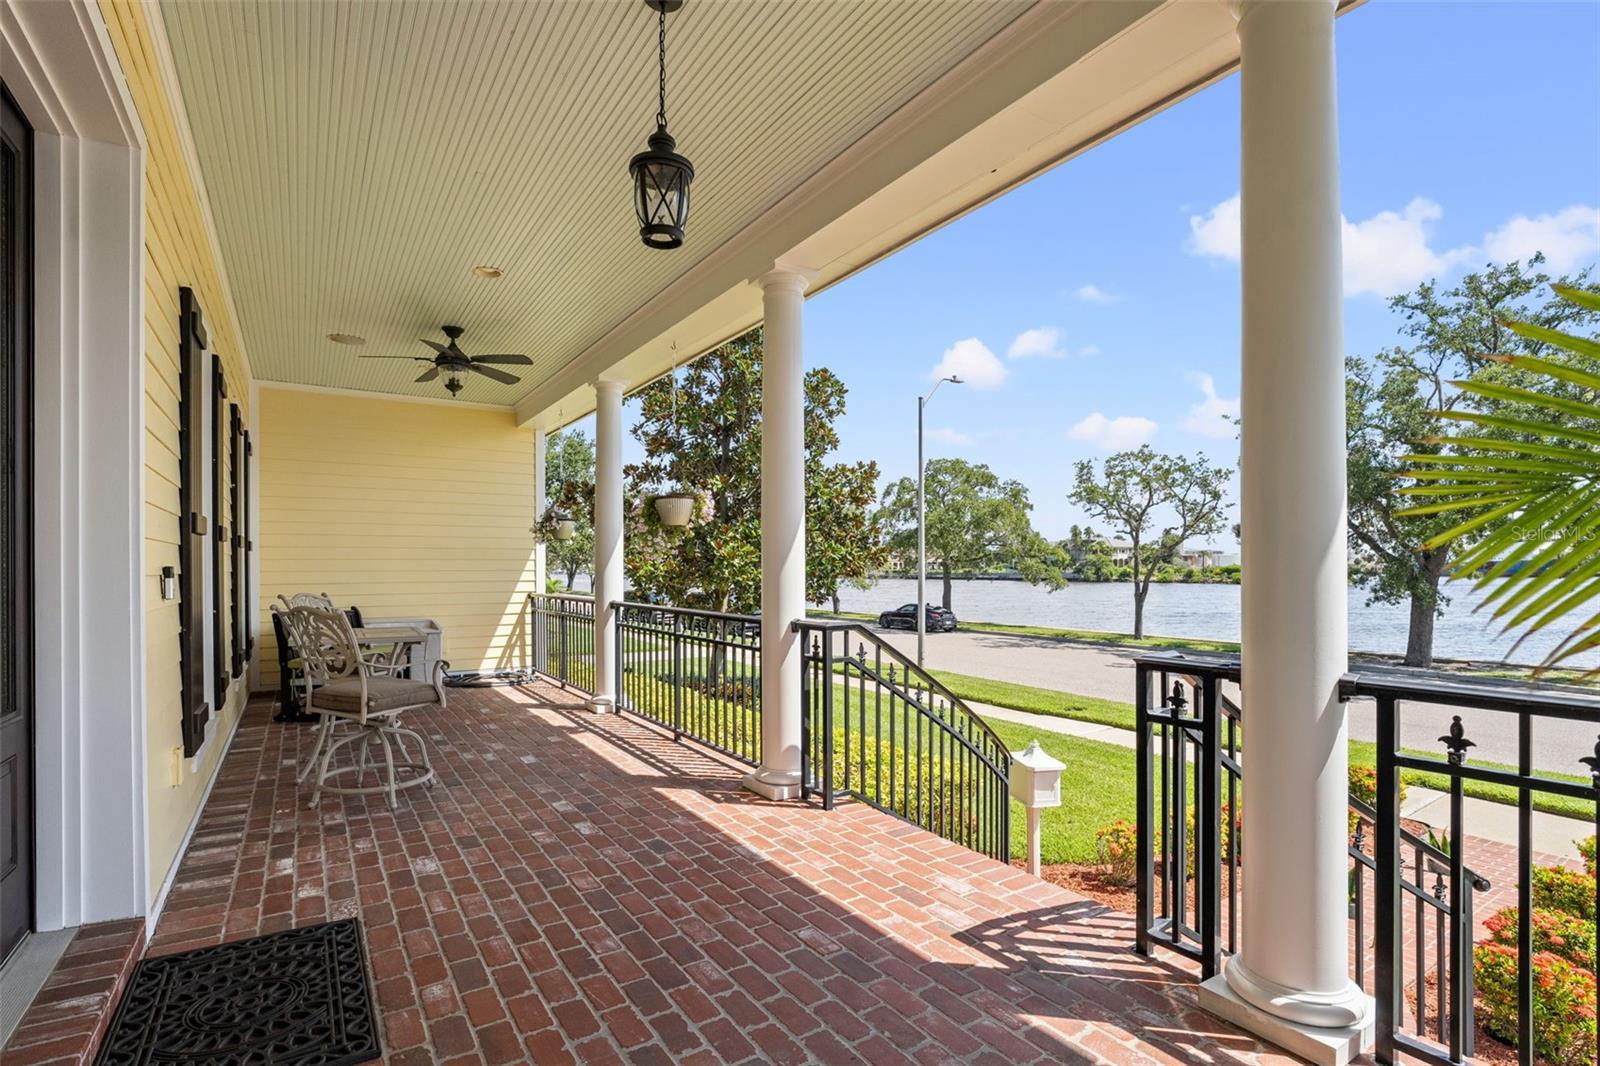
Welcome to this stunning Channelfront Southern Charmer built in 2015 where elegance meets comfort in this spacious home. Spanning 2,888 square feet, this property offers a perfect blend of modern design and classic charm, ideal for those seeking a refined lifestyle with endless views of Seddon Channel. Relax any time of day on your massive front porch to watch neighbors walk/bike/golf cart by and the vast array of boats, Pirate Taxis, Dining/Entertainment Ships, and the always enjoyable departure/arrival of cruise ships! Upon entering, you'll be greeted by an inviting ambiance with ample natural light filling the living spaces. The kitchen is a chef's delight, offering plenty of room for culinary creations and gatherings. Whether hosting friends or enjoying a quiet evening, the open-concept living and dining areas provide the perfect backdrop for any occasion. The interior was thoughtfully designed to maximize space and functionality, with a layout that seamlessly connects the living areas. The downstairs primary bedroom retreat is sure to please many, as well. This beautiful home features two generously sized upstairs guest rooms providing ample space for relaxation and privacy. A 4th bedroom conversion is easily accomplished with straightforward framing and drywall (4th Bedroom Conversion Drawing is Attached). The original building plans called for the home to be a 4 bedroom home, but the owners at the time of building chose to not have the wall installed that divided the 3rd and 4th bedrooms, leaving it as one very large 3rd bedroom. Seller is willing to accommodate a buyer's preference of having it converted back into a four bedroom home. The seller has already had a contractor quote the work to be done. Outside, the property continues to impress with a well-manicured exterior and space for outdoor activities all along Seddon Channel... Enjoy fishing the channel, paddleboarding, sightseeing, taking in amazing sunrises, golf carting, and more! The Davis Islands location provides convenient access to the vibrant amenities of South Tampa and downtown, offering a lifestyle of ease and convenience. The quaint backyard also has space for a pool! Pool contractor has already verified and renderings can be supplied upon request. Discover the perfect balance of luxury and practicality at 436 Channel Dr, where this exceptional home awaits its next chapter... ADDITIONAL HOME FEATURES: Brand New AC Systems, Tankless Gas Water Heater, All Impact Doors/Windows Throughout, AV System for Home Automation and Sound, Hardie Board Siding, Elevated 11 Feet above Sea Level (Elevation Certificate Attached)... The home stayed high and dry from storms. Only the garage had about a foot of water come in and was easily hosed out and cleaned.
Build Your Team
Quickly find investor-friendly professionals who can help you succeed in real estate investing at any stage of the investing journey.


Agents
Match with investor-friendly agents who can help you find, analyze, and close your next deal


Lenders
Get the best funding…find investor-friendly lenders who specialize in your deal strategy


Property Managers
Transition to passive investing. Find a trusted property management partnership that lasts.


Tax Pros & Accountants
Taxes and financial reporting made easy—find experts to create tax savings strategies, file taxes, and more
Location
Property Details
Parking
- Description: Garage
- Details: Alley Access, Covered, Driveway, Electric Vehicle Charging Station(s), Garage Door Opener, Garage Faces Rear, Attached
- Garage Spaces: 2
- Spaces Total: 0
Bedroom Information
- # of Bedrooms: 4
Bathroom Information
- # of Baths (Full): 2
- # of Baths (Total): 3.0
Interior Features
- # of Rooms: 7
- # of Stories: 2
- Fireplace: Yes
Exterior Features
- Exterior Walls Materials: Wood Siding
- Foundation: Slab
- Roof Type: Gable or Hip
- Roof Material: Shingle
Land Information
- Land Use: Residential
- Land Use Subtype: Single Family Residential
Lot Information
- Parcel ID: A302919509000108000010
- Lot Size: 7500 sqft
Property Information
- Property Type: Single Family Residence
- Style: Craftsman, Historic, Other, Traditional
- Year Built: 2015
Tax Information
- Annual Tax: $16,886
Utilities
- Water & Sewer: Public
- Heating: Electric, Heat Pump
- Cooling: Central Air, Zoned
Location
- County: Hillsborough
Listing Details
Investment Summary
- Monthly Cash Flow
- -$7,910
- Cap Rate
- 1.8%
- Cash-on-Cash Return
- -18.8%
- Debt Coverage Ratio
- 0.30
- Internal Rate of Return (5 years)
- -14.1%
Cash Flow
Net Operating Income (NOI) minus mortgage payments.
Calculation:
NOI - Mortgage Payments
Cap Rate (Market Value)
Capitalization Rate is a rate of return that compares the yearly Net Operating Income (NOI) to the market value.
Calculation:
NOI / Market Value
Cash-on-Cash Return (CoC)
Annual Cash Flow / Cash Invested
Calculation:
Annual cash flow divided by initial cash invested.
Debt Coverage Ratio (DCR)
Net Operating Income (NOI) divided by total debt payments.
Calculation:
NOI / Total Debt Payments
Internal Rate of Return (IRR)
A metric for assessing profitability over time. IRR is the discount rate at which the net present value (NPV) of all future cash flows (positive and negative) from an investment equals zero — including both periodic cash flow (such as rent) and a projected sale at the end of the holding period. It represents the expected annualized return, accounting for income, expenses, and the recovery of capital through a future sale.
Purchase Details
Purchase PriceThe price paid for the property. Purchase price:
| $2,199,000 |
|---|---|
Amount FinancedThe amount of the purchase financed through a loan. Amount financed:
| -$1,759,200 |
Down paymentThe initial payment made towards the purchase. Down payment:
| $439,800 |
Closing CostsFees and expenses associated with purchasing a property, typically ranging from 2% to 5% of the home’s purchase price, paid at the end of a home purchase to cover services like lending, title transfer, and taxes. Closing costs:
| $65,970 |
Rehab CostsCosts incurred to repair or improve the property, including: roof, flooring, exterior siding, kitchen, exterior paint, bathrooms, etc. Rehab costs:
| $0 |
Initial Cash InvestedThe total initial cash invested in the property. Calculation:Down payment + Buying costs + Rehab costs Initial cash invested:
| $505,770 |
Square Feet (SQFT)The total square footage of the property. Square feet:
| 2,888 |
Cost Per Square FootCost per square foot of the property. Calculation:Purchase Price / Square Feet Cost per square foot:
| $761 |
Monthly Rent Per Square FootMonthly rent divided by the number of square feet. This ratio helps investors compare rental income efficiency across properties, markets, and unit sizes Calculation:Monthly Rent / Square Feet Monthly rent per square foot:
| $2.39 |
Financing Details
Loan AmountThe total sum of money borrowed from a lender to finance a property purchase. Calculation:Purchase Price - Down Payment
Loan amount:
| $1,759,200 |
|---|---|
Loan to Value Ratio (LTV)Loan amount divided by the market value of the property. Calculation:Loan Amount / Market Value
Loan to value ratio:
| 80.0% |
Loan TypeThe type of loan (e.g., fixed, adjustable).
Loan type:
| Amortizing |
TermThe loan repayment period in years.
Term:
| 30 years |
Interest RateThe percentage a lender charges on the borrowed amount of a loan, determining the cost of borrowing money.
Interest rate:
| 6.625% |
Principal & Interest (PI)The principal is the portion of the loan payment that reduces the loan balance. The interest is the lender's charge for borrowing money. Calculation:(P * r * (1 + r) ** n) / ((1 + r) ** n - 1) Where:
P = Loan amount (principal)
Principal & interest:
| $11,264 |
Property TaxesAnnual taxes levied by local governments on real estate properties. These taxes fund public services like schools, roads, and emergency services.
Property tax:
| $1,407 |
InsuranceThe costs for insurance coverage to protect against financial losses due to risks like fire, natural disasters, theft, liability, or tenant-related damages. Calculation:Assumes 7% of gross rental income, unless insurance rates are specified.
Insurance:
| $483 |
Private Mortgage Insurance (PMI)A fee that borrowers pay when they take out a conventional loan with a loan-to-value (LTV) ratio above 80%.
Private mortgage insurance (PMI):
| $0 |
Monthly PaymentThe fixed amount a borrower pays each month to repay a loan. It typically includes principal and interest (P&I) and may also cover property taxes, insurance, HOA fees, and PMI if escrowed. Monthly payment:
| $13,154 |
Operating Income
| % Rent | Monthly | Yearly | |
|---|---|---|---|
Gross RentThe total rental income received from tenants before deducting any expenses. Includes base rent, late fees, pet fees, parking fees, and other recurring charges.
Gross rent:
| $6,900 | $82,800 | |
Vacancy LossExpected loss of rent due to vacancies.
Vacancy loss:
(6%)
| 6% | -$414 | -$4,968 |
Operating IncomeGross rental income minus vacancy loss. Calculation:Gross rent - Vacancy loss
Operating income:
| $6,486 | $77,832 |
Operating Expenses
| % Rent | Monthly | Yearly | |
|---|---|---|---|
Property TaxesAnnual taxes levied by local governments on real estate properties. These taxes fund public services like schools, roads, and emergency services. | 20% | -$1,407 | -$16,886 |
InsuranceThe costs for insurance coverage to protect against financial losses due to risks like fire, natural disasters, theft, liability, or tenant-related damages. Calculation:Assumes 7% of gross rental income, unless insurance rates are specified. | 7% | -$483 | -$5,796 |
Property ManagementThe costs associated with hiring a property manager to handle the day-to-day operations of a rental property. Includes management fees, leasing fes, eviction fees, etc. Calculation:Assumes 8% of gross rental income. | 8% | -$552 | -$6,624 |
Repairs & MaintenanceOngoing costs for routine upkeep and minor fixes needed to keep a property in good working condition. Calculation:Assumes 5% of gross rental income. Varies by property age and condition. | 5% | -$345 | -$4,140 |
Capital ExpensesLarge, infrequent costs for major improvements or replacements, like a new roof, HVAC system, or appliances. Calculation:Assumes 5% of gross rental income. Varies by property age. | 5% | -$345 | -$4,140 |
HOA FeesRegular dues paid to a Homeowners Association for community maintenance, amenities, and management. Similar fees include: Condo Association Fees, Co-op Maintenance Fees, etc. | n/a | n/a | n/a |
Operating ExpensesRecurring costs required to maintain and manage a rental property, including property taxes, insurance, maintenance, repairs, utilities (if paid by the owner), property management fees, and other day-to-day expenses. Calculation:Insurance + Property Taxes + Property Management + Repairs & Maintenance + Capital Expenditures + HOA Fees | 45% | -$3,132 | -$37,586 |
Cash Flow
| Monthly | Yearly | |
|---|---|---|
Net Operating Income (NOI)The income generated from a property after deducting all operating expenses but before deducting mortgage payments, taxes, and capital expenditures. Calculation:Gross Operating Income - Operating Expenses
Net operating income:
| $3,354 | $40,248 |
Mortgage PaymentThe fixed amount a borrower pays each month to repay a loan. It typically includes principal and interest (P&I) and may also cover property taxes, insurance, HOA fees, and PMI if escrowed. | -$11,264 | -$135,168 |
Cash FlowNet Operating Income (NOI) minus mortgage payments. Calculation:NOI - Mortgage Payments | $7,910 | $94,920 |