
$245,000
Investment Summary
- Monthly Cash Flow
- -$758
- Cap Rate
- 2.4%
- Cash-on-Cash Return
- -16.1%
- Debt Coverage Ratio
- 0.40
- Internal Rate of Return (5 years)
- -11.6%
Cash Flow
Net Operating Income (NOI) minus mortgage payments.
Calculation:
NOI - Mortgage Payments
Cap Rate (Market Value)
Capitalization Rate is a rate of return that compares the yearly Net Operating Income (NOI) to the market value.
Calculation:
NOI / Market Value
Cash-on-Cash Return (CoC)
Annual Cash Flow / Cash Invested
Calculation:
Annual cash flow divided by initial cash invested.
Debt Coverage Ratio (DCR)
Net Operating Income (NOI) divided by total debt payments.
Calculation:
NOI / Total Debt Payments
Internal Rate of Return (IRR)
A metric for assessing profitability over time. IRR is the discount rate at which the net present value (NPV) of all future cash flows (positive and negative) from an investment equals zero — including both periodic cash flow (such as rent) and a projected sale at the end of the holding period. It represents the expected annualized return, accounting for income, expenses, and the recovery of capital through a future sale.
Property Description
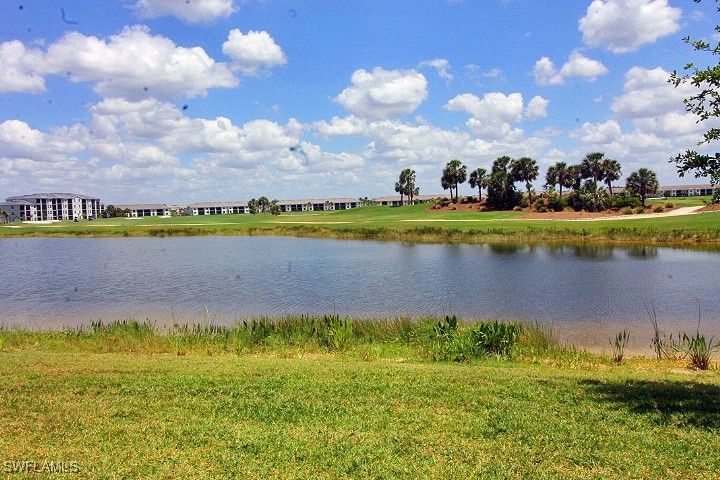
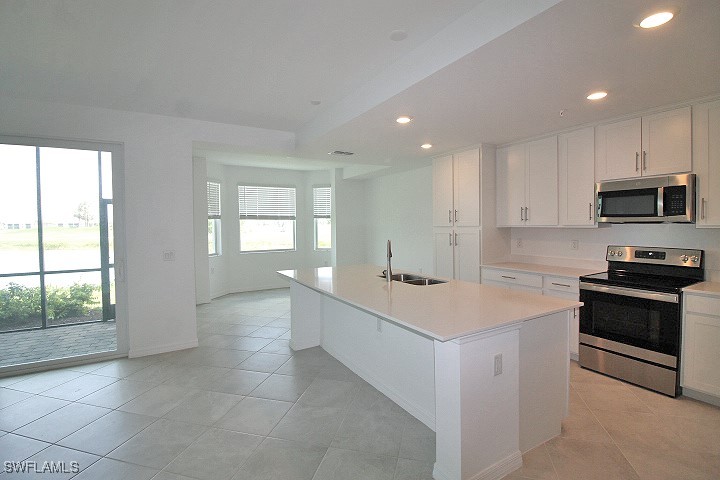
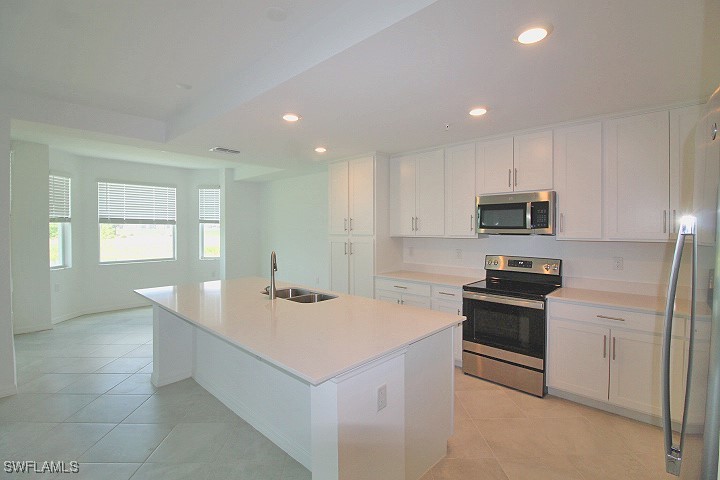
*Brand New! Never Lived In! Bundled Golf!** Why wait for community amenities to be built when everything is already finished in Babcock National? This move-in-ready first-floor unit overlooks the water as well as the 2nd fairway & green. Enjoy immediate access to all the amenities without the hassles of builders or construction delays! This bright & airy unit features tiled floors, white quartz countertops, & cozy carpeted bedrooms. The open floor plan allows all living areas to face the golf course & serene water views. It includes two bedrms, two baths, & a relaxing Lanai, making it perfect for entertaining. You can easily extend your gatherings onto the screened-in Lanai while watching golfers tackle the challenging second hole of this Gordon Lewis-designed golf course. The chef's dream kitchen boasts expansive counter space, ample cabinetry, SS appliances, & white cabinets. The quartz breakfast bar offers room for additional seating, while the dining area features a bay window overlooking the course and surrounding nature. The primary suite comes equipped with a walk-in closet and an additional linen closet for extra storage. This home truly offers a flowing layout that is perfect for entertaining & enjoying the beautiful surroundings! Just a short stroll down the street leads you to a community satellite pool, or you can venture into the lively community. The centerpiece of Babcock National is its 18-hole championship golf course, meticulously designed to challenge players of all skill levels. After a day on the greens, unwind at the Tiki Bar—a perfect spot for a drink or casual meet-ups with friends. Residents can enjoy two sparkling pools or visit the on-site spa, which offers a serene retreat with a range of treatments. The state-of-the-art gym is fully equipped for comprehensive workouts. The NEW Clubhouse is open, and it's beautiful!! Babcock National isn't just about its amenities; it’s also about embracing the dynamic lifestyle of Babcock Ranch. Spend your weekends exploring community events, such as gourmet food trucks, live music, art shows, and farmers' markets. There's always something happening, making it easy for residents to connect with their neighbors. Babcock Ranch is more than just a place to live; it’s a community where residents can thrive, offering a unique blend of sustainability and camaraderie unmatched anywhere else in America. Founder's Square features a wellness center, restaurants, and more amenities coming soon on B Street. This Spring, retail stores will open at Yellow Pine in the Publix shopping center. Babcock Ranch has received worldwide recognition, as seen on "60 Minutes," for withstanding storms and its sustainability, attracting homeowners from all over. Babcock Ranch is more than just a place to live; it’s a community where residents can thrive, offering a unique blend of sustainability and camaraderie unmatched anywhere else in America. Welcome home to resort-style living every night!
Build Your Team
Quickly find investor-friendly professionals who can help you succeed in real estate investing at any stage of the investing journey.


Agents
Match with investor-friendly agents who can help you find, analyze, and close your next deal


Lenders
Get the best funding…find investor-friendly lenders who specialize in your deal strategy


Property Managers
Transition to passive investing. Find a trusted property management partnership that lasts.


Tax Pros & Accountants
Taxes and financial reporting made easy—find experts to create tax savings strategies, file taxes, and more
Location
Property Details
Parking
- Description: Assigned, Covered, Guest, Paved, OneSpace, DetachedCarport
- Details: Assigned, Covered, Driveway, Guest, Paved, Detached Carport
- Garage Spaces: 0
- Spaces Total: 0
Bedroom Information
- # of Bedrooms: 2
Bathroom Information
- # of Baths (Full): 2
- # of Baths (Total): 2.0
Interior Features
- # of Stories: 1
Exterior Features
- Roof Material: Tile
- Pool Community: Yes
HOA
- Has HOA: Yes
- HOA Fee: $423/quarterly
- Additional HOA Fee: $884/quarterly
Land Information
- Land Use: Residential
- Land Use Subtype: Condominium Unit
Lot Information
- Parcel ID: 422629504011
- Lot Size: 0 sqft
Property Information
- Property Type: Condominium
- Style: Ranch, One Story, Mid Rise
- Year Built: 2023
Tax Information
- Annual Tax: $5,358
Utilities
- Water & Sewer: Public
- Heating: Central, Electric
- Cooling: Central Air, Ceiling Fan(s), Electric
Location
- County: Charlotte
Listing Details
Investment Summary
- Monthly Cash Flow
- -$758
- Cap Rate
- 2.4%
- Cash-on-Cash Return
- -16.1%
- Debt Coverage Ratio
- 0.40
- Internal Rate of Return (5 years)
- -11.6%
Cash Flow
Net Operating Income (NOI) minus mortgage payments.
Calculation:
NOI - Mortgage Payments
Cap Rate (Market Value)
Capitalization Rate is a rate of return that compares the yearly Net Operating Income (NOI) to the market value.
Calculation:
NOI / Market Value
Cash-on-Cash Return (CoC)
Annual Cash Flow / Cash Invested
Calculation:
Annual cash flow divided by initial cash invested.
Debt Coverage Ratio (DCR)
Net Operating Income (NOI) divided by total debt payments.
Calculation:
NOI / Total Debt Payments
Internal Rate of Return (IRR)
A metric for assessing profitability over time. IRR is the discount rate at which the net present value (NPV) of all future cash flows (positive and negative) from an investment equals zero — including both periodic cash flow (such as rent) and a projected sale at the end of the holding period. It represents the expected annualized return, accounting for income, expenses, and the recovery of capital through a future sale.
Purchase Details
Purchase PriceThe price paid for the property. Purchase price:
| $245,000 |
|---|---|
Amount FinancedThe amount of the purchase financed through a loan. Amount financed:
| -$196,000 |
Down paymentThe initial payment made towards the purchase. Down payment:
| $49,000 |
Closing CostsFees and expenses associated with purchasing a property, typically ranging from 2% to 5% of the home’s purchase price, paid at the end of a home purchase to cover services like lending, title transfer, and taxes. Closing costs:
| $7,350 |
Rehab CostsCosts incurred to repair or improve the property, including: roof, flooring, exterior siding, kitchen, exterior paint, bathrooms, etc. Rehab costs:
| $0 |
Initial Cash InvestedThe total initial cash invested in the property. Calculation:Down payment + Buying costs + Rehab costs Initial cash invested:
| $56,350 |
Square Feet (SQFT)The total square footage of the property. Square feet:
| 1,198 |
Cost Per Square FootCost per square foot of the property. Calculation:Purchase Price / Square Feet Cost per square foot:
| $205 |
Monthly Rent Per Square FootMonthly rent divided by the number of square feet. This ratio helps investors compare rental income efficiency across properties, markets, and unit sizes Calculation:Monthly Rent / Square Feet Monthly rent per square foot:
| $1.67 |
Financing Details
Loan AmountThe total sum of money borrowed from a lender to finance a property purchase. Calculation:Purchase Price - Down Payment
Loan amount:
| $196,000 |
|---|---|
Loan to Value Ratio (LTV)Loan amount divided by the market value of the property. Calculation:Loan Amount / Market Value
Loan to value ratio:
| 80.0% |
Loan TypeThe type of loan (e.g., fixed, adjustable).
Loan type:
| Amortizing |
TermThe loan repayment period in years.
Term:
| 30 years |
Interest RateThe percentage a lender charges on the borrowed amount of a loan, determining the cost of borrowing money.
Interest rate:
| 6.625% |
Principal & Interest (PI)The principal is the portion of the loan payment that reduces the loan balance. The interest is the lender's charge for borrowing money. Calculation:(P * r * (1 + r) ** n) / ((1 + r) ** n - 1) Where:
P = Loan amount (principal)
Principal & interest:
| $1,255 |
Property TaxesAnnual taxes levied by local governments on real estate properties. These taxes fund public services like schools, roads, and emergency services.
Property tax:
| $447 |
InsuranceThe costs for insurance coverage to protect against financial losses due to risks like fire, natural disasters, theft, liability, or tenant-related damages. Calculation:Assumes 7% of gross rental income, unless insurance rates are specified.
Insurance:
| $140 |
Private Mortgage Insurance (PMI)A fee that borrowers pay when they take out a conventional loan with a loan-to-value (LTV) ratio above 80%.
Private mortgage insurance (PMI):
| $0 |
Monthly PaymentThe fixed amount a borrower pays each month to repay a loan. It typically includes principal and interest (P&I) and may also cover property taxes, insurance, HOA fees, and PMI if escrowed. Monthly payment:
| $1,842 |
Operating Income
| % Rent | Monthly | Yearly | |
|---|---|---|---|
Gross RentThe total rental income received from tenants before deducting any expenses. Includes base rent, late fees, pet fees, parking fees, and other recurring charges.
Gross rent:
| $2,000 | $24,000 | |
Vacancy LossExpected loss of rent due to vacancies.
Vacancy loss:
(6%)
| 6% | -$120 | -$1,440 |
Operating IncomeGross rental income minus vacancy loss. Calculation:Gross rent - Vacancy loss
Operating income:
| $1,880 | $22,560 |
Operating Expenses
| % Rent | Monthly | Yearly | |
|---|---|---|---|
Property TaxesAnnual taxes levied by local governments on real estate properties. These taxes fund public services like schools, roads, and emergency services. | 22% | -$447 | -$5,358 |
InsuranceThe costs for insurance coverage to protect against financial losses due to risks like fire, natural disasters, theft, liability, or tenant-related damages. Calculation:Assumes 7% of gross rental income, unless insurance rates are specified. | 7% | -$140 | -$1,680 |
Property ManagementThe costs associated with hiring a property manager to handle the day-to-day operations of a rental property. Includes management fees, leasing fes, eviction fees, etc. Calculation:Assumes 8% of gross rental income. | 8% | -$160 | -$1,920 |
Repairs & MaintenanceOngoing costs for routine upkeep and minor fixes needed to keep a property in good working condition. Calculation:Assumes 5% of gross rental income. Varies by property age and condition. | 5% | -$100 | -$1,200 |
Capital ExpensesLarge, infrequent costs for major improvements or replacements, like a new roof, HVAC system, or appliances. Calculation:Assumes 5% of gross rental income. Varies by property age. | 5% | -$100 | -$1,200 |
HOA FeesRegular dues paid to a Homeowners Association for community maintenance, amenities, and management. Similar fees include: Condo Association Fees, Co-op Maintenance Fees, etc. | 22% | -$436 | -$5,232 |
Operating ExpensesRecurring costs required to maintain and manage a rental property, including property taxes, insurance, maintenance, repairs, utilities (if paid by the owner), property management fees, and other day-to-day expenses. Calculation:Insurance + Property Taxes + Property Management + Repairs & Maintenance + Capital Expenditures + HOA Fees | 69% | -$1,383 | -$16,590 |
Cash Flow
| Monthly | Yearly | |
|---|---|---|
Net Operating Income (NOI)The income generated from a property after deducting all operating expenses but before deducting mortgage payments, taxes, and capital expenditures. Calculation:Gross Operating Income - Operating Expenses
Net operating income:
| $497 | $5,964 |
Mortgage PaymentThe fixed amount a borrower pays each month to repay a loan. It typically includes principal and interest (P&I) and may also cover property taxes, insurance, HOA fees, and PMI if escrowed. | -$1,255 | -$15,060 |
Cash FlowNet Operating Income (NOI) minus mortgage payments. Calculation:NOI - Mortgage Payments | -$758 | -$9,096 |