$780,000
Investment Summary
- Monthly Cash Flow
- -$2,137
- Cap Rate
- 2.9%
- Cash-on-Cash Return
- -14.3%
- Debt Coverage Ratio
- 0.47
- Internal Rate of Return (5 years)
- -9.8%
Cash Flow
Net Operating Income (NOI) minus mortgage payments.
Calculation:
NOI - Mortgage Payments
Cap Rate (Market Value)
Capitalization Rate is a rate of return that compares the yearly Net Operating Income (NOI) to the market value.
Calculation:
NOI / Market Value
Cash-on-Cash Return (CoC)
Annual Cash Flow / Cash Invested
Calculation:
Annual cash flow divided by initial cash invested.
Debt Coverage Ratio (DCR)
Net Operating Income (NOI) divided by total debt payments.
Calculation:
NOI / Total Debt Payments
Internal Rate of Return (IRR)
A metric for assessing profitability over time. IRR is the discount rate at which the net present value (NPV) of all future cash flows (positive and negative) from an investment equals zero — including both periodic cash flow (such as rent) and a projected sale at the end of the holding period. It represents the expected annualized return, accounting for income, expenses, and the recovery of capital through a future sale.
Property Description
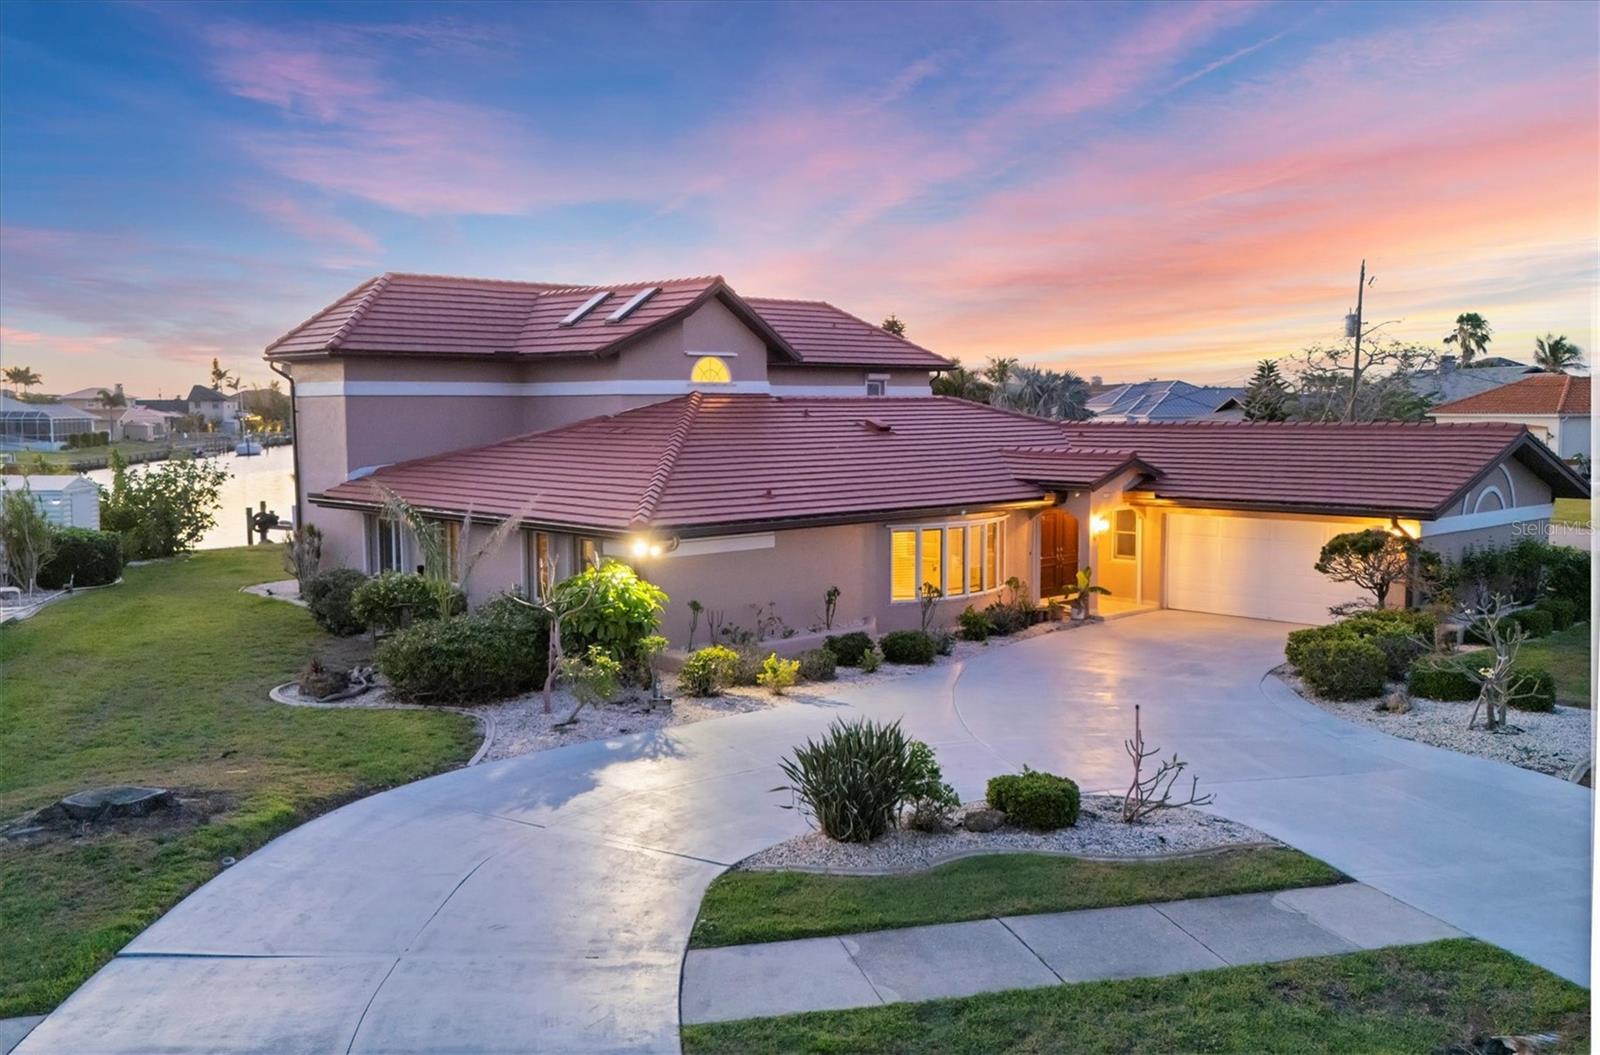
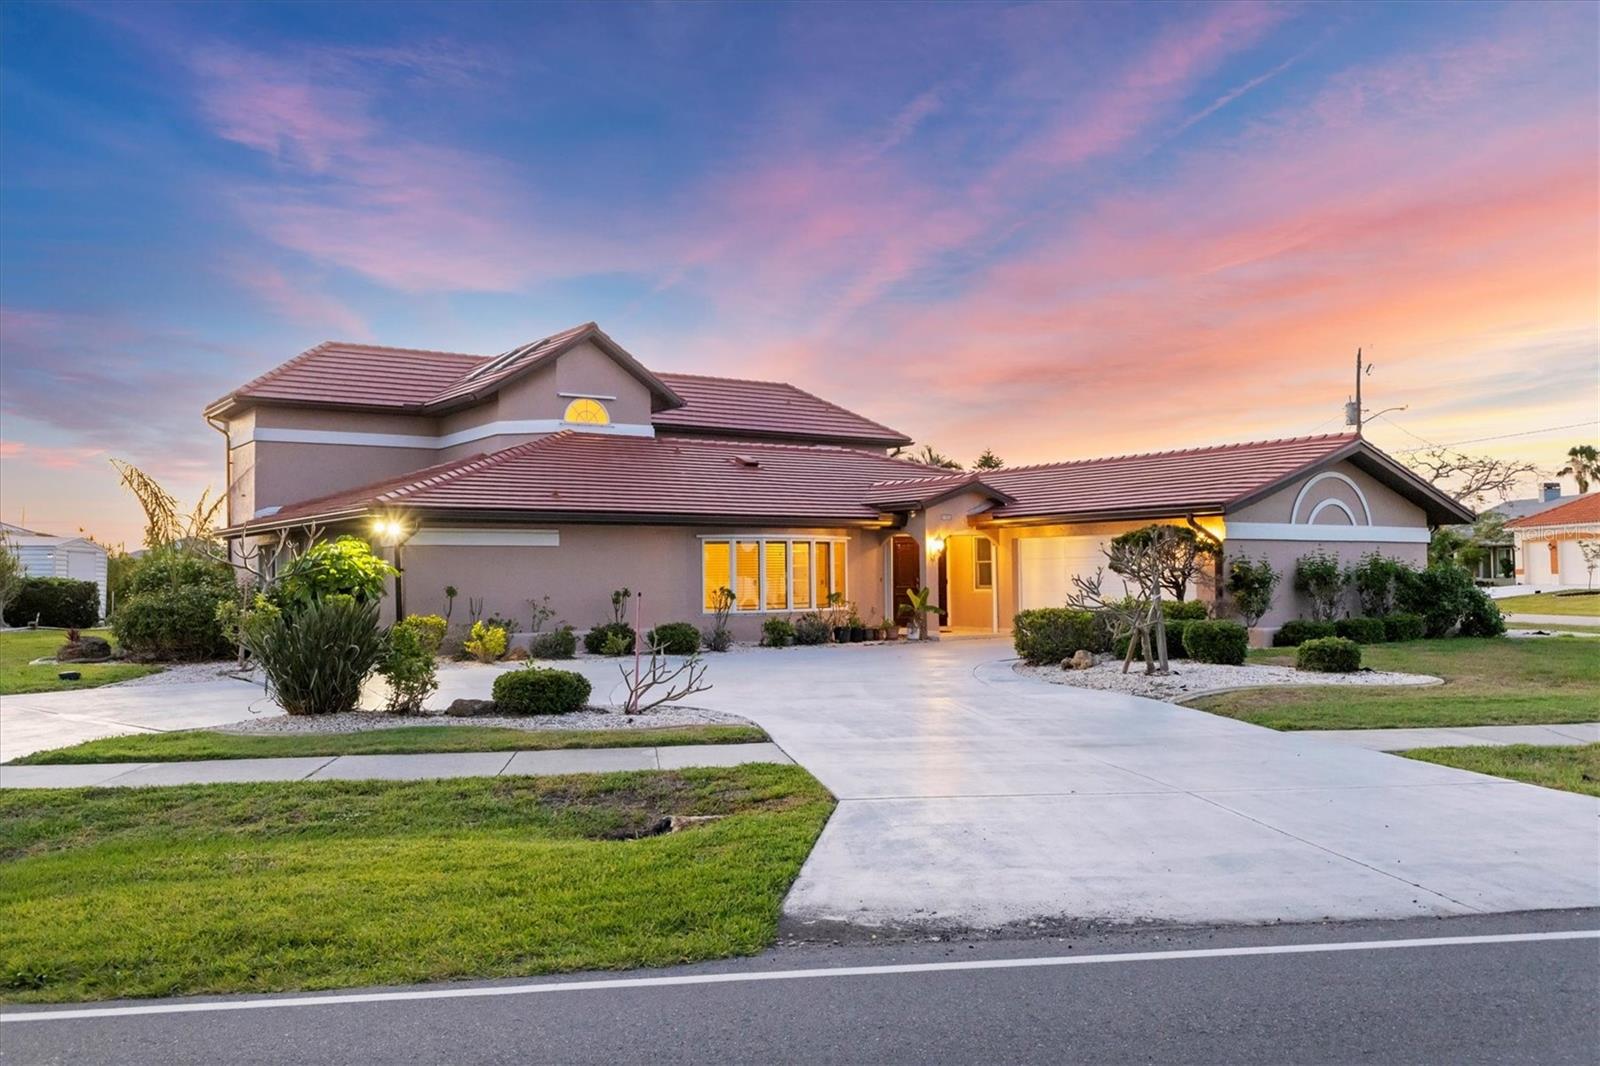
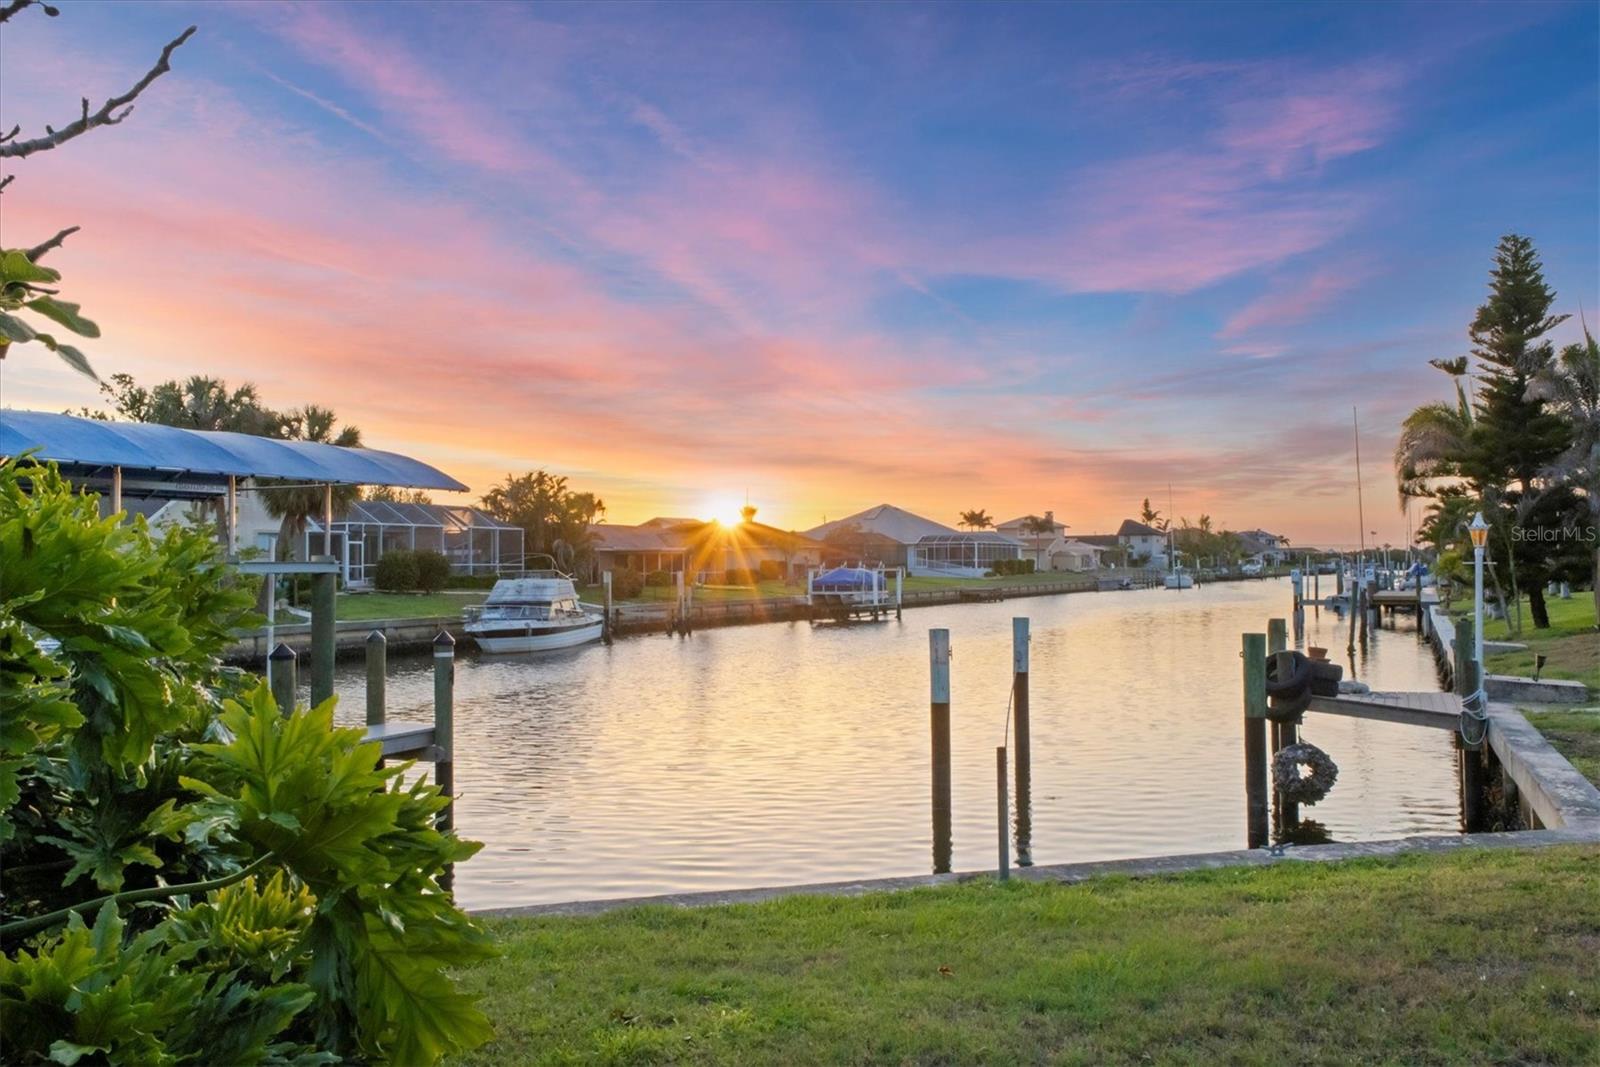
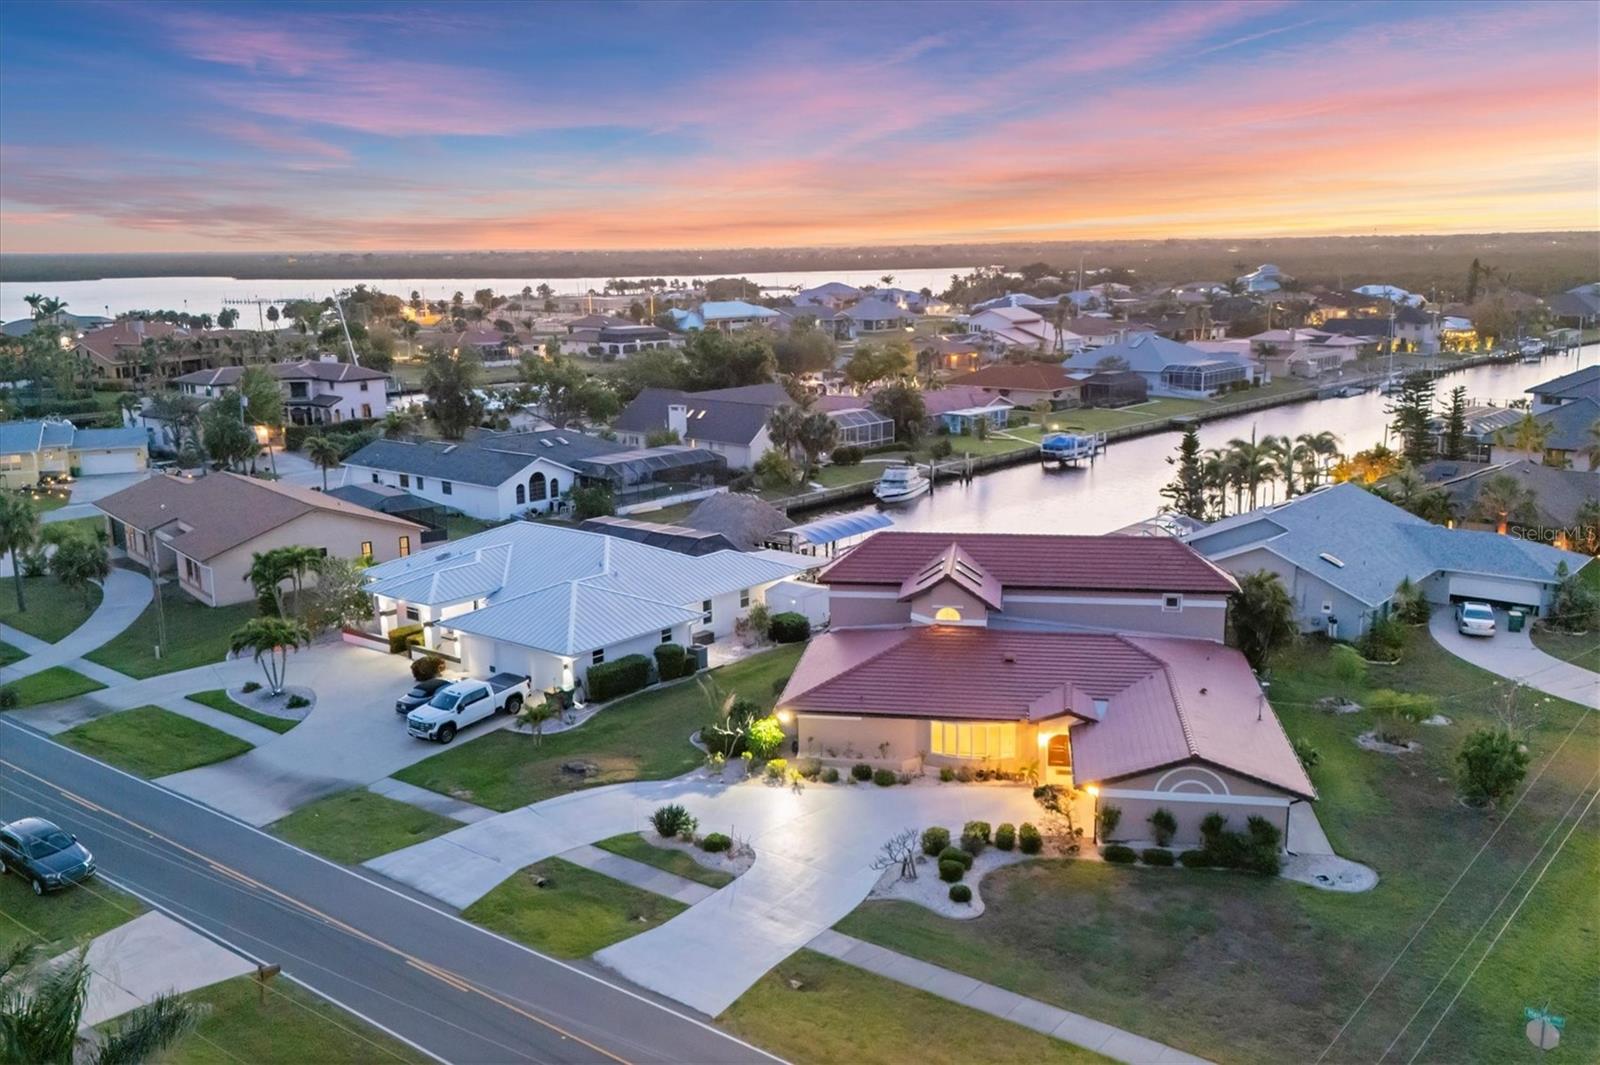
One or more photo(s) has been virtually staged. New Price Alert!!! Enjoy this canal-front gem without the high cost of waterfront property taxes—because it’s truly one of a kind! Canal-Front Elegance Meets Everyday Comfort in a grand home with dual Master Suites! Discover the perfect blend of luxury, functionality, and location in this move-in ready, meticulously maintained property, lovingly cared for by the same owners. Nestled on a rare corner lot just steps from Port Charlotte Harbor Park, this multi-generational home delivers the enviable Florida lifestyle—without HOA or CDD fees. Highlights & Features: • Dual Master Suites: One on the first floor and another upstairs—each with private en-suite bathrooms—ideal for multi-generational living or hosting guests. • Centrally Located Kitchen: Blush maple cabinetry with custom hardware, Sub-Zero refrigerator, Thermador ovens, stainless steel appliances, wine glass pressure washer, reverse osmosis drinking water system, and a whole-house water softener. • Light-Filled Living Spaces: Vaulted ceilings, oversized double-pane windows, and skylights create a bright and breezy ambiance throughout. • Stylish Bathrooms: Sleek walk-in showers and modern touchscreen glass mirrors with built-in lighting. • Elegant Finishes: Tile flooring in the main areas, plush carpeting in all bedrooms, Hunter blinds, and ceiling fans with light fixtures. • Grand Staircase: A stunning oak staircase illuminated by a sparkling glass chandelier leads to the second-floor master suite—offering breathtaking canal and sunset views. • Private Entertaining Porch & In-House Wet Bar: Screened porch with an in-ground jacuzzi leading into the indoor wet bar—perfect for sunset cocktails and weekend gatherings. • Flexible Bonus Room: An oversized space off the downstairs master ideal for a home office, gym, playroom, or second family room. • Smart Layout: Ground-level bedroom with built-in study desks, plus generous closet space with rich oak sliding doors throughout. • Recent Upgrades: Brand-new roof, updated water heater, and an integrated surround sound system with bedroom connectivity options. • Storm Ready: Accordion hurricane shutters and motorized front shutters for peace of mind. Unbeatable Location: Just steps from Port Charlotte Harbor Park, featuring tennis courts, a boardwalk, and the soon-to-be-built recreation center, picnic pavilions, and more! Conveniently Close To: • Medical: Charlotte Heart & Vascular Institute, HCA Florida Fawcett Hospital • Groceries: Publix, Aldi, Sprouts, Winn-Dixie & more • Dining: The Twisted Fork, Peace River Seafood & Crab Shack, Rossini by Chef Rocco, The Perfect Caper, The Captain’s Table • Attractions: Sunseeker Resort, Charlotte Harbor Veteran’s Memorial, Gulf Beaches & Charlotte Harbor Yacht Club Grab this rare opportunity to own a canal-front home in a prime, amenity-rich location. Whether you’re seeking a peaceful retreat or a vibrant space to entertain, this move-in ready, one-of-a-kind property is ready to welcome you home.
Build Your Team
Quickly find investor-friendly professionals who can help you succeed in real estate investing at any stage of the investing journey.


Agents
Match with investor-friendly agents who can help you find, analyze, and close your next deal


Lenders
Get the best funding…find investor-friendly lenders who specialize in your deal strategy


Property Managers
Transition to passive investing. Find a trusted property management partnership that lasts.


Tax Pros & Accountants
Taxes and financial reporting made easy—find experts to create tax savings strategies, file taxes, and more
Location
Property Details
Parking
- Description: Garage
- Details: Covered, Driveway, Garage Door Opener, Garage Faces Side, Other, Attached
- Garage Spaces: 2
- Spaces Total: 0
Bedroom Information
- # of Bedrooms: 5
Bathroom Information
- # of Baths (Full): 4
- # of Baths (Total): 4.0
Interior Features
- # of Rooms: 11
- # of Stories: 2
Exterior Features
- Exterior Walls Materials: Concrete Block
- Foundation: Block
- Roof Material: Tile
Land Information
- Land Use: Residential
- Land Use Subtype: Single Family Residential
Lot Information
- Parcel ID: 402227430024
- Lot Size: 13506 sqft
Property Information
- Property Type: Single Family Residence
- Style: Florida
- Year Built: 1972
Tax Information
- Annual Tax: $4,189
Utilities
- Water & Sewer: Public
- Heating: Central, Electric, Zoned
- Cooling: Central Air, Zoned
Location
- County: Charlotte
Listing Details
Investment Summary
- Monthly Cash Flow
- -$2,137
- Cap Rate
- 2.9%
- Cash-on-Cash Return
- -14.3%
- Debt Coverage Ratio
- 0.47
- Internal Rate of Return (5 years)
- -9.8%
Cash Flow
Net Operating Income (NOI) minus mortgage payments.
Calculation:
NOI - Mortgage Payments
Cap Rate (Market Value)
Capitalization Rate is a rate of return that compares the yearly Net Operating Income (NOI) to the market value.
Calculation:
NOI / Market Value
Cash-on-Cash Return (CoC)
Annual Cash Flow / Cash Invested
Calculation:
Annual cash flow divided by initial cash invested.
Debt Coverage Ratio (DCR)
Net Operating Income (NOI) divided by total debt payments.
Calculation:
NOI / Total Debt Payments
Internal Rate of Return (IRR)
A metric for assessing profitability over time. IRR is the discount rate at which the net present value (NPV) of all future cash flows (positive and negative) from an investment equals zero — including both periodic cash flow (such as rent) and a projected sale at the end of the holding period. It represents the expected annualized return, accounting for income, expenses, and the recovery of capital through a future sale.
Purchase Details
Purchase PriceThe price paid for the property. Purchase price:
| $780,000 |
|---|---|
Amount FinancedThe amount of the purchase financed through a loan. Amount financed:
| -$624,000 |
Down paymentThe initial payment made towards the purchase. Down payment:
| $156,000 |
Closing CostsFees and expenses associated with purchasing a property, typically ranging from 2% to 5% of the home’s purchase price, paid at the end of a home purchase to cover services like lending, title transfer, and taxes. Closing costs:
| $23,400 |
Rehab CostsCosts incurred to repair or improve the property, including: roof, flooring, exterior siding, kitchen, exterior paint, bathrooms, etc. Rehab costs:
| $0 |
Initial Cash InvestedThe total initial cash invested in the property. Calculation:Down payment + Buying costs + Rehab costs Initial cash invested:
| $179,400 |
Square Feet (SQFT)The total square footage of the property. Square feet:
| 3,682 |
Cost Per Square FootCost per square foot of the property. Calculation:Purchase Price / Square Feet Cost per square foot:
| $212 |
Monthly Rent Per Square FootMonthly rent divided by the number of square feet. This ratio helps investors compare rental income efficiency across properties, markets, and unit sizes Calculation:Monthly Rent / Square Feet Monthly rent per square foot:
| $0.87 |
Financing Details
Loan AmountThe total sum of money borrowed from a lender to finance a property purchase. Calculation:Purchase Price - Down Payment
Loan amount:
| $624,000 |
|---|---|
Loan to Value Ratio (LTV)Loan amount divided by the market value of the property. Calculation:Loan Amount / Market Value
Loan to value ratio:
| 80.0% |
Loan TypeThe type of loan (e.g., fixed, adjustable).
Loan type:
| Amortizing |
TermThe loan repayment period in years.
Term:
| 30 years |
Interest RateThe percentage a lender charges on the borrowed amount of a loan, determining the cost of borrowing money.
Interest rate:
| 6.625% |
Principal & Interest (PI)The principal is the portion of the loan payment that reduces the loan balance. The interest is the lender's charge for borrowing money. Calculation:(P * r * (1 + r) ** n) / ((1 + r) ** n - 1) Where:
P = Loan amount (principal)
Principal & interest:
| $3,996 |
Property TaxesAnnual taxes levied by local governments on real estate properties. These taxes fund public services like schools, roads, and emergency services.
Property tax:
| $349 |
InsuranceThe costs for insurance coverage to protect against financial losses due to risks like fire, natural disasters, theft, liability, or tenant-related damages. Calculation:Assumes 7% of gross rental income, unless insurance rates are specified.
Insurance:
| $224 |
Private Mortgage Insurance (PMI)A fee that borrowers pay when they take out a conventional loan with a loan-to-value (LTV) ratio above 80%.
Private mortgage insurance (PMI):
| $0 |
Monthly PaymentThe fixed amount a borrower pays each month to repay a loan. It typically includes principal and interest (P&I) and may also cover property taxes, insurance, HOA fees, and PMI if escrowed. Monthly payment:
| $4,569 |
Operating Income
| % Rent | Monthly | Yearly | |
|---|---|---|---|
Gross RentThe total rental income received from tenants before deducting any expenses. Includes base rent, late fees, pet fees, parking fees, and other recurring charges.
Gross rent:
| $3,200 | $38,400 | |
Vacancy LossExpected loss of rent due to vacancies.
Vacancy loss:
(6%)
| 6% | -$192 | -$2,304 |
Operating IncomeGross rental income minus vacancy loss. Calculation:Gross rent - Vacancy loss
Operating income:
| $3,008 | $36,096 |
Operating Expenses
| % Rent | Monthly | Yearly | |
|---|---|---|---|
Property TaxesAnnual taxes levied by local governments on real estate properties. These taxes fund public services like schools, roads, and emergency services. | 11% | -$349 | -$4,189 |
InsuranceThe costs for insurance coverage to protect against financial losses due to risks like fire, natural disasters, theft, liability, or tenant-related damages. Calculation:Assumes 7% of gross rental income, unless insurance rates are specified. | 7% | -$224 | -$2,688 |
Property ManagementThe costs associated with hiring a property manager to handle the day-to-day operations of a rental property. Includes management fees, leasing fes, eviction fees, etc. Calculation:Assumes 8% of gross rental income. | 8% | -$256 | -$3,072 |
Repairs & MaintenanceOngoing costs for routine upkeep and minor fixes needed to keep a property in good working condition. Calculation:Assumes 5% of gross rental income. Varies by property age and condition. | 5% | -$160 | -$1,920 |
Capital ExpensesLarge, infrequent costs for major improvements or replacements, like a new roof, HVAC system, or appliances. Calculation:Assumes 5% of gross rental income. Varies by property age. | 5% | -$160 | -$1,920 |
HOA FeesRegular dues paid to a Homeowners Association for community maintenance, amenities, and management. Similar fees include: Condo Association Fees, Co-op Maintenance Fees, etc. | n/a | n/a | n/a |
Operating ExpensesRecurring costs required to maintain and manage a rental property, including property taxes, insurance, maintenance, repairs, utilities (if paid by the owner), property management fees, and other day-to-day expenses. Calculation:Insurance + Property Taxes + Property Management + Repairs & Maintenance + Capital Expenditures + HOA Fees | 36% | -$1,149 | -$13,789 |
Cash Flow
| Monthly | Yearly | |
|---|---|---|
Net Operating Income (NOI)The income generated from a property after deducting all operating expenses but before deducting mortgage payments, taxes, and capital expenditures. Calculation:Gross Operating Income - Operating Expenses
Net operating income:
| $1,859 | $22,308 |
Mortgage PaymentThe fixed amount a borrower pays each month to repay a loan. It typically includes principal and interest (P&I) and may also cover property taxes, insurance, HOA fees, and PMI if escrowed. | -$3,996 | -$47,952 |
Cash FlowNet Operating Income (NOI) minus mortgage payments. Calculation:NOI - Mortgage Payments | -$2,137 | -$25,644 |