$2,640,000
Investment Summary
- Monthly Cash Flow
- -$8,297
- Cap Rate
- 2.4%
- Cash-on-Cash Return
- -16.4%
- Debt Coverage Ratio
- 0.39
- Internal Rate of Return (5 years)
- -11.9%
Cash Flow
Net Operating Income (NOI) minus mortgage payments.
Calculation:
NOI - Mortgage Payments
Cap Rate (Market Value)
Capitalization Rate is a rate of return that compares the yearly Net Operating Income (NOI) to the market value.
Calculation:
NOI / Market Value
Cash-on-Cash Return (CoC)
Annual Cash Flow / Cash Invested
Calculation:
Annual cash flow divided by initial cash invested.
Debt Coverage Ratio (DCR)
Net Operating Income (NOI) divided by total debt payments.
Calculation:
NOI / Total Debt Payments
Internal Rate of Return (IRR)
A metric for assessing profitability over time. IRR is the discount rate at which the net present value (NPV) of all future cash flows (positive and negative) from an investment equals zero — including both periodic cash flow (such as rent) and a projected sale at the end of the holding period. It represents the expected annualized return, accounting for income, expenses, and the recovery of capital through a future sale.
Property Description
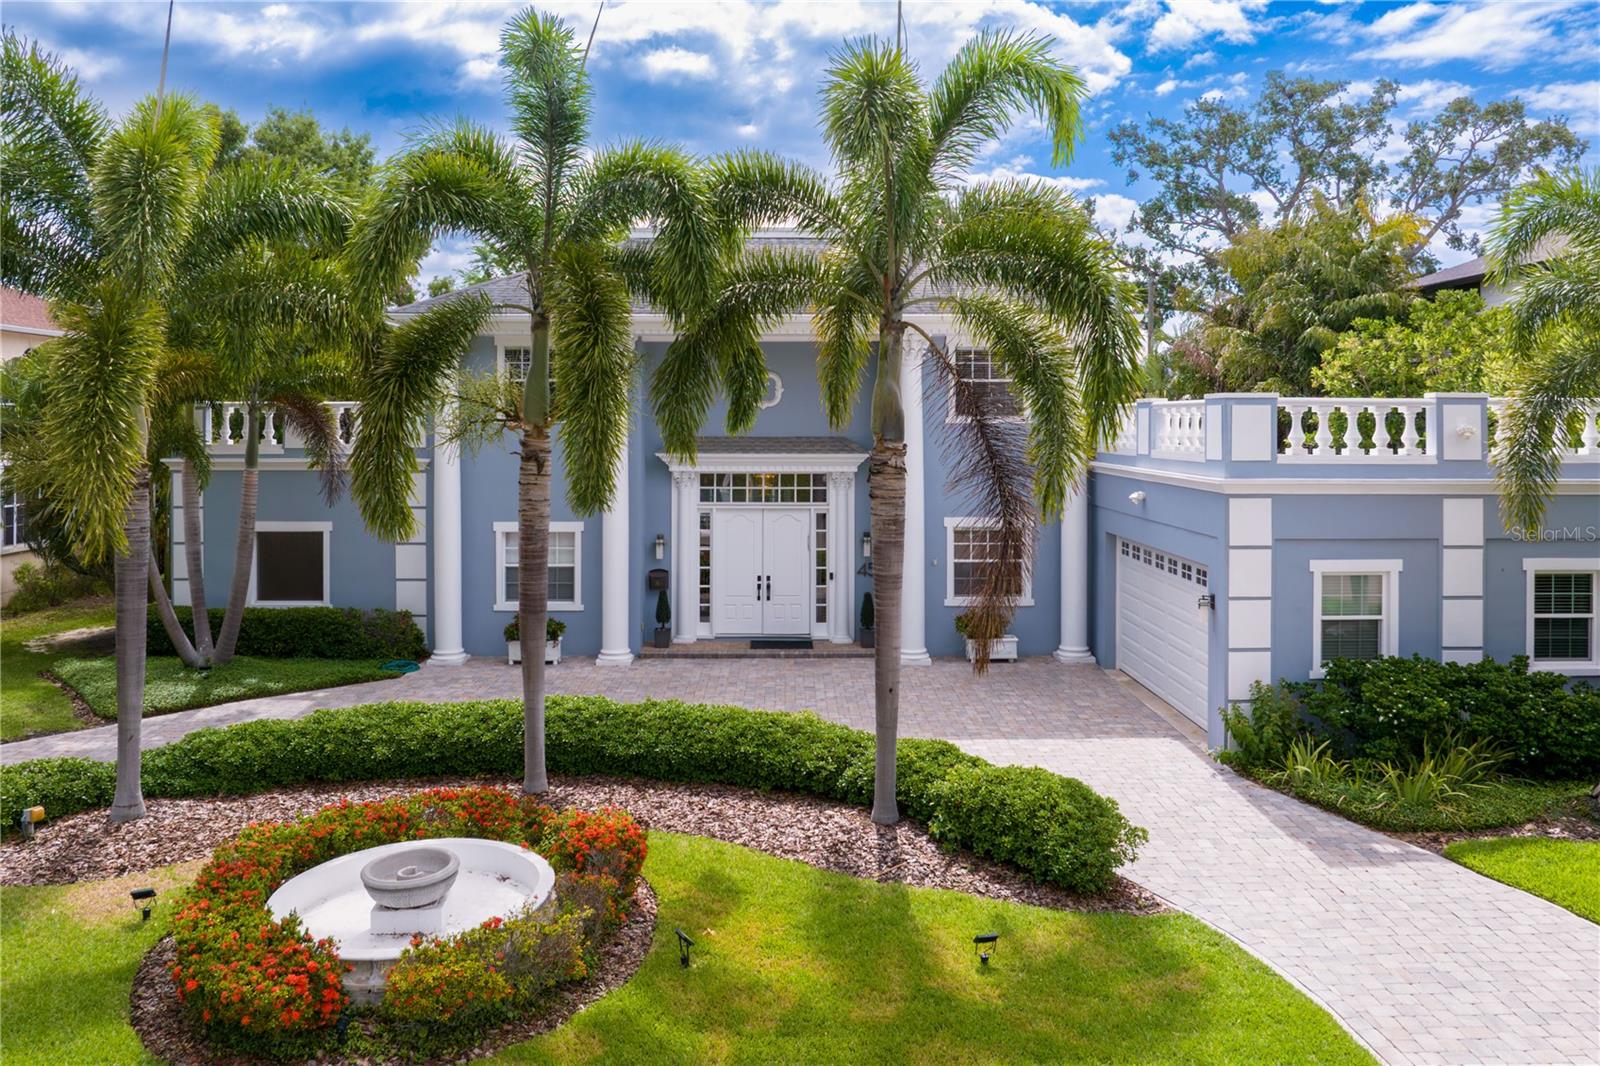
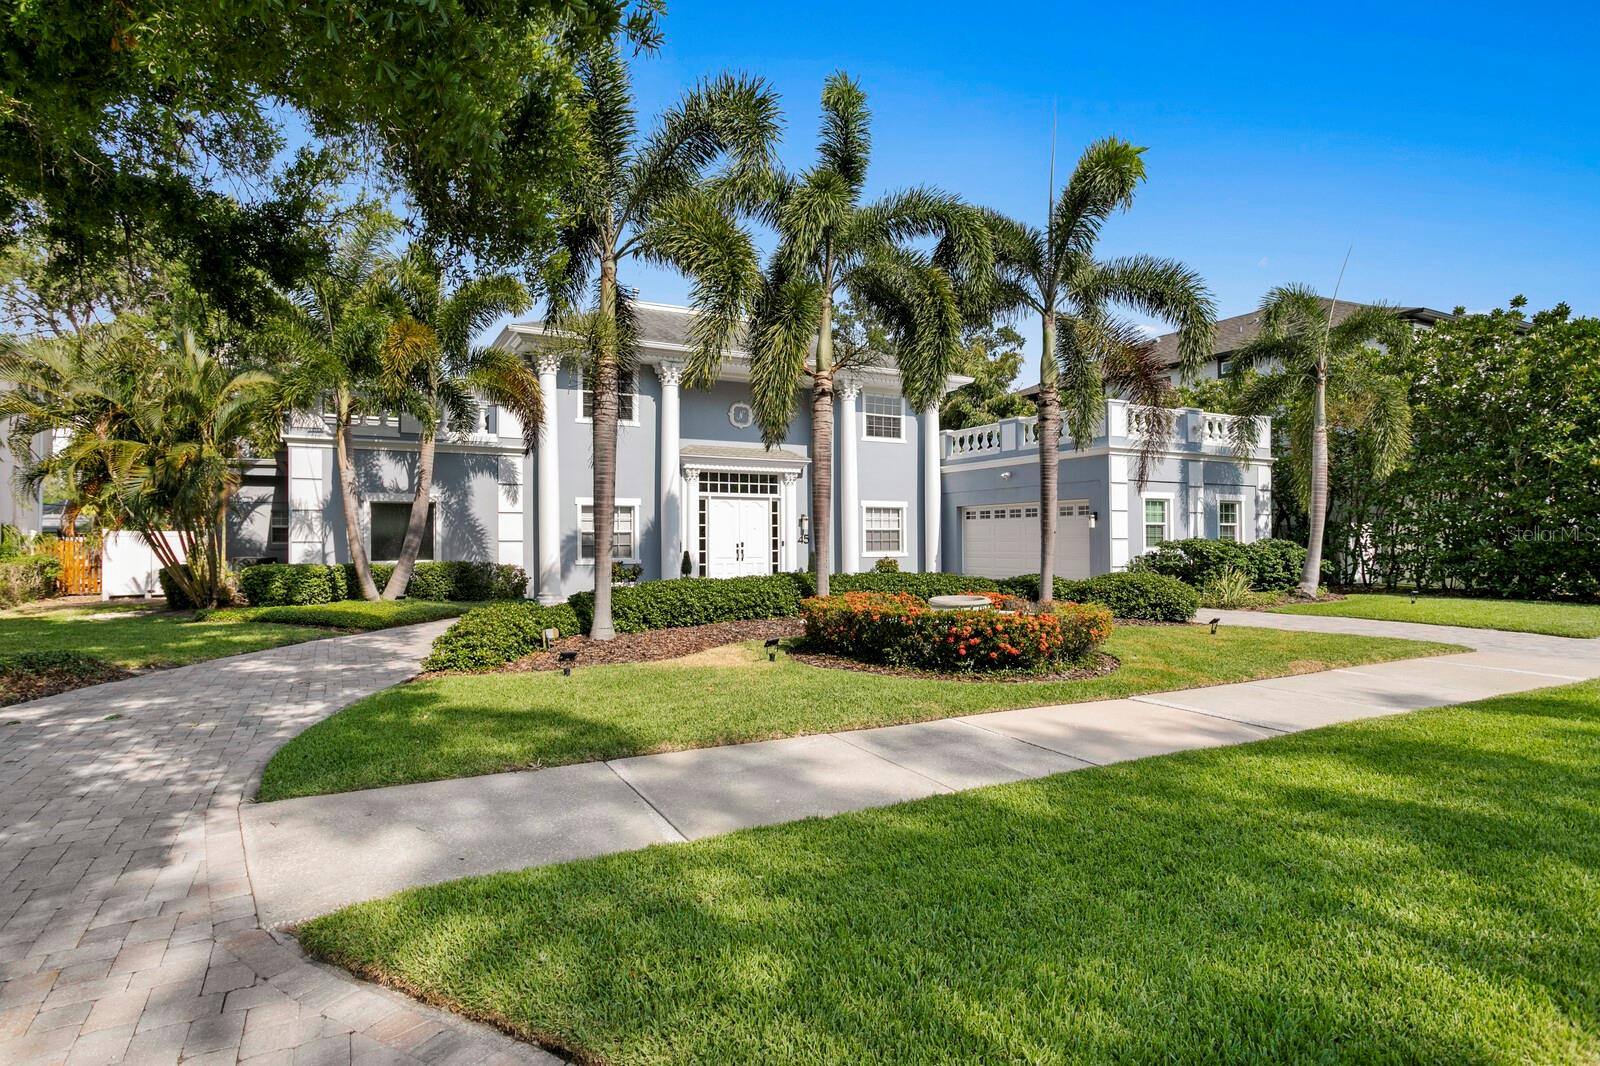
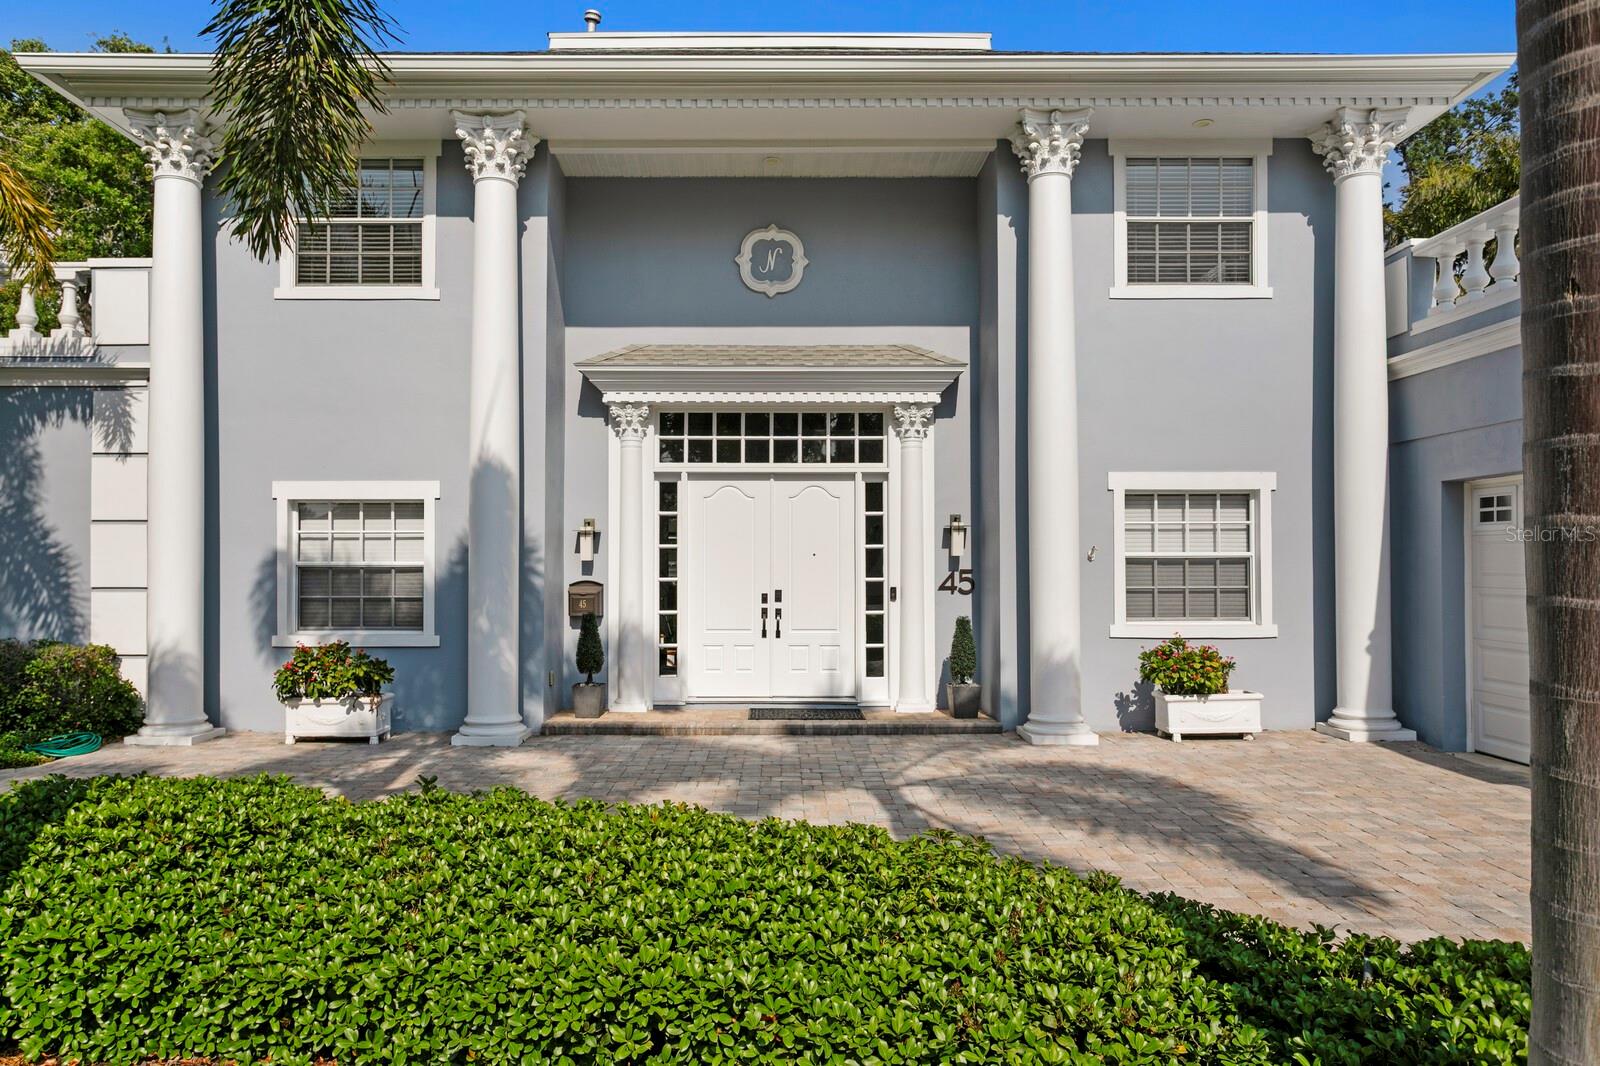
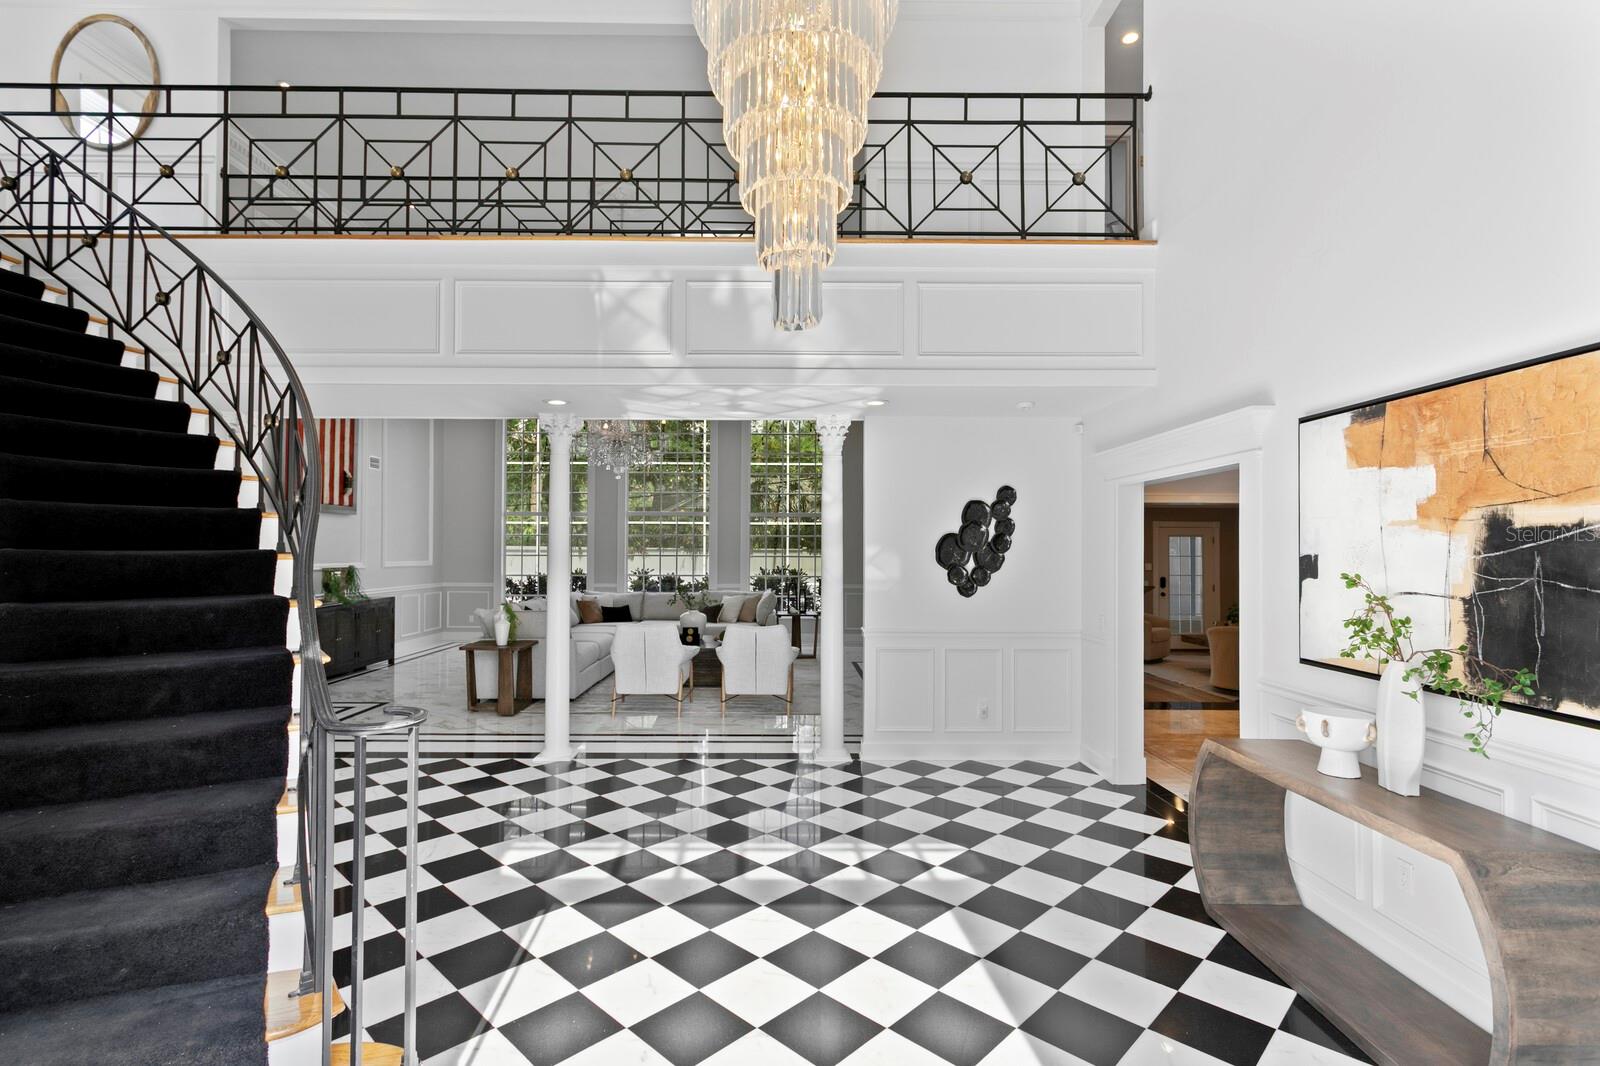
Just updated! Welcome to 45 Adalia Avenue, where timelessness charm meets traditional elegance. This breathtaking estate, situated on a double lot (100X125) on one of the most sought-after streets on Davis Islands, features four bedrooms with primary suite on first level and two and half bathrooms, plus a separate pool house with two additional bedrooms and bathroom upstairs. As you step through the front door, you’ll be greeted by soaring 20-foot ceilings, a stunning chandelier, and abundant natural light beaming through the large windows. The checkered marble flooring seamlessly flows through to the grand ballroom and dining room, creating a striking first impression. The ballroom overlooks the heated Pentair-controlled pool and spa, which is enclosed within a two-story screen. Outside, you’ll find a summer kitchen complete with a LYNX Barbeque grill, beverage fridge, sink , encased with Werever Cabinets, made from UV-stabilized high-density polyethylene with a lifetime warranty. This estate has been thoughtfully updated, with extensive renovations completed in 2025. The chef’s kitchen is equipped with top-of-the-line appliances, including BRAND new Sub-Zero refrigerator and six-burner gas Wolf Range with Wolf hood plus a Wolf in-cabinet microwave. The kitchen also features a large walk-in pantry that leads to the laundry room and two-car garage. The primary suite is located on the first floor, offering a luxurious glass-enclosed double rainfall SteamSpa with digital controls and dual benches, an oversized jetted bathtub, and a massive walk-in closet. The suite opens directly with sliding glass doors to the pool. Upstairs, you’ll find three additional and a shared bathroom. The home includes smart features including Philips Hue color lighting, Lutron lighting controls with scenes schedules and event triggered actions. Lights can be controlled using wall switches, voice control, and smart phones. Home also includes new Ring Security System with 6 Cameras, and remote control for the Pentair pool system. The property is equipped with two newer 5-ton HVAC units and a new mini split system for the pool house. Interior finishes include BRAND NEW luxury vinyl, brand new interior and exterior paint, marble flooring, custom, and travertine flooring, intricate dental crown molding throughout, floor-to- ceiling windows, and a sweeping staircase with wrought iron railings. The location is the best and truly in the heart of Davis Islands. This premier home offers easy access to tennis courts, many parks, shops, restaurants, Duckweed Urban Grocery, and the Davis Islands Yacht Club. Just minutes from Downtown Tampa, Tampa General Hospital, The Tampa Riverwalk, and Bayshore Boulevard Sidewalk trail, and a 20-minute drive to Tampa International Airport, and 30 minutes to some of the best beaches in Tampa. Located in highly esteemed schools Plant High School, Wilson Middle School and Gorrie Elementary. Call today to schedule your private showing.
Build Your Team
Quickly find investor-friendly professionals who can help you succeed in real estate investing at any stage of the investing journey.


Agents
Match with investor-friendly agents who can help you find, analyze, and close your next deal


Lenders
Get the best funding…find investor-friendly lenders who specialize in your deal strategy


Property Managers
Transition to passive investing. Find a trusted property management partnership that lasts.


Tax Pros & Accountants
Taxes and financial reporting made easy—find experts to create tax savings strategies, file taxes, and more
Location
Property Details
Parking
- Description: Garage
- Details: Driveway, Attached
- Garage Spaces: 2
- Spaces Total: 0
Bedroom Information
- # of Bedrooms: 5
Bathroom Information
- # of Baths (Full): 3
- # of Baths (Total): 4.0
Interior Features
- # of Rooms: 4
- # of Stories: 2
- Fireplace: Yes
Exterior Features
- Exterior Walls Materials: Concrete Block
- Foundation: Block, Slab
- Roof Type: Mansard
- Roof Material: Shingle
- Pool: Yes
Land Information
- Land Use: Residential
- Land Use Subtype: Single Family Residential
Lot Information
- Parcel ID: A252918509000005000400
- Lot Size: 12500 sqft
Property Information
- Property Type: Single Family Residence
- Year Built: 1954
Tax Information
- Annual Tax: $18,432
Utilities
- Water & Sewer: Public
- Heating: Central
- Cooling: Central Air, Ductless
Location
- County: Hillsborough
Listing Details
Investment Summary
- Monthly Cash Flow
- -$8,297
- Cap Rate
- 2.4%
- Cash-on-Cash Return
- -16.4%
- Debt Coverage Ratio
- 0.39
- Internal Rate of Return (5 years)
- -11.9%
Cash Flow
Net Operating Income (NOI) minus mortgage payments.
Calculation:
NOI - Mortgage Payments
Cap Rate (Market Value)
Capitalization Rate is a rate of return that compares the yearly Net Operating Income (NOI) to the market value.
Calculation:
NOI / Market Value
Cash-on-Cash Return (CoC)
Annual Cash Flow / Cash Invested
Calculation:
Annual cash flow divided by initial cash invested.
Debt Coverage Ratio (DCR)
Net Operating Income (NOI) divided by total debt payments.
Calculation:
NOI / Total Debt Payments
Internal Rate of Return (IRR)
A metric for assessing profitability over time. IRR is the discount rate at which the net present value (NPV) of all future cash flows (positive and negative) from an investment equals zero — including both periodic cash flow (such as rent) and a projected sale at the end of the holding period. It represents the expected annualized return, accounting for income, expenses, and the recovery of capital through a future sale.
Purchase Details
Purchase PriceThe price paid for the property. Purchase price:
| $2,640,000 |
|---|---|
Amount FinancedThe amount of the purchase financed through a loan. Amount financed:
| -$2,112,000 |
Down paymentThe initial payment made towards the purchase. Down payment:
| $528,000 |
Closing CostsFees and expenses associated with purchasing a property, typically ranging from 2% to 5% of the home’s purchase price, paid at the end of a home purchase to cover services like lending, title transfer, and taxes. Closing costs:
| $79,200 |
Rehab CostsCosts incurred to repair or improve the property, including: roof, flooring, exterior siding, kitchen, exterior paint, bathrooms, etc. Rehab costs:
| $0 |
Initial Cash InvestedThe total initial cash invested in the property. Calculation:Down payment + Buying costs + Rehab costs Initial cash invested:
| $607,200 |
Square Feet (SQFT)The total square footage of the property. Square feet:
| 4,413 |
Cost Per Square FootCost per square foot of the property. Calculation:Purchase Price / Square Feet Cost per square foot:
| $598 |
Monthly Rent Per Square FootMonthly rent divided by the number of square feet. This ratio helps investors compare rental income efficiency across properties, markets, and unit sizes Calculation:Monthly Rent / Square Feet Monthly rent per square foot:
| $2.22 |
Financing Details
Loan AmountThe total sum of money borrowed from a lender to finance a property purchase. Calculation:Purchase Price - Down Payment
Loan amount:
| $2,112,000 |
|---|---|
Loan to Value Ratio (LTV)Loan amount divided by the market value of the property. Calculation:Loan Amount / Market Value
Loan to value ratio:
| 80.0% |
Loan TypeThe type of loan (e.g., fixed, adjustable).
Loan type:
| Amortizing |
TermThe loan repayment period in years.
Term:
| 30 years |
Interest RateThe percentage a lender charges on the borrowed amount of a loan, determining the cost of borrowing money.
Interest rate:
| 6.625% |
Principal & Interest (PI)The principal is the portion of the loan payment that reduces the loan balance. The interest is the lender's charge for borrowing money. Calculation:(P * r * (1 + r) ** n) / ((1 + r) ** n - 1) Where:
P = Loan amount (principal)
Principal & interest:
| $13,523 |
Property TaxesAnnual taxes levied by local governments on real estate properties. These taxes fund public services like schools, roads, and emergency services.
Property tax:
| $1,536 |
InsuranceThe costs for insurance coverage to protect against financial losses due to risks like fire, natural disasters, theft, liability, or tenant-related damages. Calculation:Assumes 7% of gross rental income, unless insurance rates are specified.
Insurance:
| $686 |
Private Mortgage Insurance (PMI)A fee that borrowers pay when they take out a conventional loan with a loan-to-value (LTV) ratio above 80%.
Private mortgage insurance (PMI):
| $0 |
Monthly PaymentThe fixed amount a borrower pays each month to repay a loan. It typically includes principal and interest (P&I) and may also cover property taxes, insurance, HOA fees, and PMI if escrowed. Monthly payment:
| $15,745 |
Operating Income
| % Rent | Monthly | Yearly | |
|---|---|---|---|
Gross RentThe total rental income received from tenants before deducting any expenses. Includes base rent, late fees, pet fees, parking fees, and other recurring charges.
Gross rent:
| $9,800 | $117,600 | |
Vacancy LossExpected loss of rent due to vacancies.
Vacancy loss:
(6%)
| 6% | -$588 | -$7,056 |
Operating IncomeGross rental income minus vacancy loss. Calculation:Gross rent - Vacancy loss
Operating income:
| $9,212 | $110,544 |
Operating Expenses
| % Rent | Monthly | Yearly | |
|---|---|---|---|
Property TaxesAnnual taxes levied by local governments on real estate properties. These taxes fund public services like schools, roads, and emergency services. | 16% | -$1,536 | -$18,433 |
InsuranceThe costs for insurance coverage to protect against financial losses due to risks like fire, natural disasters, theft, liability, or tenant-related damages. Calculation:Assumes 7% of gross rental income, unless insurance rates are specified. | 7% | -$686 | -$8,232 |
Property ManagementThe costs associated with hiring a property manager to handle the day-to-day operations of a rental property. Includes management fees, leasing fes, eviction fees, etc. Calculation:Assumes 8% of gross rental income. | 8% | -$784 | -$9,408 |
Repairs & MaintenanceOngoing costs for routine upkeep and minor fixes needed to keep a property in good working condition. Calculation:Assumes 5% of gross rental income. Varies by property age and condition. | 5% | -$490 | -$5,880 |
Capital ExpensesLarge, infrequent costs for major improvements or replacements, like a new roof, HVAC system, or appliances. Calculation:Assumes 5% of gross rental income. Varies by property age. | 5% | -$490 | -$5,880 |
HOA FeesRegular dues paid to a Homeowners Association for community maintenance, amenities, and management. Similar fees include: Condo Association Fees, Co-op Maintenance Fees, etc. | n/a | n/a | n/a |
Operating ExpensesRecurring costs required to maintain and manage a rental property, including property taxes, insurance, maintenance, repairs, utilities (if paid by the owner), property management fees, and other day-to-day expenses. Calculation:Insurance + Property Taxes + Property Management + Repairs & Maintenance + Capital Expenditures + HOA Fees | 41% | -$3,986 | -$47,833 |
Cash Flow
| Monthly | Yearly | |
|---|---|---|
Net Operating Income (NOI)The income generated from a property after deducting all operating expenses but before deducting mortgage payments, taxes, and capital expenditures. Calculation:Gross Operating Income - Operating Expenses
Net operating income:
| $5,226 | $62,712 |
Mortgage PaymentThe fixed amount a borrower pays each month to repay a loan. It typically includes principal and interest (P&I) and may also cover property taxes, insurance, HOA fees, and PMI if escrowed. | -$13,523 | -$162,276 |
Cash FlowNet Operating Income (NOI) minus mortgage payments. Calculation:NOI - Mortgage Payments | $8,297 | $99,564 |