$2,295,000
Investment Summary
- Monthly Cash Flow
- -$10,808
- Cap Rate
- 0.5%
- Cash-on-Cash Return
- -24.6%
- Debt Coverage Ratio
- 0.08
- Internal Rate of Return (5 years)
- -19.7%
Cash Flow
Net Operating Income (NOI) minus mortgage payments.
Calculation:
NOI - Mortgage Payments
Cap Rate (Market Value)
Capitalization Rate is a rate of return that compares the yearly Net Operating Income (NOI) to the market value.
Calculation:
NOI / Market Value
Cash-on-Cash Return (CoC)
Annual Cash Flow / Cash Invested
Calculation:
Annual cash flow divided by initial cash invested.
Debt Coverage Ratio (DCR)
Net Operating Income (NOI) divided by total debt payments.
Calculation:
NOI / Total Debt Payments
Internal Rate of Return (IRR)
A metric for assessing profitability over time. IRR is the discount rate at which the net present value (NPV) of all future cash flows (positive and negative) from an investment equals zero — including both periodic cash flow (such as rent) and a projected sale at the end of the holding period. It represents the expected annualized return, accounting for income, expenses, and the recovery of capital through a future sale.
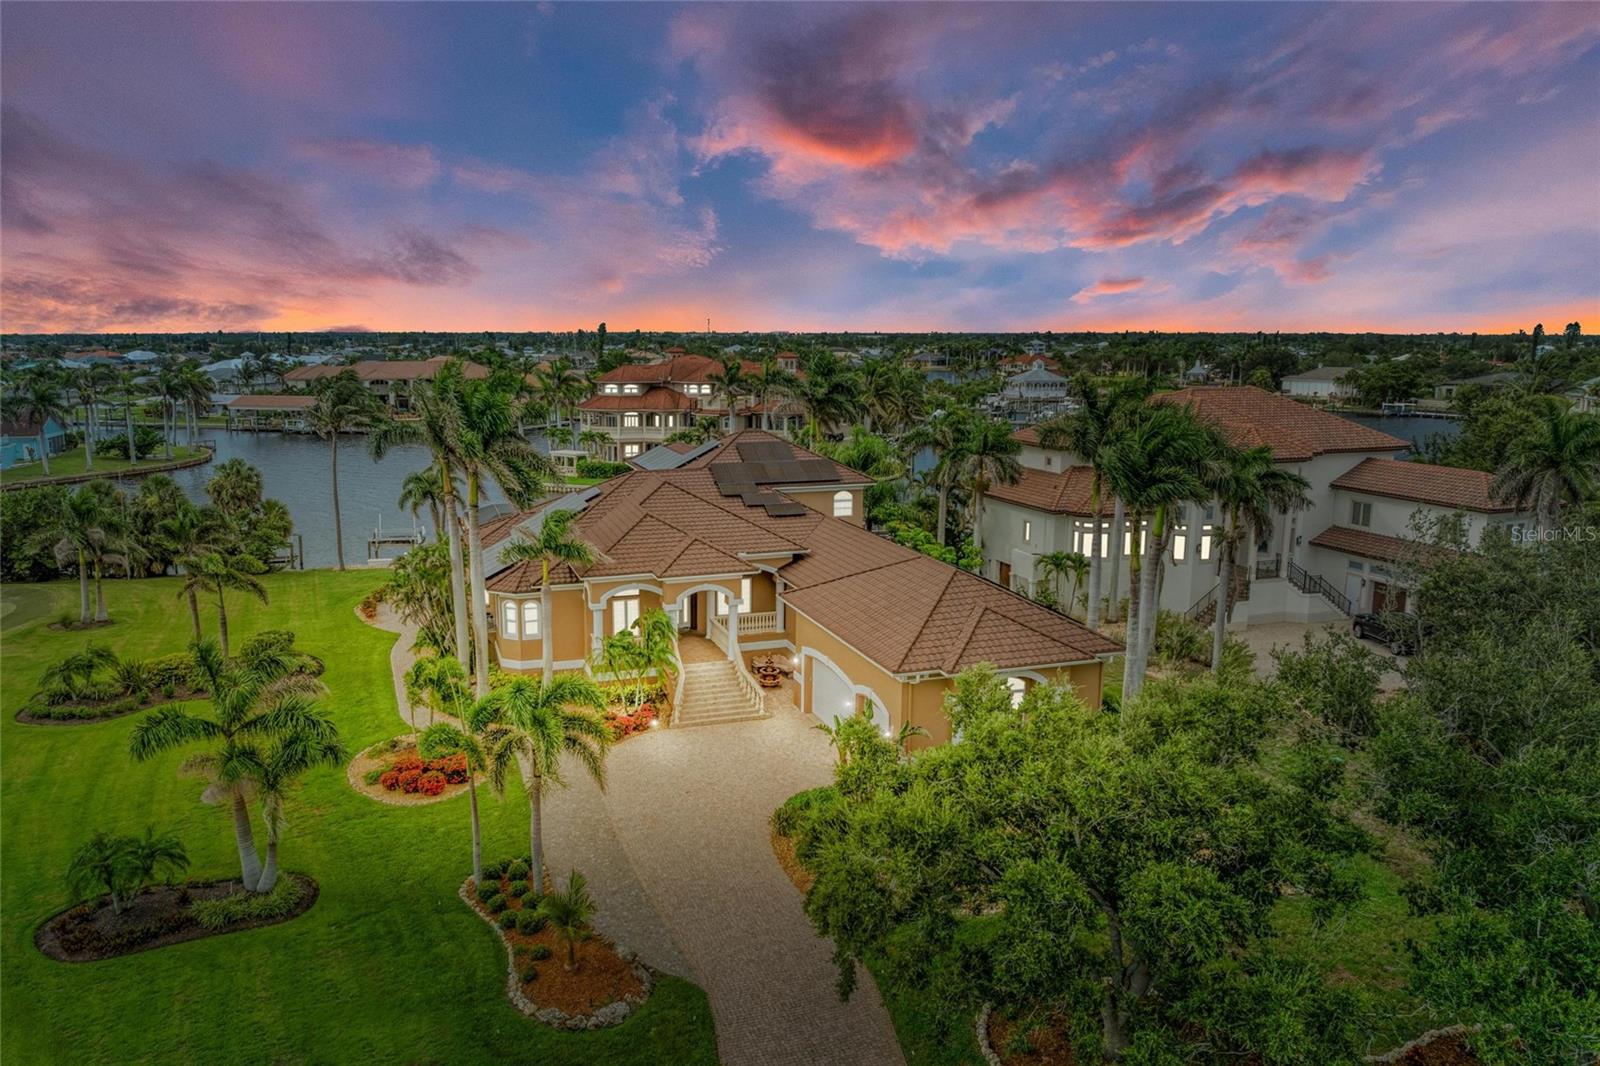
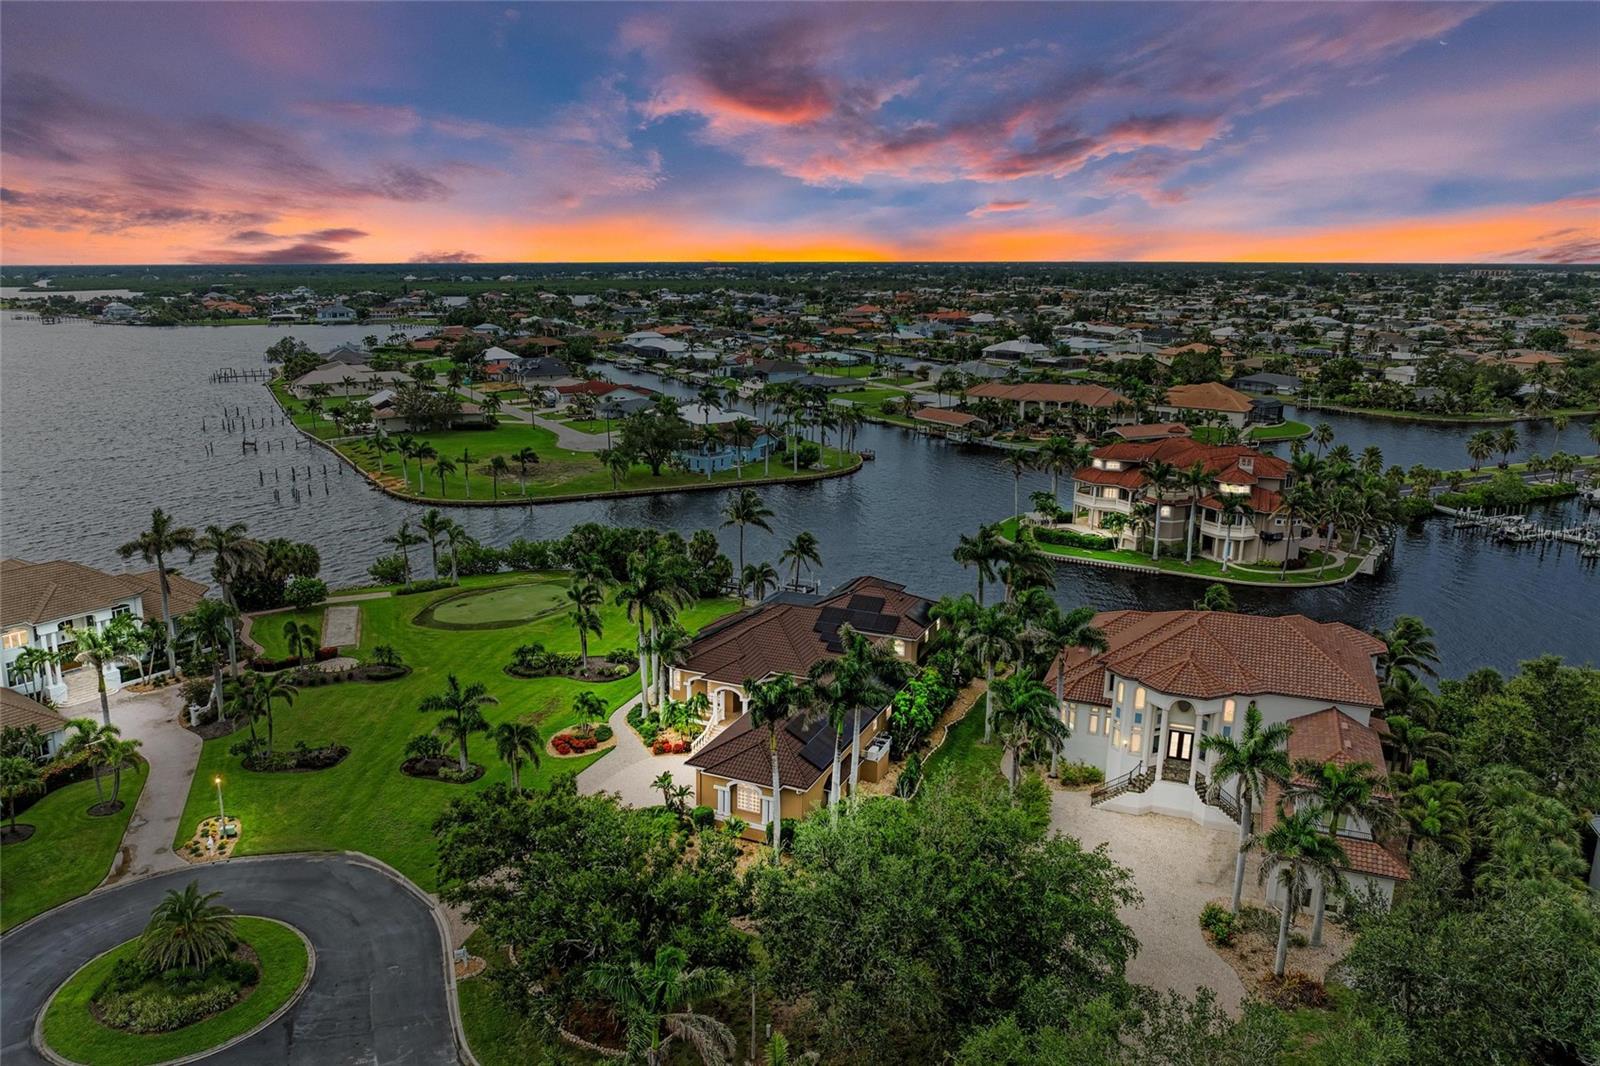
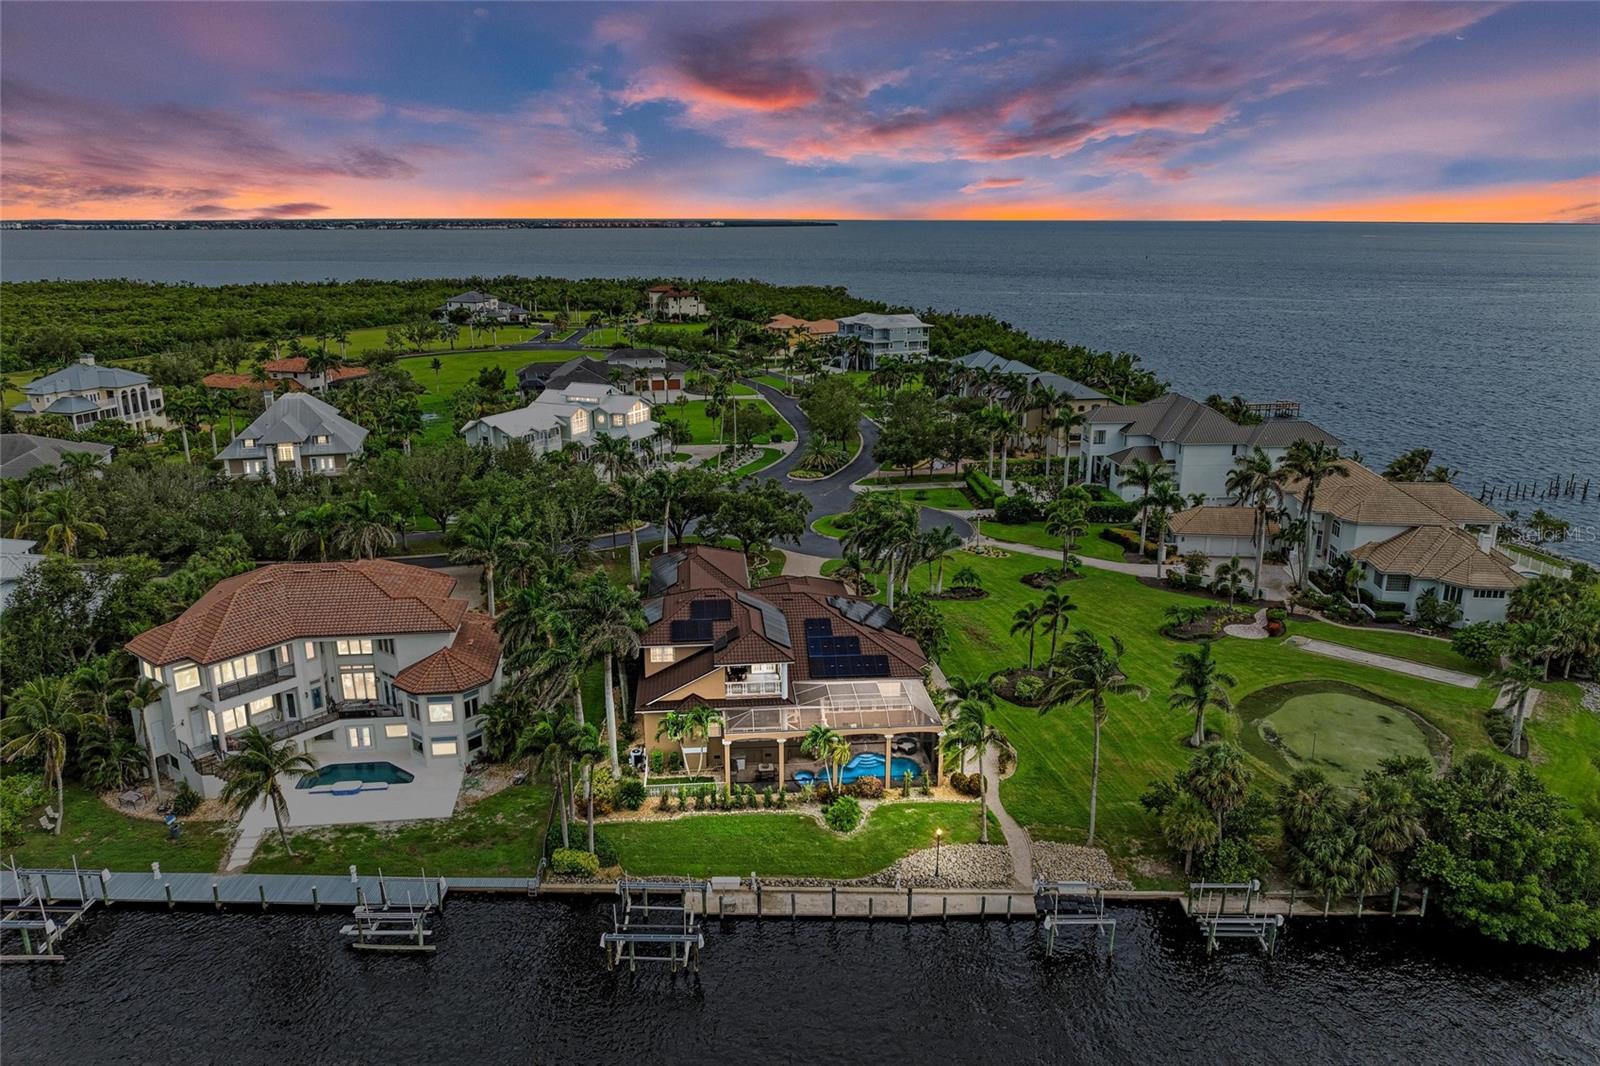
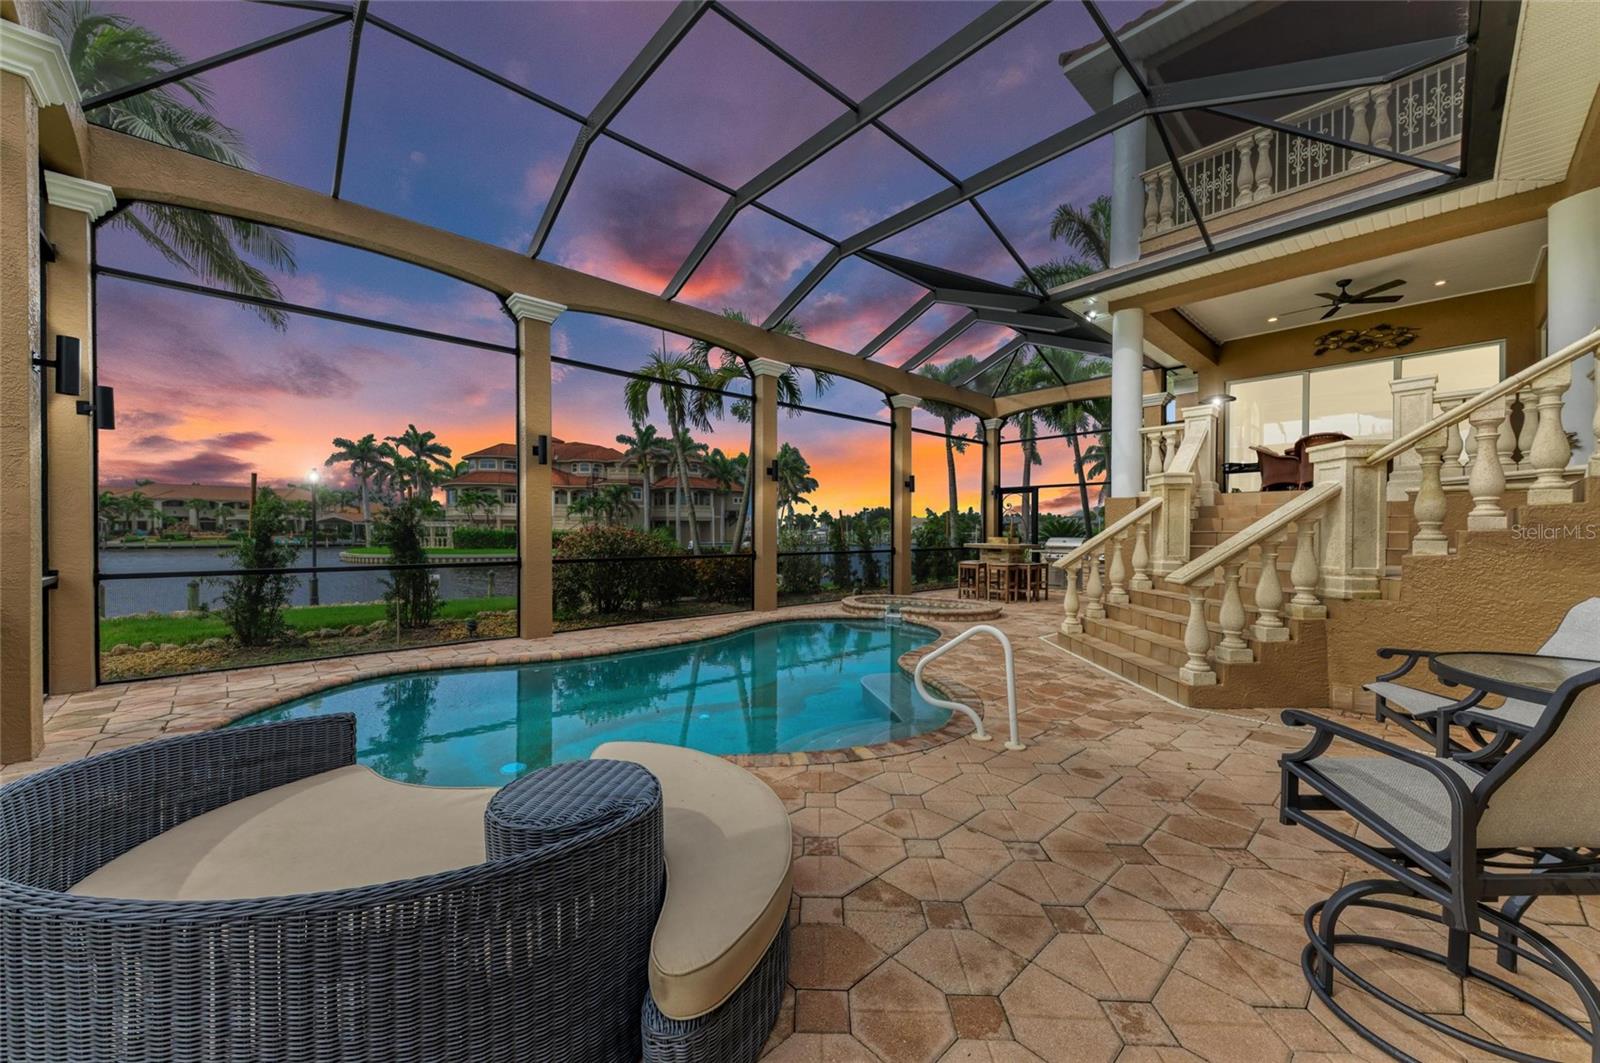
Property Description
Welcome to Grassy Point Yacht Club, a rare 24-hour gated estate community on Charlotte Harbor offering private marina access, perfect for waterfront luxury living. This impeccably maintained home sits on the Elkcam Waterway, boasting panoramic harbor views and nightly sunset spectacles. The nearly 1,200-square-foot screened and covered lanai invites seamless indoor–outdoor living, with floor-to-ceiling sliding glass and glass pocket doors that open onto a gorgeous pool and spa deck. Additions include a private sunning area overlooking a neighbor’s putting green and custom Nebula lighting that sets a refined ambiance for evening entertaining. For boating enthusiasts, the property provides a 30,000-pound boat lift with upgraded remote-controlled Gem system, stainless steel cables, pulleys, and aluminum supports, plus a full-length, deep-water concrete dock accommodating vessels up to 55 feet. A second 6,000-pound lift offers convenience for jet skis or another boat, and all 22 pilings have been freshly serviced. Dockside amenities also include dual 50 amp and 30 amp power/water stations. In 2025, the residence received extensive luxury enhancements: the interior and exterior were freshly painted, the primary suite received elegant wide-plank porcelain tile flooring, and the home was outfitted with ten high-end ceiling fans, recessed LED lighting, and premium linear HVAC vents. The kitchen has been transformed with designer quartz countertops, backsplash, a new refrigerator, dishwasher, wine/beverage cooler, plus under- and over-cabinet lighting. Both covered porches have tongue-and-groove wood ceilings, and the landscape was fully renovated with new irrigation and an underground 250-gallon propane tank powering the outdoor kitchen and lanai fireplace. Built to stand the test of time, the home features a 50-year Boral stone-coated steel roof, a solar system generating 110% of its power needs, two high-efficiency water heaters, whole-house filtration, a Generac propane generator, and three high-efficiency HVAC systems. With hurricane-rated windows, storm coverings, and four ensuite bedrooms, including primary suites on both levels, plus custom plantation shutters throughout, every detail balances comfort and resilience. The oversized garage adds room for three to six vehicles, complete with epoxy flooring, hurricane-rated doors, built-in storage, and an EV charger, while the paver driveway and walkways lead to an additional RV hookup and accentuate the residence’s polished curb appeal. This property is not just a home, it’s a waterfront sanctuary designed for entertaining, relaxation, and luxurious everyday living. Schedule a private showing to experience its full splendor. See attached feature sheet for full list of upgrades. SELLER FINANCING AVAILABLE! BE SURE TO CLICK THE FULL VIRTUAL TOUR LINKS FOR DETAILS!
Build Your Team
Quickly find investor-friendly professionals who can help you succeed in real estate investing at any stage of the investing journey.


Agents
Match with investor-friendly agents who can help you find, analyze, and close your next deal


Lenders
Get the best funding…find investor-friendly lenders who specialize in your deal strategy


Property Managers
Transition to passive investing. Find a trusted property management partnership that lasts.


Tax Pros & Accountants
Taxes and financial reporting made easy—find experts to create tax savings strategies, file taxes, and more
Location
Property Details
Parking
- Description: Garage Door Opener, Oversized
- Details: Driveway, Electric Vehicle Charging Station(s), Garage Door Opener, Off Street, Oversized, RV Access/Parking, Attached
- Garage Spaces: 3
- Spaces Total: 0
Bedroom Information
- # of Bedrooms: 4
Bathroom Information
- # of Baths (Full): 4
- # of Baths (Partial): 1
- # of Baths (Total): 5.0
Interior Features
- # of Rooms: 11
- # of Stories: 2
- Basement Description: Crawl Space
- Fireplace: Yes
Exterior Features
- Exterior Walls Materials: Concrete Block
- Foundation: Pillar/Post/Pier, Slab
- Roof Material: Metal
- Pool: Yes
HOA
- Has HOA: Yes
- Association: Star Hospitality Management Inc/ Sherry Danko
- HOA Fee: $1,725/quarterly
Land Information
- Land Use: Residential
- Land Use Subtype: Single Family Residential
Lot Information
- Parcel ID: 402227381012
- Lot Size: 27334 sqft
Property Information
- Property Type: Single Family Residence
- Style: Custom
- Year Built: 2002
Tax Information
- Annual Tax: $17,323
Utilities
- Water & Sewer: Public
- Heating: Central
- Cooling: Central Air
Location
- County: Charlotte
Listing Details
Investment Summary
- Monthly Cash Flow
- -$10,808
- Cap Rate
- 0.5%
- Cash-on-Cash Return
- -24.6%
- Debt Coverage Ratio
- 0.08
- Internal Rate of Return (5 years)
- -19.7%
Cash Flow
Net Operating Income (NOI) minus mortgage payments.
Calculation:
NOI - Mortgage Payments
Cap Rate (Market Value)
Capitalization Rate is a rate of return that compares the yearly Net Operating Income (NOI) to the market value.
Calculation:
NOI / Market Value
Cash-on-Cash Return (CoC)
Annual Cash Flow / Cash Invested
Calculation:
Annual cash flow divided by initial cash invested.
Debt Coverage Ratio (DCR)
Net Operating Income (NOI) divided by total debt payments.
Calculation:
NOI / Total Debt Payments
Internal Rate of Return (IRR)
A metric for assessing profitability over time. IRR is the discount rate at which the net present value (NPV) of all future cash flows (positive and negative) from an investment equals zero — including both periodic cash flow (such as rent) and a projected sale at the end of the holding period. It represents the expected annualized return, accounting for income, expenses, and the recovery of capital through a future sale.
Purchase Details
Purchase PriceThe price paid for the property. Purchase price:
| $2,295,000 |
|---|---|
Amount FinancedThe amount of the purchase financed through a loan. Amount financed:
| -$1,836,000 |
Down paymentThe initial payment made towards the purchase. Down payment:
| $459,000 |
Closing CostsFees and expenses associated with purchasing a property, typically ranging from 2% to 5% of the home’s purchase price, paid at the end of a home purchase to cover services like lending, title transfer, and taxes. Closing costs:
| $68,850 |
Rehab CostsCosts incurred to repair or improve the property, including: roof, flooring, exterior siding, kitchen, exterior paint, bathrooms, etc. Rehab costs:
| $0 |
Initial Cash InvestedThe total initial cash invested in the property. Calculation:Down payment + Buying costs + Rehab costs Initial cash invested:
| $527,850 |
Square Feet (SQFT)The total square footage of the property. Square feet:
| 4,752 |
Cost Per Square FootCost per square foot of the property. Calculation:Purchase Price / Square Feet Cost per square foot:
| $483 |
Monthly Rent Per Square FootMonthly rent divided by the number of square feet. This ratio helps investors compare rental income efficiency across properties, markets, and unit sizes Calculation:Monthly Rent / Square Feet Monthly rent per square foot:
| $0.90 |
Financing Details
Loan AmountThe total sum of money borrowed from a lender to finance a property purchase. Calculation:Purchase Price - Down Payment
Loan amount:
| $1,836,000 |
|---|---|
Loan to Value Ratio (LTV)Loan amount divided by the market value of the property. Calculation:Loan Amount / Market Value
Loan to value ratio:
| 80.0% |
Loan TypeThe type of loan (e.g., fixed, adjustable).
Loan type:
| Amortizing |
TermThe loan repayment period in years.
Term:
| 30 years |
Interest RateThe percentage a lender charges on the borrowed amount of a loan, determining the cost of borrowing money.
Interest rate:
| 6.625% |
Principal & Interest (PI)The principal is the portion of the loan payment that reduces the loan balance. The interest is the lender's charge for borrowing money. Calculation:(P * r * (1 + r) ** n) / ((1 + r) ** n - 1) Where:
P = Loan amount (principal)
Principal & interest:
| $11,756 |
Property TaxesAnnual taxes levied by local governments on real estate properties. These taxes fund public services like schools, roads, and emergency services.
Property tax:
| $1,444 |
InsuranceThe costs for insurance coverage to protect against financial losses due to risks like fire, natural disasters, theft, liability, or tenant-related damages. Calculation:Assumes 7% of gross rental income, unless insurance rates are specified.
Insurance:
| $301 |
Private Mortgage Insurance (PMI)A fee that borrowers pay when they take out a conventional loan with a loan-to-value (LTV) ratio above 80%.
Private mortgage insurance (PMI):
| $0 |
Monthly PaymentThe fixed amount a borrower pays each month to repay a loan. It typically includes principal and interest (P&I) and may also cover property taxes, insurance, HOA fees, and PMI if escrowed. Monthly payment:
| $13,501 |
Operating Income
| % Rent | Monthly | Yearly | |
|---|---|---|---|
Gross RentThe total rental income received from tenants before deducting any expenses. Includes base rent, late fees, pet fees, parking fees, and other recurring charges.
Gross rent:
| $4,300 | $51,600 | |
Vacancy LossExpected loss of rent due to vacancies.
Vacancy loss:
(6%)
| 6% | -$258 | -$3,096 |
Operating IncomeGross rental income minus vacancy loss. Calculation:Gross rent - Vacancy loss
Operating income:
| $4,042 | $48,504 |
Operating Expenses
| % Rent | Monthly | Yearly | |
|---|---|---|---|
Property TaxesAnnual taxes levied by local governments on real estate properties. These taxes fund public services like schools, roads, and emergency services. | 34% | -$1,444 | -$17,323 |
InsuranceThe costs for insurance coverage to protect against financial losses due to risks like fire, natural disasters, theft, liability, or tenant-related damages. Calculation:Assumes 7% of gross rental income, unless insurance rates are specified. | 7% | -$301 | -$3,612 |
Property ManagementThe costs associated with hiring a property manager to handle the day-to-day operations of a rental property. Includes management fees, leasing fes, eviction fees, etc. Calculation:Assumes 8% of gross rental income. | 8% | -$344 | -$4,128 |
Repairs & MaintenanceOngoing costs for routine upkeep and minor fixes needed to keep a property in good working condition. Calculation:Assumes 5% of gross rental income. Varies by property age and condition. | 5% | -$215 | -$2,580 |
Capital ExpensesLarge, infrequent costs for major improvements or replacements, like a new roof, HVAC system, or appliances. Calculation:Assumes 5% of gross rental income. Varies by property age. | 5% | -$215 | -$2,580 |
HOA FeesRegular dues paid to a Homeowners Association for community maintenance, amenities, and management. Similar fees include: Condo Association Fees, Co-op Maintenance Fees, etc. | 13% | -$575 | -$6,900 |
Operating ExpensesRecurring costs required to maintain and manage a rental property, including property taxes, insurance, maintenance, repairs, utilities (if paid by the owner), property management fees, and other day-to-day expenses. Calculation:Insurance + Property Taxes + Property Management + Repairs & Maintenance + Capital Expenditures + HOA Fees | 72% | -$3,094 | -$37,123 |
Cash Flow
| Monthly | Yearly | |
|---|---|---|
Net Operating Income (NOI)The income generated from a property after deducting all operating expenses but before deducting mortgage payments, taxes, and capital expenditures. Calculation:Gross Operating Income - Operating Expenses
Net operating income:
| $948 | $11,376 |
Mortgage PaymentThe fixed amount a borrower pays each month to repay a loan. It typically includes principal and interest (P&I) and may also cover property taxes, insurance, HOA fees, and PMI if escrowed. | -$11,756 | -$141,072 |
Cash FlowNet Operating Income (NOI) minus mortgage payments. Calculation:NOI - Mortgage Payments | $10,808 | $129,696 |