$1,424,000
Investment Summary
- Monthly Cash Flow
- -$4,243
- Cap Rate
- 2.6%
- Cash-on-Cash Return
- -15.5%
- Debt Coverage Ratio
- 0.42
- Internal Rate of Return (5 years)
- -11.0%
Cash Flow
Net Operating Income (NOI) minus mortgage payments.
Calculation:
NOI - Mortgage Payments
Cap Rate (Market Value)
Capitalization Rate is a rate of return that compares the yearly Net Operating Income (NOI) to the market value.
Calculation:
NOI / Market Value
Cash-on-Cash Return (CoC)
Annual Cash Flow / Cash Invested
Calculation:
Annual cash flow divided by initial cash invested.
Debt Coverage Ratio (DCR)
Net Operating Income (NOI) divided by total debt payments.
Calculation:
NOI / Total Debt Payments
Internal Rate of Return (IRR)
A metric for assessing profitability over time. IRR is the discount rate at which the net present value (NPV) of all future cash flows (positive and negative) from an investment equals zero — including both periodic cash flow (such as rent) and a projected sale at the end of the holding period. It represents the expected annualized return, accounting for income, expenses, and the recovery of capital through a future sale.
Property Description
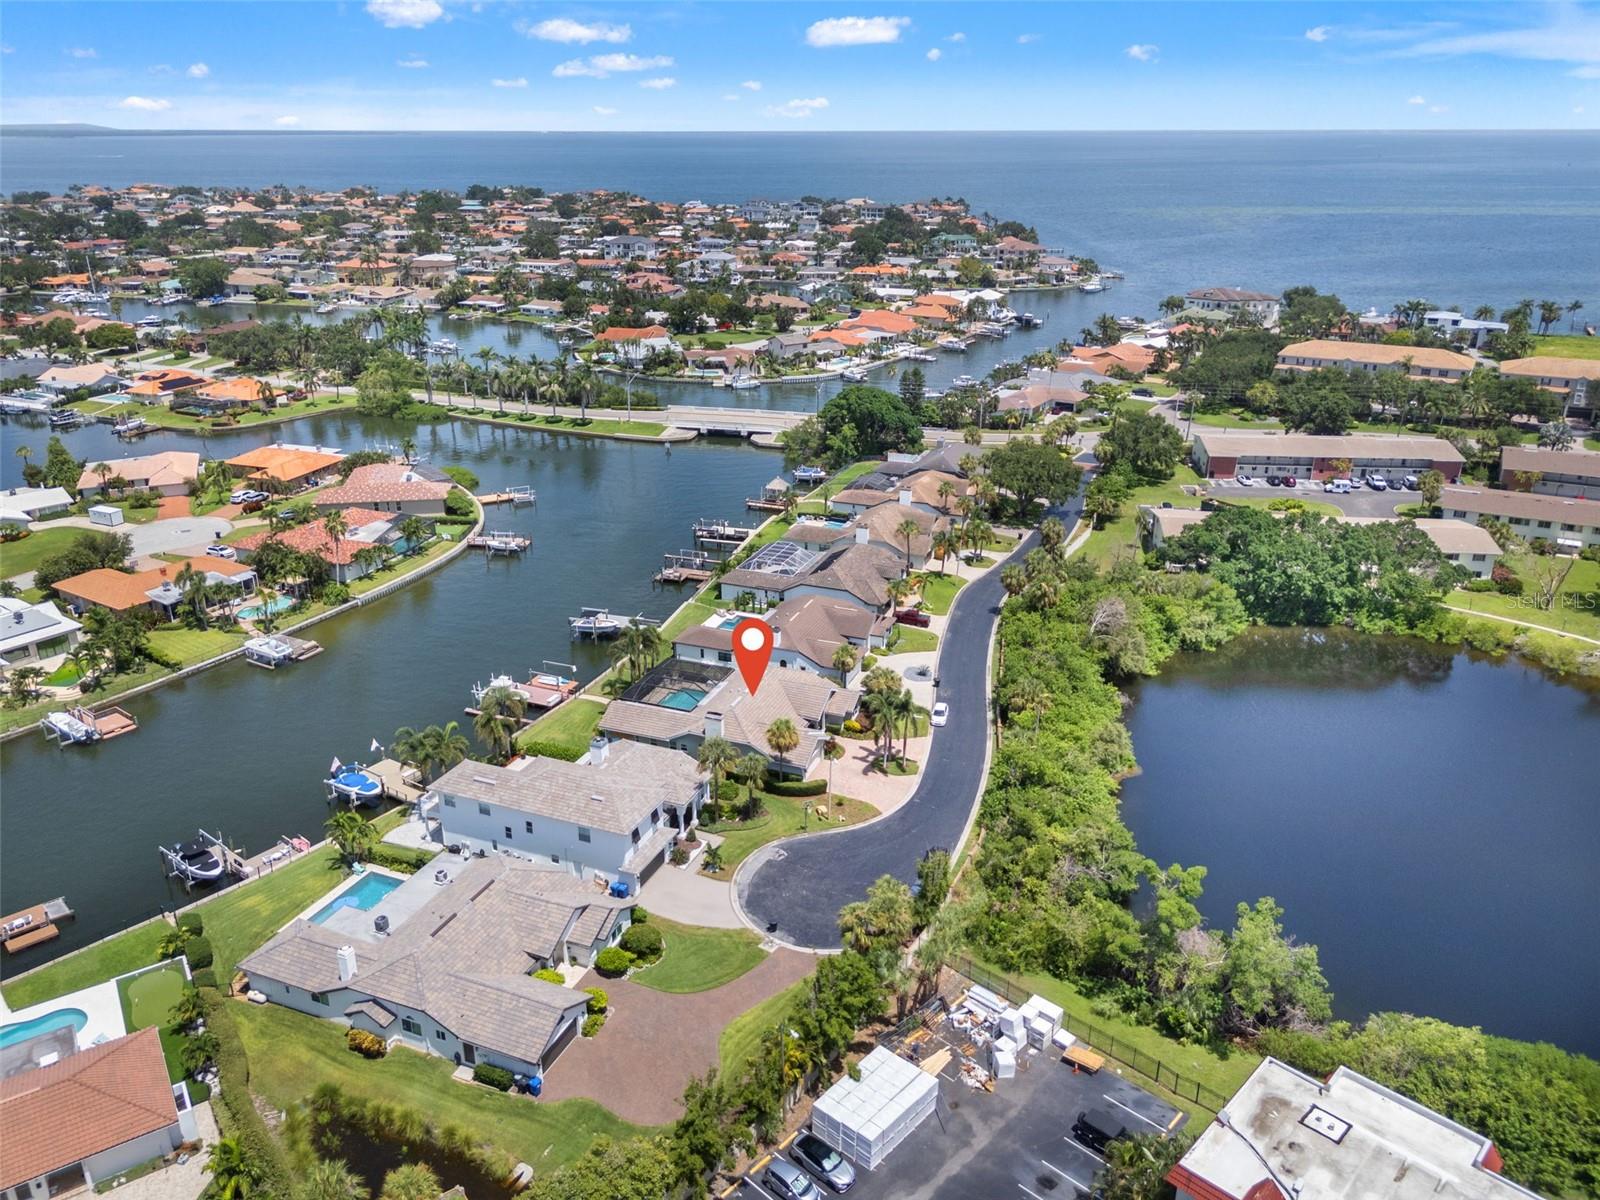
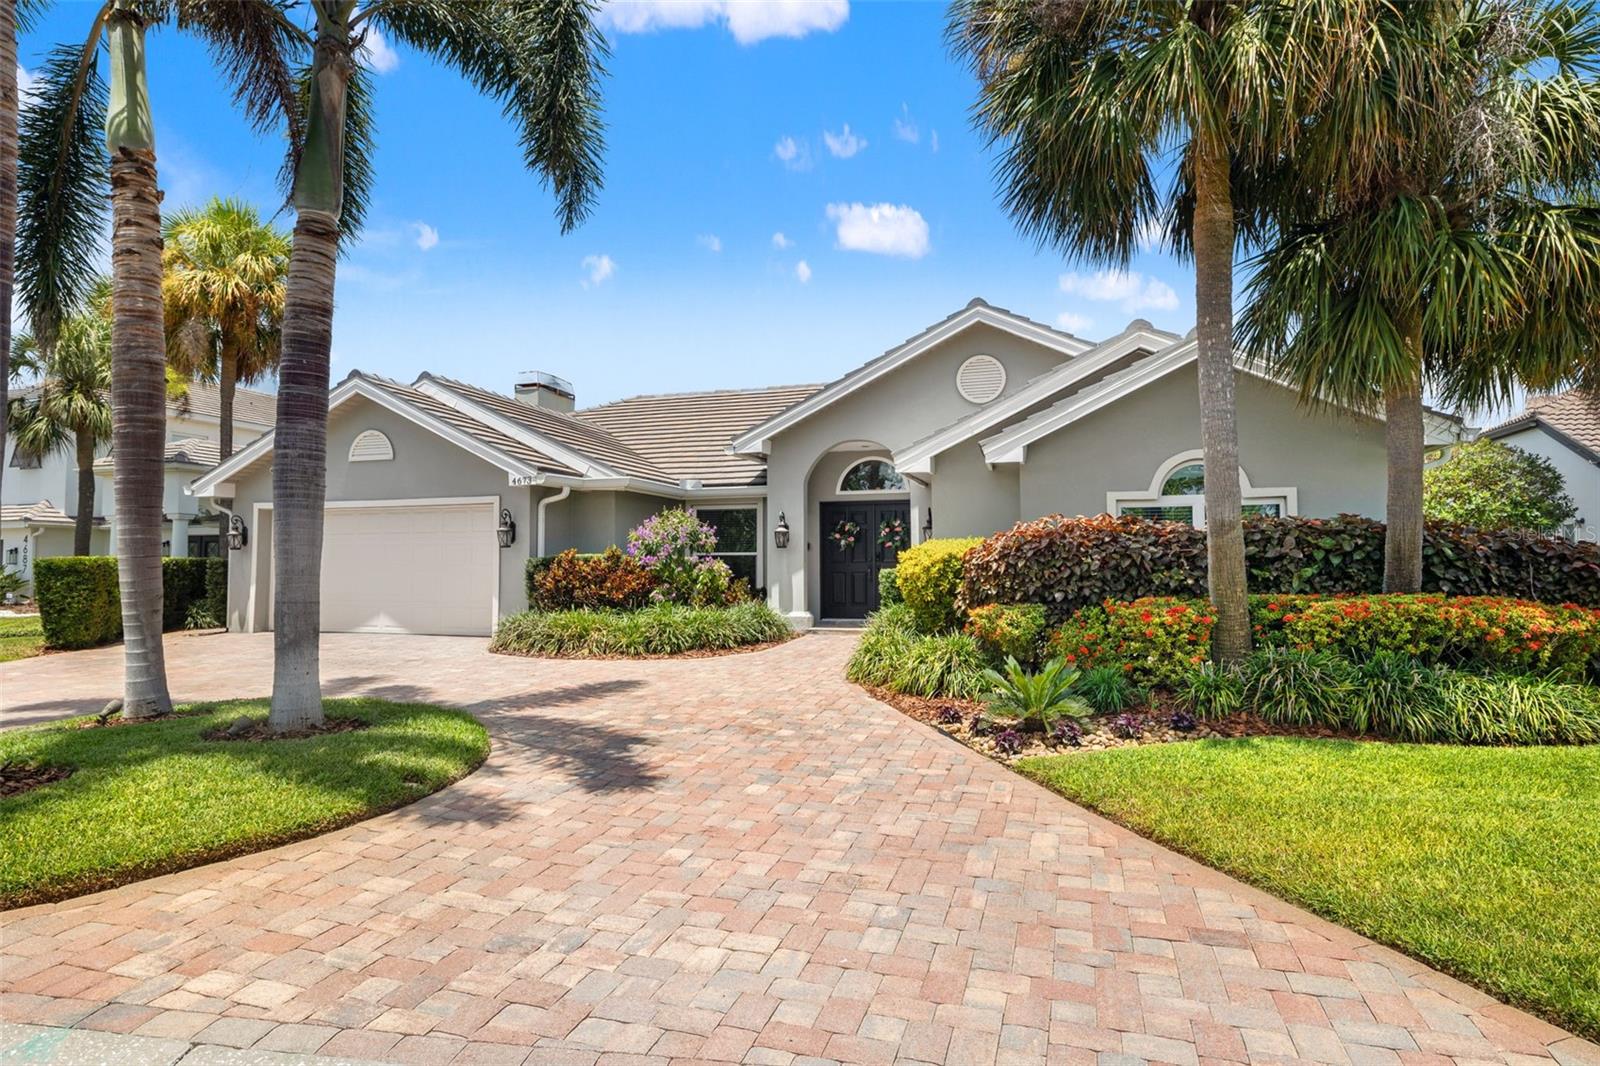
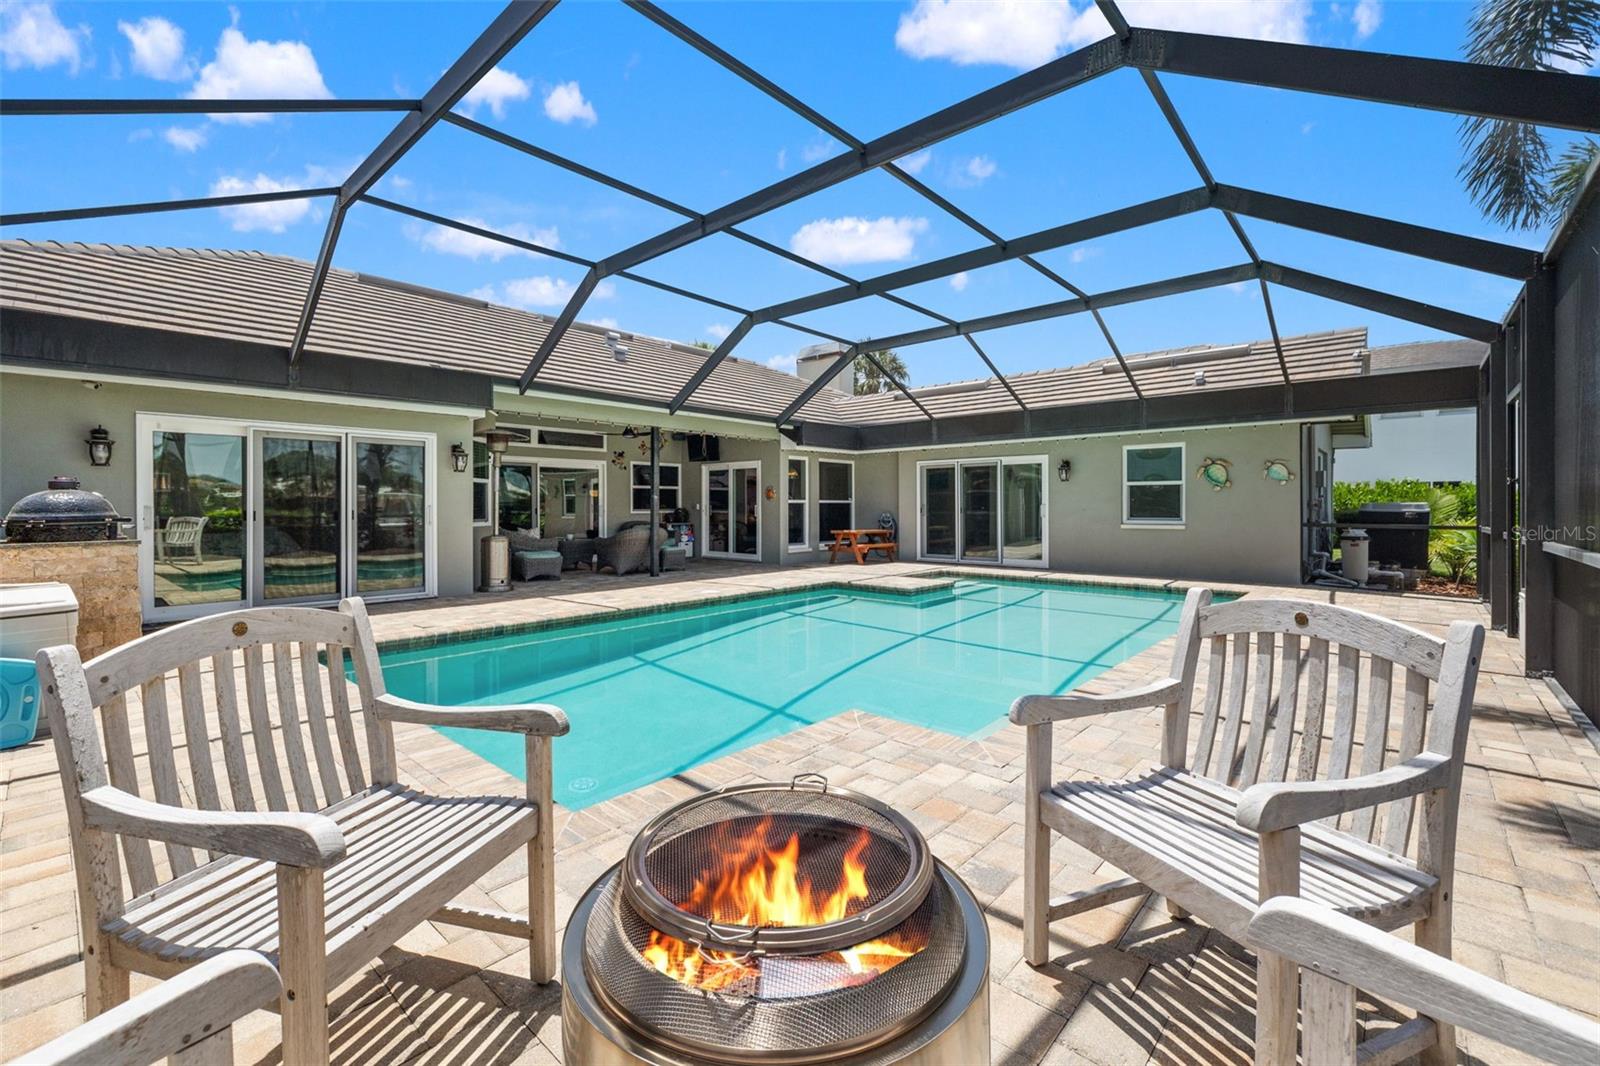
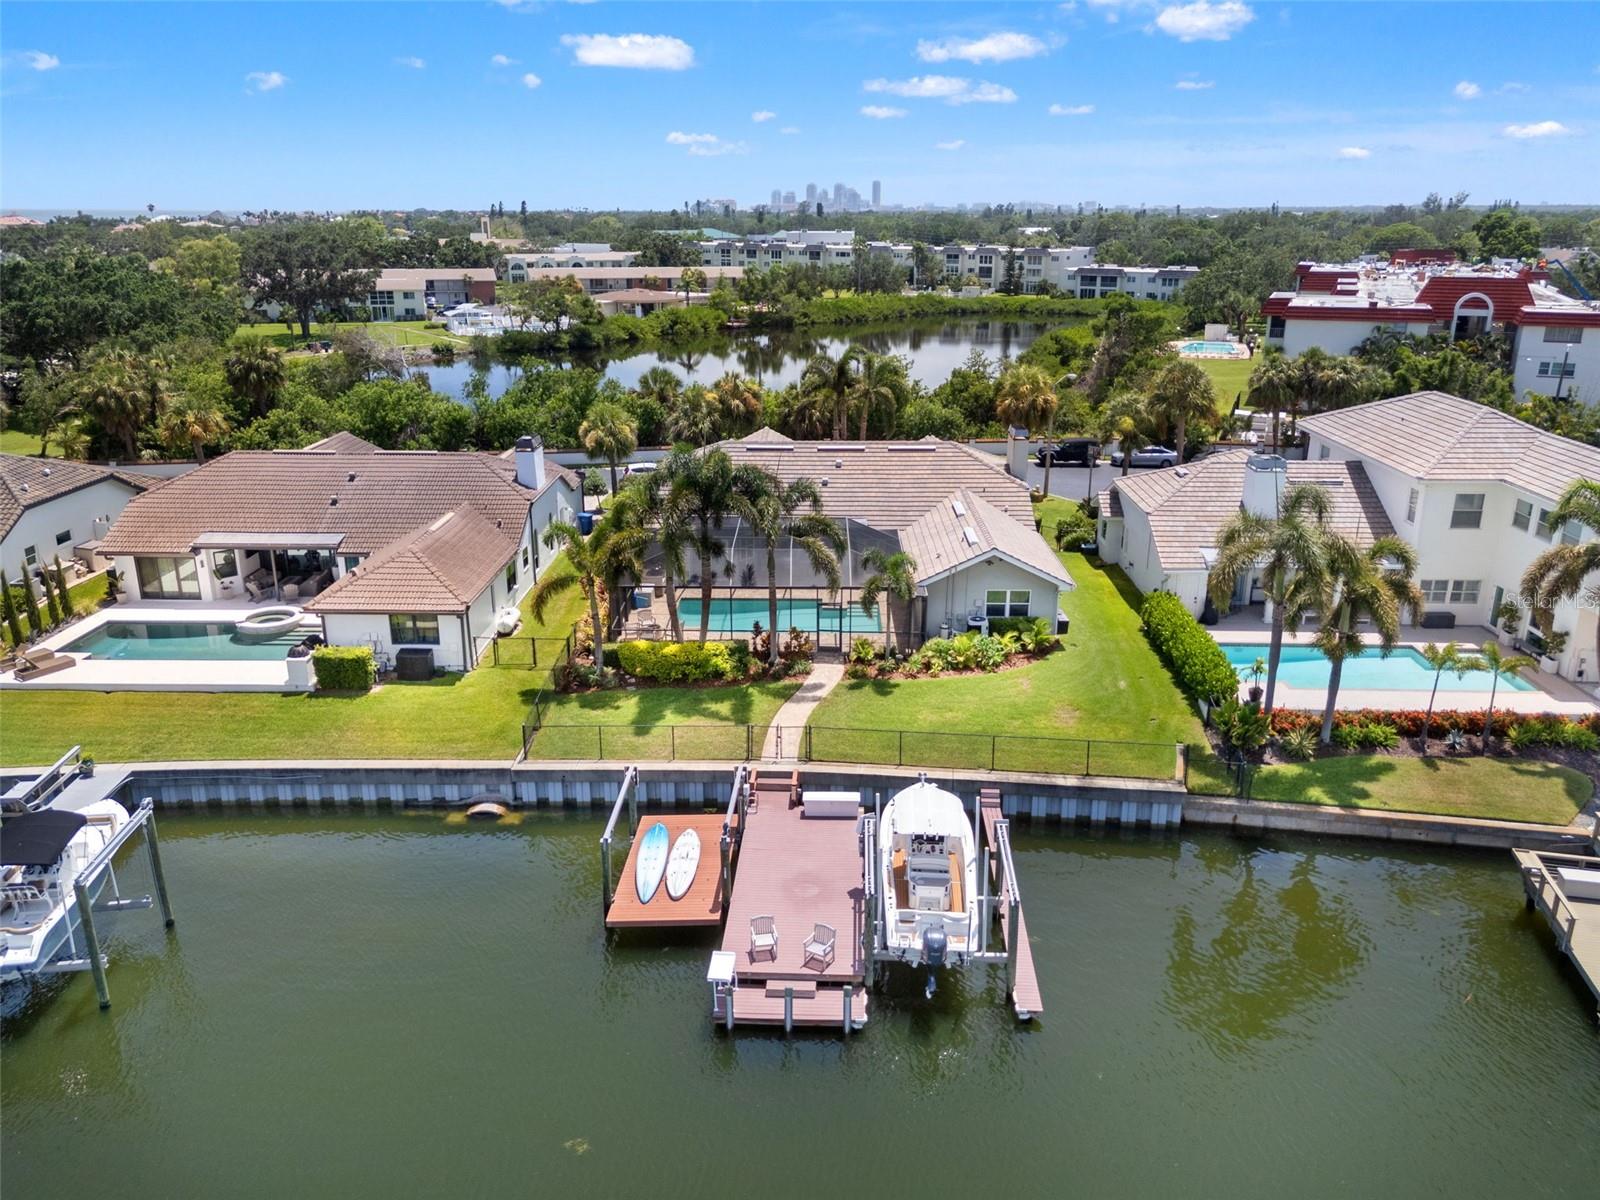
Rare opportunity! Waterfront pool home on a PRIVATE STREET with CUL-DE-SAC in the highly sought after 8-home enclave of Venetian Place! Built in 1989 on higher elevation, every home on Alisa Circle passed last year's record-breaking tests with ZERO SURGE ISSUES. Just minutes from downtown, this stunning 4-bedroom, 3-bath, BLOCK HOME is located in the very desirable NE St Pete area. A quiet cul-de-sac community, where privacy meets coastal elegance. Enjoy HIGH CEILINGS, tile roof (2014), UPDATED SEAWALL, plenty of parking on your CIRCULAR DRIVEWAY, plus, IMPACT WINDOWS AND SLIDERS. Home is already setup for the most discerning outdoor enthusiast, including large dock with catwalk and fish cleaning station, boat lift, SECONDARY LIFT FOR PERSONAL WATERCRAFT, and wide-open Tampa Bay just around the corner. Very well-maintained property with a CLEAN 4 POINT INSPECTION in July of 2025! This stunning home offers not only peace of mind, but also the lifestyle everyone dreams of in Florida. Step outside to your sparkling saltwater pool, fully enclosed pool cage, and surrounded by tropical landscaping. The expansive covered patio is an entertainer’s dream, complete with a built-in grill, Green Egg smoker, and plenty of room to lounge or dine alfresco. French doors and large windows frame stunning water views from nearly every room in the house. The large, fenced backyard offers a safe, shaded space for pets or play, and leads directly to your private dock. Incredibly easy to launch your kayak, paddleboard, and other personal watercraft with your secondary lift! The dock and seawall offer fishing for snook, snapper, sea trout and sheepshead, all right from your own backyard. A smart layout provides an open, airy feel throughout the home. Formal living and dining areas offer flexibility for entertaining or working from home. The heart of the home—the kitchen—is equipped with wood cabinetry, granite countertops, a gas range, and a casual dining space overlooking the water. A breakfast bar opens into the cozy family room featuring a fireplace for that special ambiance. The spacious primary suite offers a peaceful retreat with a walk-in closet, updated en-suite bath with a soaking tub, double vanities, and a separate shower. Three additional bedrooms and two full baths provide plenty of space and privacy for guests or family. Drive your golf cart to thriving Downtown St Pete, starting your route on beautiful Bayshore Blvd, just two blocks away. Homes around Bayshore have been purchased for up to $7M in the last 2 years, making Venetian Place one of the area’s best-kept secrets at this price point, especially considering the larger lot. Once you're in Downtown St Pete, enjoy award-winning restaurants, parks, boutique shopping, and the waterfront marina scene. You're also just a short walk from LCC Day School and less than 25 minutes to the beaches and Tampa International Airport! Contact us to book your showing today!
Build Your Team
Quickly find investor-friendly professionals who can help you succeed in real estate investing at any stage of the investing journey.


Agents
Match with investor-friendly agents who can help you find, analyze, and close your next deal


Lenders
Get the best funding…find investor-friendly lenders who specialize in your deal strategy


Property Managers
Transition to passive investing. Find a trusted property management partnership that lasts.


Tax Pros & Accountants
Taxes and financial reporting made easy—find experts to create tax savings strategies, file taxes, and more
Location
Property Details
Parking
- Description: Garage
- Details: Circular Driveway, Driveway, Electric Vehicle Charging Station(s), Garage Door Opener, Attached
- Garage Spaces: 2
- Spaces Total: 0
Bedroom Information
- # of Bedrooms: 4
Bathroom Information
- # of Baths (Full): 3
- # of Baths (Total): 3.0
Interior Features
- # of Rooms: 3
- # of Stories: 1
- Fireplace: Yes
Exterior Features
- Exterior Walls Materials: Stucco
- Foundation: Slab
- Roof Type: Gable
- Roof Material: Tile
- Pool: Yes
HOA
- Has HOA: Yes
- Association: Raegan Miller
- HOA Fee: $200/monthly
Land Information
- Land Use: Residential
- Land Use Subtype: Single Family Residential
Lot Information
- Parcel ID: 043117938920010060
- Lot Size: 11905 sqft
Property Information
- Property Type: Single Family Residence
- Style: Florida
- Year Built: 1989
Tax Information
- Annual Tax: $18,951
Utilities
- Water & Sewer: Public
- Heating: Electric
- Cooling: Central Air
Location
- County: Pinellas
Listing Details
Investment Summary
- Monthly Cash Flow
- -$4,243
- Cap Rate
- 2.6%
- Cash-on-Cash Return
- -15.5%
- Debt Coverage Ratio
- 0.42
- Internal Rate of Return (5 years)
- -11.0%
Cash Flow
Net Operating Income (NOI) minus mortgage payments.
Calculation:
NOI - Mortgage Payments
Cap Rate (Market Value)
Capitalization Rate is a rate of return that compares the yearly Net Operating Income (NOI) to the market value.
Calculation:
NOI / Market Value
Cash-on-Cash Return (CoC)
Annual Cash Flow / Cash Invested
Calculation:
Annual cash flow divided by initial cash invested.
Debt Coverage Ratio (DCR)
Net Operating Income (NOI) divided by total debt payments.
Calculation:
NOI / Total Debt Payments
Internal Rate of Return (IRR)
A metric for assessing profitability over time. IRR is the discount rate at which the net present value (NPV) of all future cash flows (positive and negative) from an investment equals zero — including both periodic cash flow (such as rent) and a projected sale at the end of the holding period. It represents the expected annualized return, accounting for income, expenses, and the recovery of capital through a future sale.
Purchase Details
Purchase PriceThe price paid for the property. Purchase price:
| $1,424,000 |
|---|---|
Amount FinancedThe amount of the purchase financed through a loan. Amount financed:
| -$1,139,200 |
Down paymentThe initial payment made towards the purchase. Down payment:
| $284,800 |
Closing CostsFees and expenses associated with purchasing a property, typically ranging from 2% to 5% of the home’s purchase price, paid at the end of a home purchase to cover services like lending, title transfer, and taxes. Closing costs:
| $42,720 |
Rehab CostsCosts incurred to repair or improve the property, including: roof, flooring, exterior siding, kitchen, exterior paint, bathrooms, etc. Rehab costs:
| $0 |
Initial Cash InvestedThe total initial cash invested in the property. Calculation:Down payment + Buying costs + Rehab costs Initial cash invested:
| $327,520 |
Square Feet (SQFT)The total square footage of the property. Square feet:
| 2,600 |
Cost Per Square FootCost per square foot of the property. Calculation:Purchase Price / Square Feet Cost per square foot:
| $548 |
Monthly Rent Per Square FootMonthly rent divided by the number of square feet. This ratio helps investors compare rental income efficiency across properties, markets, and unit sizes Calculation:Monthly Rent / Square Feet Monthly rent per square foot:
| $2.69 |
Financing Details
Loan AmountThe total sum of money borrowed from a lender to finance a property purchase. Calculation:Purchase Price - Down Payment
Loan amount:
| $1,139,200 |
|---|---|
Loan to Value Ratio (LTV)Loan amount divided by the market value of the property. Calculation:Loan Amount / Market Value
Loan to value ratio:
| 80.0% |
Loan TypeThe type of loan (e.g., fixed, adjustable).
Loan type:
| Amortizing |
TermThe loan repayment period in years.
Term:
| 30 years |
Interest RateThe percentage a lender charges on the borrowed amount of a loan, determining the cost of borrowing money.
Interest rate:
| 6.625% |
Principal & Interest (PI)The principal is the portion of the loan payment that reduces the loan balance. The interest is the lender's charge for borrowing money. Calculation:(P * r * (1 + r) ** n) / ((1 + r) ** n - 1) Where:
P = Loan amount (principal)
Principal & interest:
| $7,294 |
Property TaxesAnnual taxes levied by local governments on real estate properties. These taxes fund public services like schools, roads, and emergency services.
Property tax:
| $1,579 |
InsuranceThe costs for insurance coverage to protect against financial losses due to risks like fire, natural disasters, theft, liability, or tenant-related damages. Calculation:Assumes 7% of gross rental income, unless insurance rates are specified.
Insurance:
| $490 |
Private Mortgage Insurance (PMI)A fee that borrowers pay when they take out a conventional loan with a loan-to-value (LTV) ratio above 80%.
Private mortgage insurance (PMI):
| $0 |
Monthly PaymentThe fixed amount a borrower pays each month to repay a loan. It typically includes principal and interest (P&I) and may also cover property taxes, insurance, HOA fees, and PMI if escrowed. Monthly payment:
| $9,363 |
Operating Income
| % Rent | Monthly | Yearly | |
|---|---|---|---|
Gross RentThe total rental income received from tenants before deducting any expenses. Includes base rent, late fees, pet fees, parking fees, and other recurring charges.
Gross rent:
| $7,000 | $84,000 | |
Vacancy LossExpected loss of rent due to vacancies.
Vacancy loss:
(6%)
| 6% | -$420 | -$5,040 |
Operating IncomeGross rental income minus vacancy loss. Calculation:Gross rent - Vacancy loss
Operating income:
| $6,580 | $78,960 |
Operating Expenses
| % Rent | Monthly | Yearly | |
|---|---|---|---|
Property TaxesAnnual taxes levied by local governments on real estate properties. These taxes fund public services like schools, roads, and emergency services. | 23% | -$1,579 | -$18,951 |
InsuranceThe costs for insurance coverage to protect against financial losses due to risks like fire, natural disasters, theft, liability, or tenant-related damages. Calculation:Assumes 7% of gross rental income, unless insurance rates are specified. | 7% | -$490 | -$5,880 |
Property ManagementThe costs associated with hiring a property manager to handle the day-to-day operations of a rental property. Includes management fees, leasing fes, eviction fees, etc. Calculation:Assumes 8% of gross rental income. | 8% | -$560 | -$6,720 |
Repairs & MaintenanceOngoing costs for routine upkeep and minor fixes needed to keep a property in good working condition. Calculation:Assumes 5% of gross rental income. Varies by property age and condition. | 5% | -$350 | -$4,200 |
Capital ExpensesLarge, infrequent costs for major improvements or replacements, like a new roof, HVAC system, or appliances. Calculation:Assumes 5% of gross rental income. Varies by property age. | 5% | -$350 | -$4,200 |
HOA FeesRegular dues paid to a Homeowners Association for community maintenance, amenities, and management. Similar fees include: Condo Association Fees, Co-op Maintenance Fees, etc. | 3% | -$200 | -$2,400 |
Operating ExpensesRecurring costs required to maintain and manage a rental property, including property taxes, insurance, maintenance, repairs, utilities (if paid by the owner), property management fees, and other day-to-day expenses. Calculation:Insurance + Property Taxes + Property Management + Repairs & Maintenance + Capital Expenditures + HOA Fees | 50% | -$3,529 | -$42,351 |
Cash Flow
| Monthly | Yearly | |
|---|---|---|
Net Operating Income (NOI)The income generated from a property after deducting all operating expenses but before deducting mortgage payments, taxes, and capital expenditures. Calculation:Gross Operating Income - Operating Expenses
Net operating income:
| $3,051 | $36,612 |
Mortgage PaymentThe fixed amount a borrower pays each month to repay a loan. It typically includes principal and interest (P&I) and may also cover property taxes, insurance, HOA fees, and PMI if escrowed. | -$7,294 | -$87,528 |
Cash FlowNet Operating Income (NOI) minus mortgage payments. Calculation:NOI - Mortgage Payments | $4,243 | $50,916 |