
$1,774,900
Investment Summary
- Monthly Cash Flow
- -$5,628
- Cap Rate
- 1.9%
- Cash-on-Cash Return
- -16.5%
- Debt Coverage Ratio
- 0.33
- Internal Rate of Return (5 years)
- -12.0%
Cash Flow
Net Operating Income (NOI) minus mortgage payments.
Calculation:
NOI - Mortgage Payments
Cap Rate (Market Value)
Capitalization Rate is a rate of return that compares the yearly Net Operating Income (NOI) to the market value.
Calculation:
NOI / Market Value
Cash-on-Cash Return (CoC)
Annual Cash Flow / Cash Invested
Calculation:
Annual cash flow divided by initial cash invested.
Debt Coverage Ratio (DCR)
Net Operating Income (NOI) divided by total debt payments.
Calculation:
NOI / Total Debt Payments
Internal Rate of Return (IRR)
A metric for assessing profitability over time. IRR is the discount rate at which the net present value (NPV) of all future cash flows (positive and negative) from an investment equals zero — including both periodic cash flow (such as rent) and a projected sale at the end of the holding period. It represents the expected annualized return, accounting for income, expenses, and the recovery of capital through a future sale.
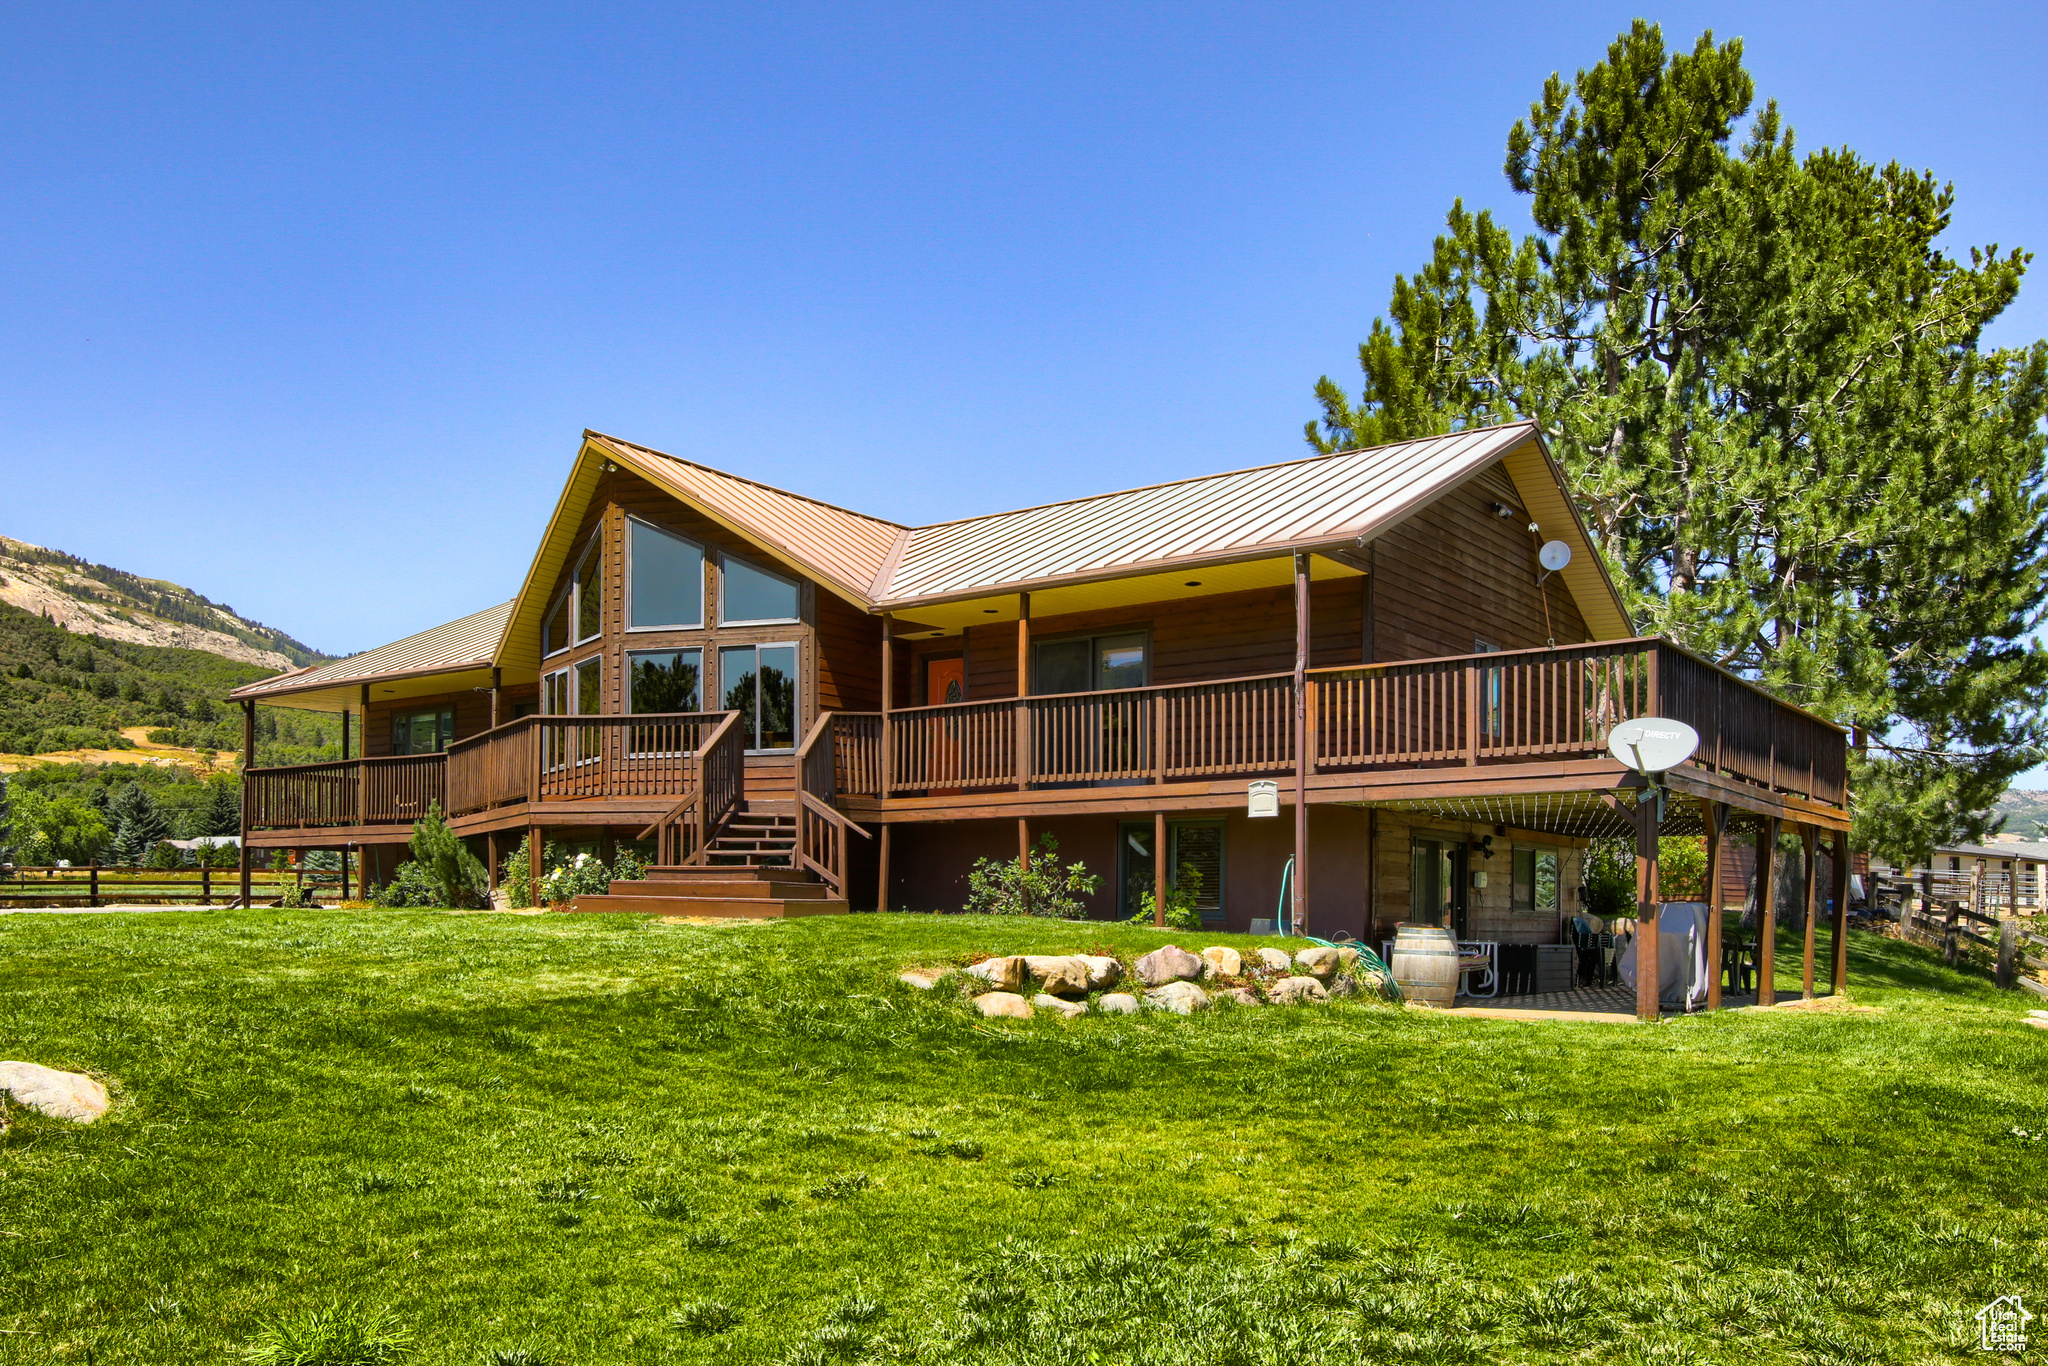
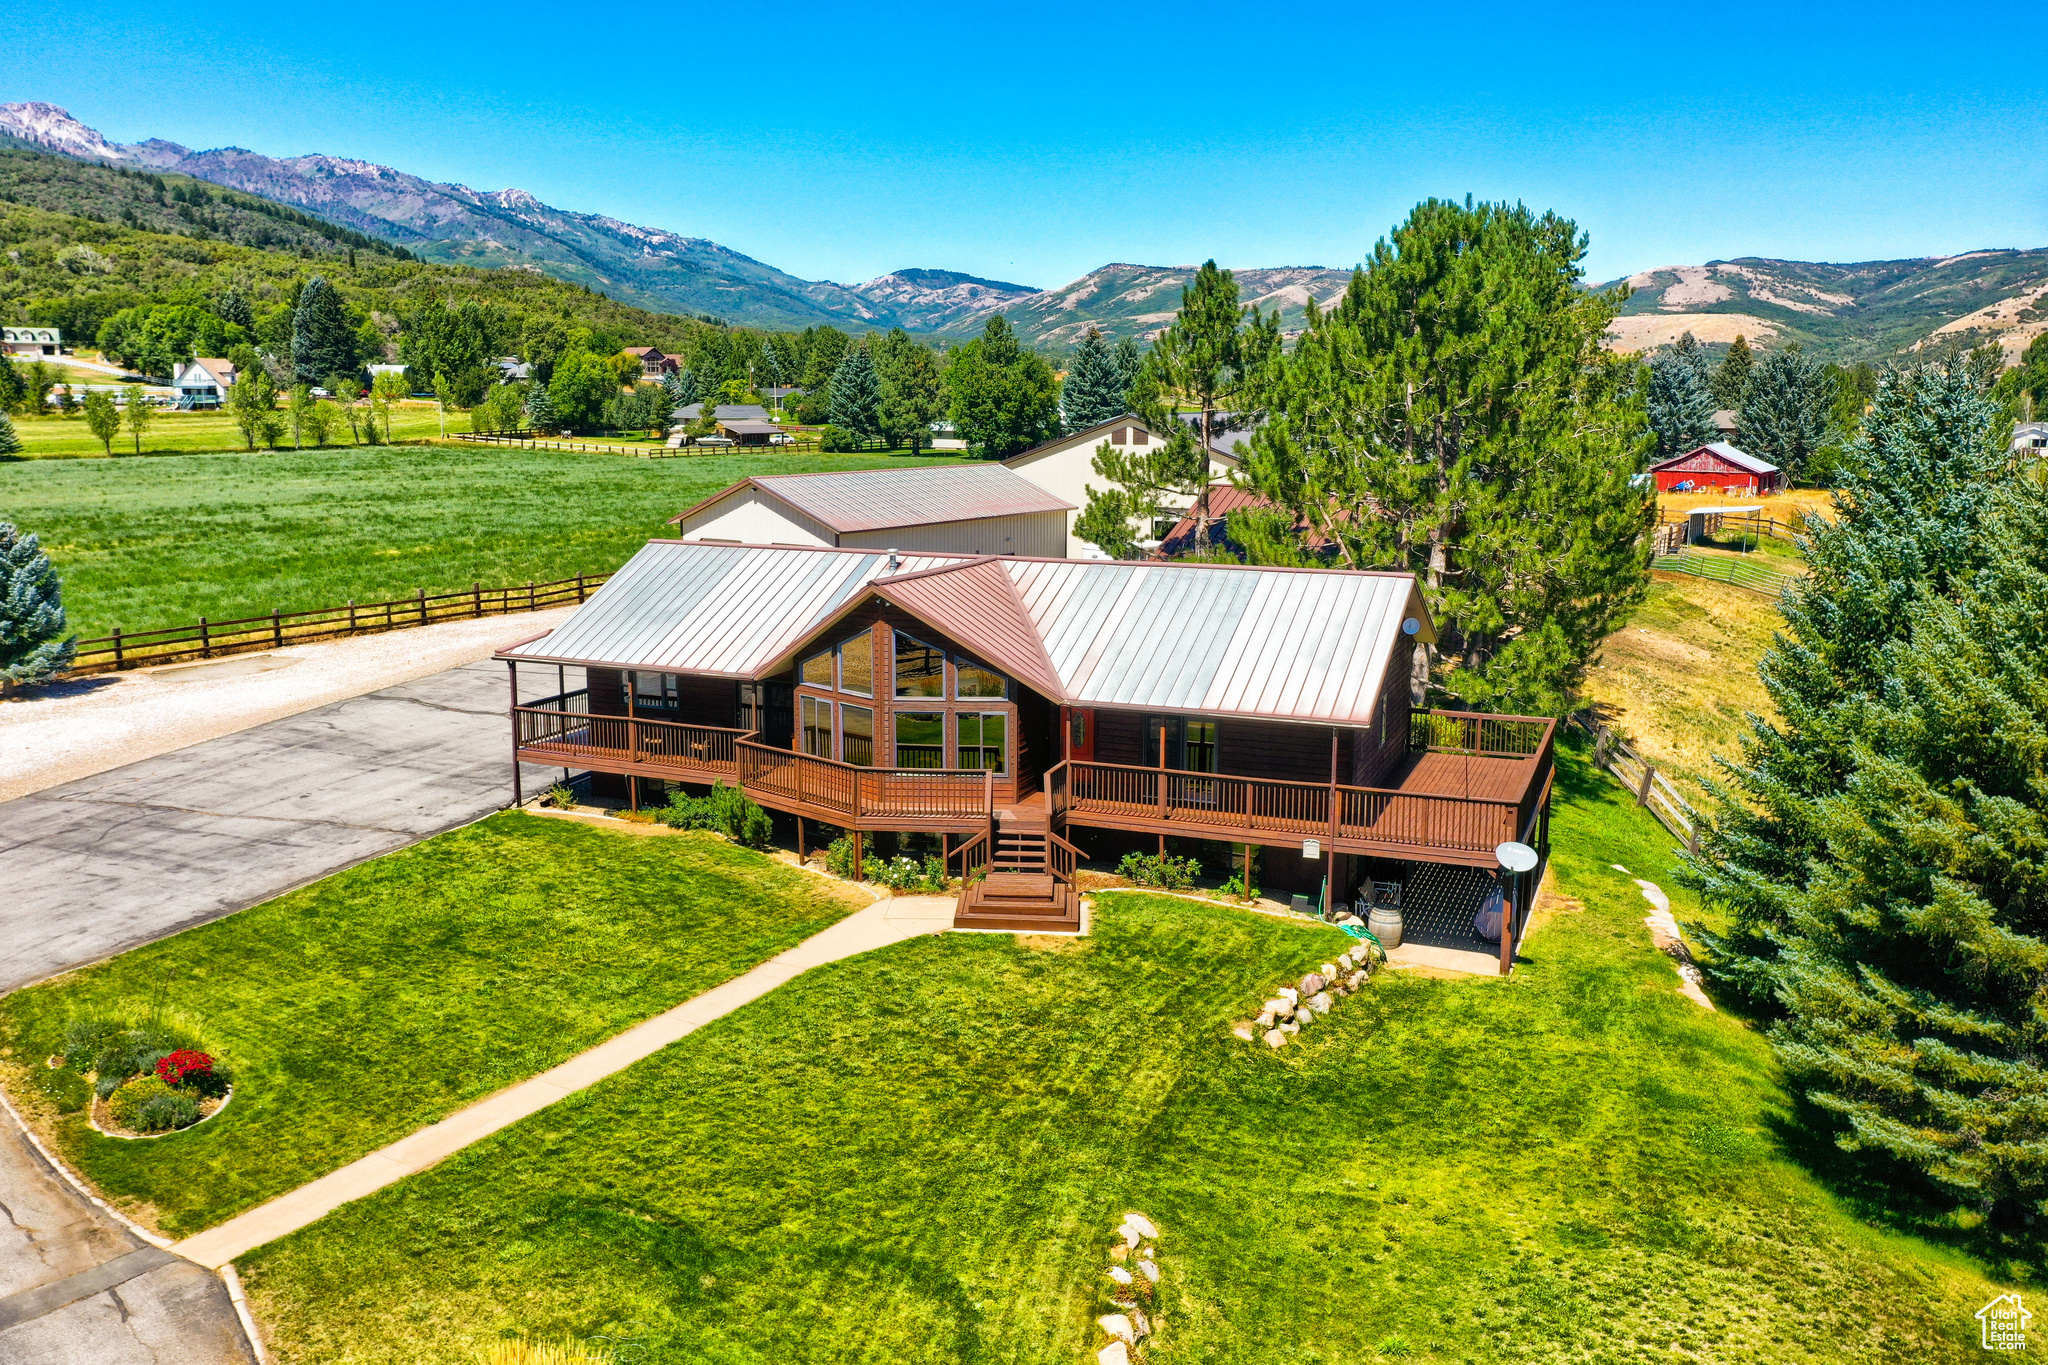
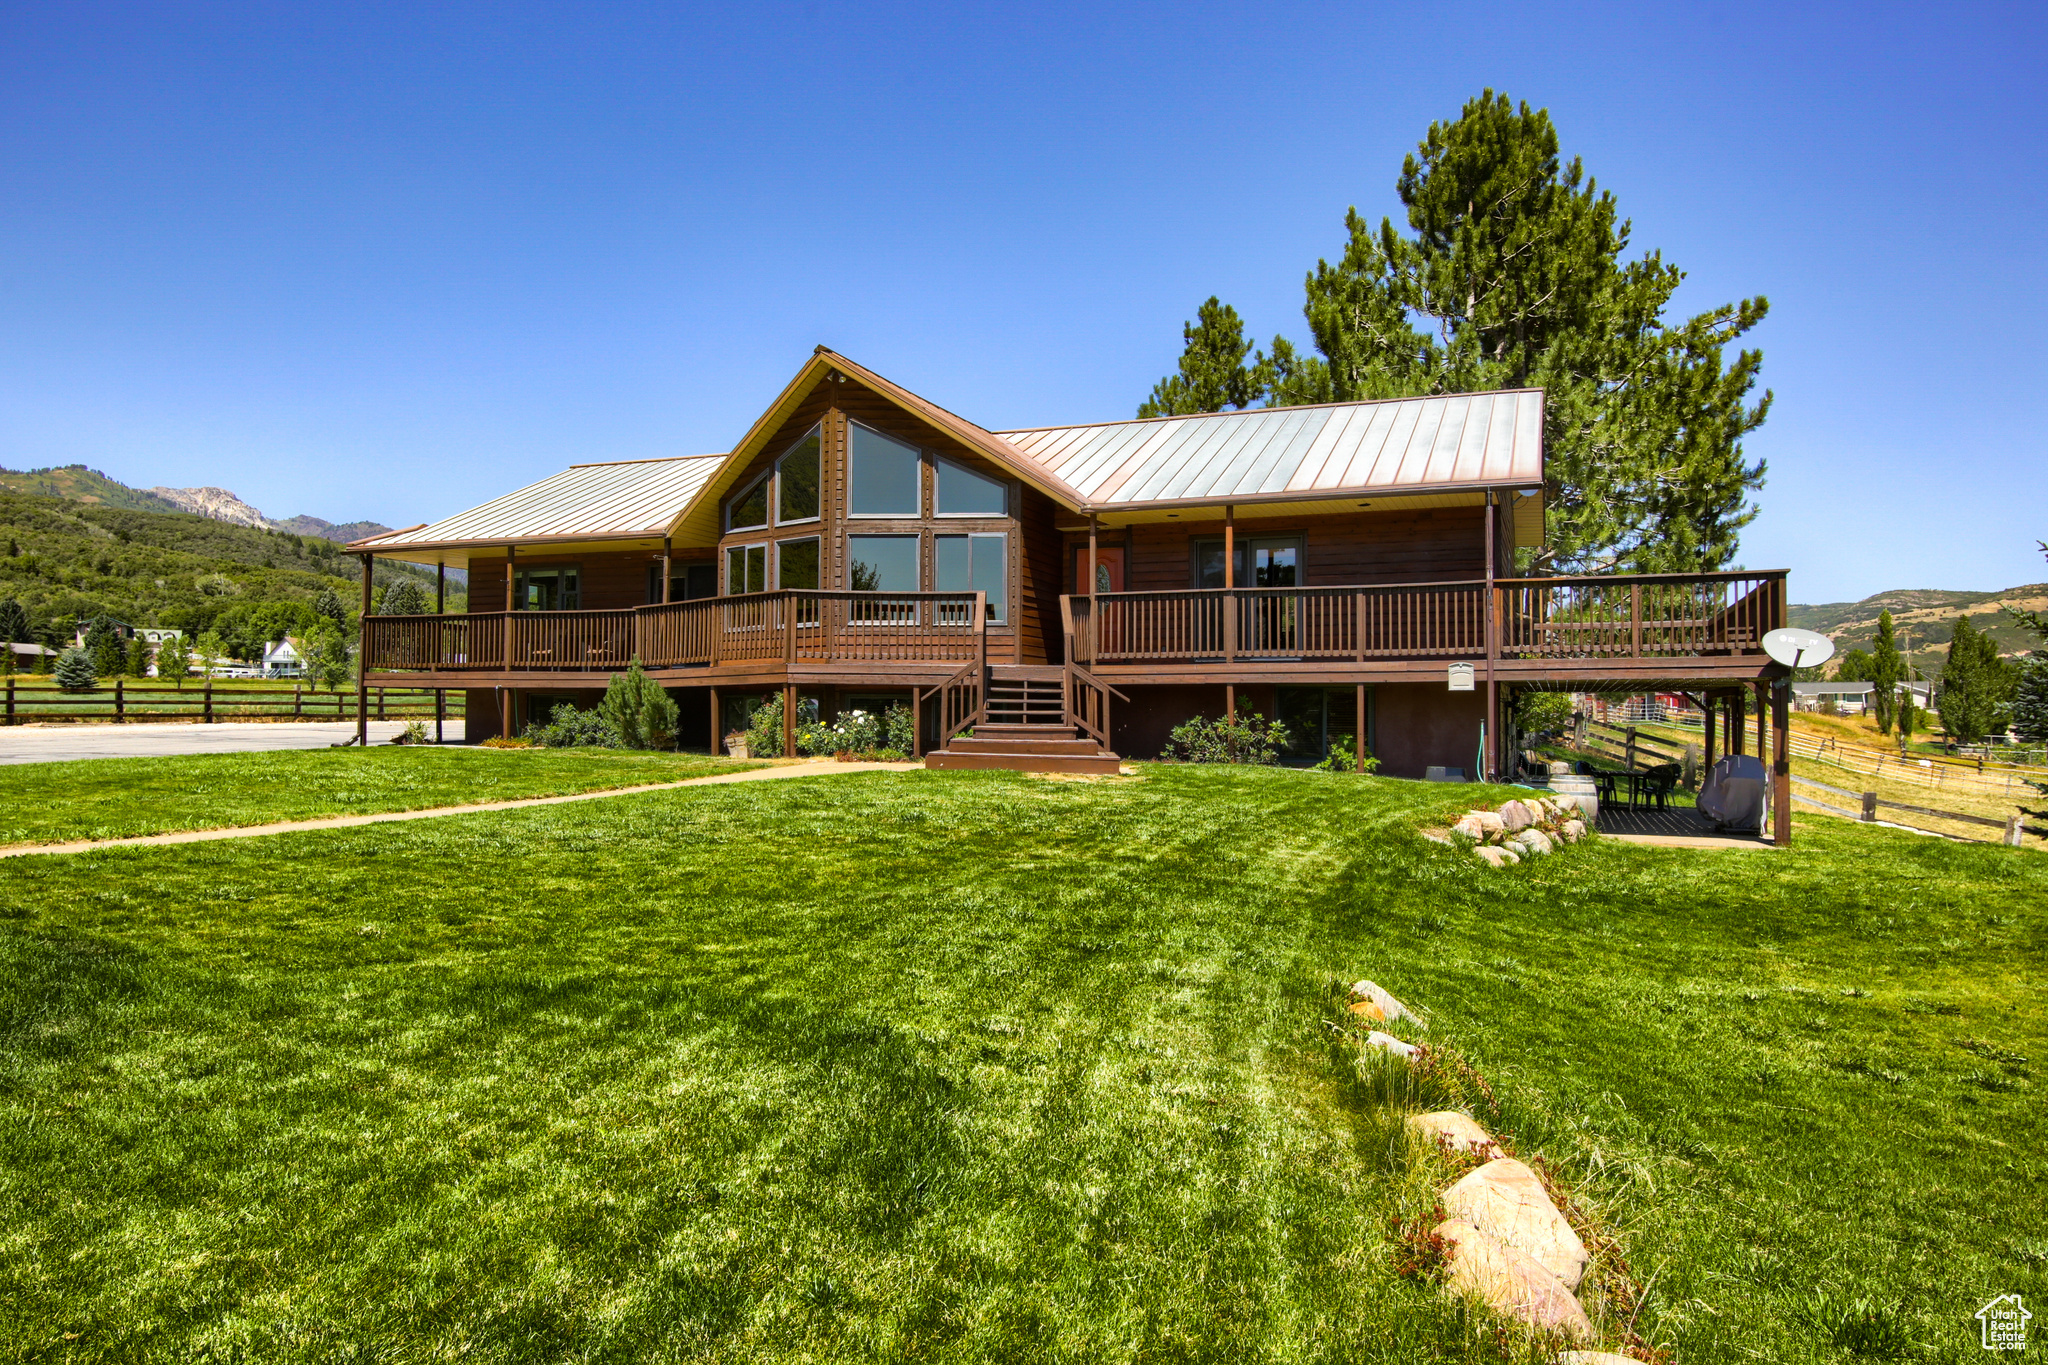
Property Description
PRICE IMPROVEMENT!!! Highly Sought After Upper Ogden Valley Horse Property Now Available for Purchase!!! This turnkey equestrian property is located in the tranquil town of Liberty Utah surrounded by the majestic Wasatch Mountains. Wake up to stunning views of Ben Lomond Peak right out your front door and enjoy watching your animals enjoy the space of the beautiful pastures off the back deck while enjoying a nice cup of coffee. The home has a functional open floor plan, single-level living and a full walk out basement with a separate entrance that could easily be converted into a mother-in law apartment. Plenty of room for your guests and entertaining ! The estate is minutes away from several riding trailheads, three world-class ski resorts, Pineview Reservoir and other numerous outdoor destinations. Imagine enjoying all of these attractions while still having your privacy and being only minutes away from all of your every day shopping needs. This beautiful home sits on over 6 acres of flat usable property and includes; a newly built 120x84 barn with a 120x60 indoor arena with ample LED lighting, 4 current stalls with turnouts and the ability to have 7 stalls, tack up area, plenty of hay storage space and a small sand arena in the back. Imagine being just a few steps from your front door riding to your own private indoor riding arena and riding your horses all year round! There is also a 60x30 large garage/shop with a large mezzanine for storage, tack rooms and 2 additional stalls for animals, 36'x36 heated & insulated garage/shop with oversized doors to fit larger vehicles with an attached lean-to for additional parking for tractors or trailers, 2 RV parking areas with larger amped electrical outlets. The entire property is fully fenced with plenty of pasture for growing top quality grass hay, open grazing for your animals or additional riding area as well. The property has ample amounts of pressurized irrigation water with hand-lines and a convenient movable sprinkler wheel. The pasture currently produces 3 tons of grass hay just on the first crop alone. This amazing property has a ton of privacy and all of these great features and is still less than 10 minutes to North Fork for some great hiking, mountain biking, horseback riding and cross country skiing, minutes to Avon pass for OHV and hunting, minutes to Nordic Valley with downhill skiing and sledding, just minutes from Eden downtown where you'll find grocery stores, gas stations, banks and restaurants ; 20 minutes to Powder Mountain & 30 minutes to Snowbasin. Both are world class skiing resorts. 20 minutes to Pineview Reservoir for boating/fishing and only 30 minutes to Ogden for any of your other major shopping needs. This immaculate property has so many possibilities and would be great for your hobby farm, horse business or would make a beautiful private event center. This one is definitely a must see!
Build Your Team
Quickly find investor-friendly professionals who can help you succeed in real estate investing at any stage of the investing journey.


Agents
Match with investor-friendly agents who can help you find, analyze, and close your next deal


Lenders
Get the best funding…find investor-friendly lenders who specialize in your deal strategy


Property Managers
Transition to passive investing. Find a trusted property management partnership that lasts.


Tax Pros & Accountants
Taxes and financial reporting made easy—find experts to create tax savings strategies, file taxes, and more
Location
Property Details
Parking
- Description: Covered, Garage
- Details: Covered, RV Access/Parking
- Garage Spaces: 5
- Spaces Total: 5
Bedroom Information
- # of Bedrooms: 3
Bathroom Information
- # of Baths (Full): 3
- # of Baths (Total): 3.0
Interior Features
- # of Rooms: 17
- # of Stories: 2
- Basement: Yes
- Basement Description: Daylight, Full, Walk-Out Access
- Fireplace: Yes
Exterior Features
- Exterior Walls Materials: Siding (Alum/Vinyl)
- Roof Material: Metal
Land Information
- Land Use: Residential
- Land Use Subtype: Single Family Residential
Lot Information
- Parcel ID: 220070019
- Lot Size: 280962 sqft
Property Information
- Property Type: Single Family Residence
- Style: Cabin
- Year Built: 1994
Tax Information
- Annual Tax: $8,150
Utilities
- Heating: Central, Natural Gas, Forced Air, Hot Water
- Cooling: Ceiling Fan(s), Central Air
Location
- County: Weber
Listing Details
Investment Summary
- Monthly Cash Flow
- -$5,628
- Cap Rate
- 1.9%
- Cash-on-Cash Return
- -16.5%
- Debt Coverage Ratio
- 0.33
- Internal Rate of Return (5 years)
- -12.0%
Cash Flow
Net Operating Income (NOI) minus mortgage payments.
Calculation:
NOI - Mortgage Payments
Cap Rate (Market Value)
Capitalization Rate is a rate of return that compares the yearly Net Operating Income (NOI) to the market value.
Calculation:
NOI / Market Value
Cash-on-Cash Return (CoC)
Annual Cash Flow / Cash Invested
Calculation:
Annual cash flow divided by initial cash invested.
Debt Coverage Ratio (DCR)
Net Operating Income (NOI) divided by total debt payments.
Calculation:
NOI / Total Debt Payments
Internal Rate of Return (IRR)
A metric for assessing profitability over time. IRR is the discount rate at which the net present value (NPV) of all future cash flows (positive and negative) from an investment equals zero — including both periodic cash flow (such as rent) and a projected sale at the end of the holding period. It represents the expected annualized return, accounting for income, expenses, and the recovery of capital through a future sale.
Purchase Details
Purchase PriceThe price paid for the property. Purchase price:
| $1,774,900 |
|---|---|
Amount FinancedThe amount of the purchase financed through a loan. Amount financed:
| -$1,419,920 |
Down paymentThe initial payment made towards the purchase. Down payment:
| $354,980 |
Closing CostsFees and expenses associated with purchasing a property, typically ranging from 2% to 5% of the home’s purchase price, paid at the end of a home purchase to cover services like lending, title transfer, and taxes. Closing costs:
| $53,247 |
Rehab CostsCosts incurred to repair or improve the property, including: roof, flooring, exterior siding, kitchen, exterior paint, bathrooms, etc. Rehab costs:
| $0 |
Initial Cash InvestedThe total initial cash invested in the property. Calculation:Down payment + Buying costs + Rehab costs Initial cash invested:
| $408,227 |
Square Feet (SQFT)The total square footage of the property. Square feet:
| 3,776 |
Cost Per Square FootCost per square foot of the property. Calculation:Purchase Price / Square Feet Cost per square foot:
| $470 |
Monthly Rent Per Square FootMonthly rent divided by the number of square feet. This ratio helps investors compare rental income efficiency across properties, markets, and unit sizes Calculation:Monthly Rent / Square Feet Monthly rent per square foot:
| $1.32 |
Financing Details
Loan AmountThe total sum of money borrowed from a lender to finance a property purchase. Calculation:Purchase Price - Down Payment
Loan amount:
| $1,419,920 |
|---|---|
Loan to Value Ratio (LTV)Loan amount divided by the market value of the property. Calculation:Loan Amount / Market Value
Loan to value ratio:
| 80.0% |
Loan TypeThe type of loan (e.g., fixed, adjustable).
Loan type:
| Amortizing |
TermThe loan repayment period in years.
Term:
| 30 years |
Interest RateThe percentage a lender charges on the borrowed amount of a loan, determining the cost of borrowing money.
Interest rate:
| 5.875% |
Principal & Interest (PI)The principal is the portion of the loan payment that reduces the loan balance. The interest is the lender's charge for borrowing money. Calculation:(P * r * (1 + r) ** n) / ((1 + r) ** n - 1) Where:
P = Loan amount (principal)
Principal & interest:
| $8,399 |
Property TaxesAnnual taxes levied by local governments on real estate properties. These taxes fund public services like schools, roads, and emergency services.
Property tax:
| $679 |
InsuranceThe costs for insurance coverage to protect against financial losses due to risks like fire, natural disasters, theft, liability, or tenant-related damages. Calculation:Assumes 7% of gross rental income, unless insurance rates are specified.
Insurance:
| $350 |
Private Mortgage Insurance (PMI)A fee that borrowers pay when they take out a conventional loan with a loan-to-value (LTV) ratio above 80%.
Private mortgage insurance (PMI):
| $0 |
Monthly PaymentThe fixed amount a borrower pays each month to repay a loan. It typically includes principal and interest (P&I) and may also cover property taxes, insurance, HOA fees, and PMI if escrowed. Monthly payment:
| $9,428 |
Operating Income
| % Rent | Monthly | Yearly | |
|---|---|---|---|
Gross RentThe total rental income received from tenants before deducting any expenses. Includes base rent, late fees, pet fees, parking fees, and other recurring charges.
Gross rent:
| $5,000 | $60,000 | |
Vacancy LossExpected loss of rent due to vacancies.
Vacancy loss:
(6%)
| 6% | -$300 | -$3,600 |
Operating IncomeGross rental income minus vacancy loss. Calculation:Gross rent - Vacancy loss
Operating income:
| $4,700 | $56,400 |
Operating Expenses
| % Rent | Monthly | Yearly | |
|---|---|---|---|
Property TaxesAnnual taxes levied by local governments on real estate properties. These taxes fund public services like schools, roads, and emergency services. | 14% | -$679 | -$8,150 |
InsuranceThe costs for insurance coverage to protect against financial losses due to risks like fire, natural disasters, theft, liability, or tenant-related damages. Calculation:Assumes 7% of gross rental income, unless insurance rates are specified. | 7% | -$350 | -$4,200 |
Property ManagementThe costs associated with hiring a property manager to handle the day-to-day operations of a rental property. Includes management fees, leasing fes, eviction fees, etc. Calculation:Assumes 8% of gross rental income. | 8% | -$400 | -$4,800 |
Repairs & MaintenanceOngoing costs for routine upkeep and minor fixes needed to keep a property in good working condition. Calculation:Assumes 5% of gross rental income. Varies by property age and condition. | 5% | -$250 | -$3,000 |
Capital ExpensesLarge, infrequent costs for major improvements or replacements, like a new roof, HVAC system, or appliances. Calculation:Assumes 5% of gross rental income. Varies by property age. | 5% | -$250 | -$3,000 |
HOA FeesRegular dues paid to a Homeowners Association for community maintenance, amenities, and management. Similar fees include: Condo Association Fees, Co-op Maintenance Fees, etc. | n/a | n/a | n/a |
Operating ExpensesRecurring costs required to maintain and manage a rental property, including property taxes, insurance, maintenance, repairs, utilities (if paid by the owner), property management fees, and other day-to-day expenses. Calculation:Insurance + Property Taxes + Property Management + Repairs & Maintenance + Capital Expenditures + HOA Fees | 39% | -$1,929 | -$23,150 |
Cash Flow
| Monthly | Yearly | |
|---|---|---|
Net Operating Income (NOI)The income generated from a property after deducting all operating expenses but before deducting mortgage payments, taxes, and capital expenditures. Calculation:Gross Operating Income - Operating Expenses
Net operating income:
| $2,771 | $33,252 |
Mortgage PaymentThe fixed amount a borrower pays each month to repay a loan. It typically includes principal and interest (P&I) and may also cover property taxes, insurance, HOA fees, and PMI if escrowed. | -$8,399 | -$100,788 |
Cash FlowNet Operating Income (NOI) minus mortgage payments. Calculation:NOI - Mortgage Payments | $5,628 | $67,536 |