$340,000
Investment Summary
- Monthly Cash Flow
- -$733
- Cap Rate
- 3.6%
- Cash-on-Cash Return
- -11.2%
- Debt Coverage Ratio
- 0.58
- Internal Rate of Return (5 years)
- -6.9%
Cash Flow
Net Operating Income (NOI) minus mortgage payments.
Calculation:
NOI - Mortgage Payments
Cap Rate (Market Value)
Capitalization Rate is a rate of return that compares the yearly Net Operating Income (NOI) to the market value.
Calculation:
NOI / Market Value
Cash-on-Cash Return (CoC)
Annual Cash Flow / Cash Invested
Calculation:
Annual cash flow divided by initial cash invested.
Debt Coverage Ratio (DCR)
Net Operating Income (NOI) divided by total debt payments.
Calculation:
NOI / Total Debt Payments
Internal Rate of Return (IRR)
A metric for assessing profitability over time. IRR is the discount rate at which the net present value (NPV) of all future cash flows (positive and negative) from an investment equals zero — including both periodic cash flow (such as rent) and a projected sale at the end of the holding period. It represents the expected annualized return, accounting for income, expenses, and the recovery of capital through a future sale.
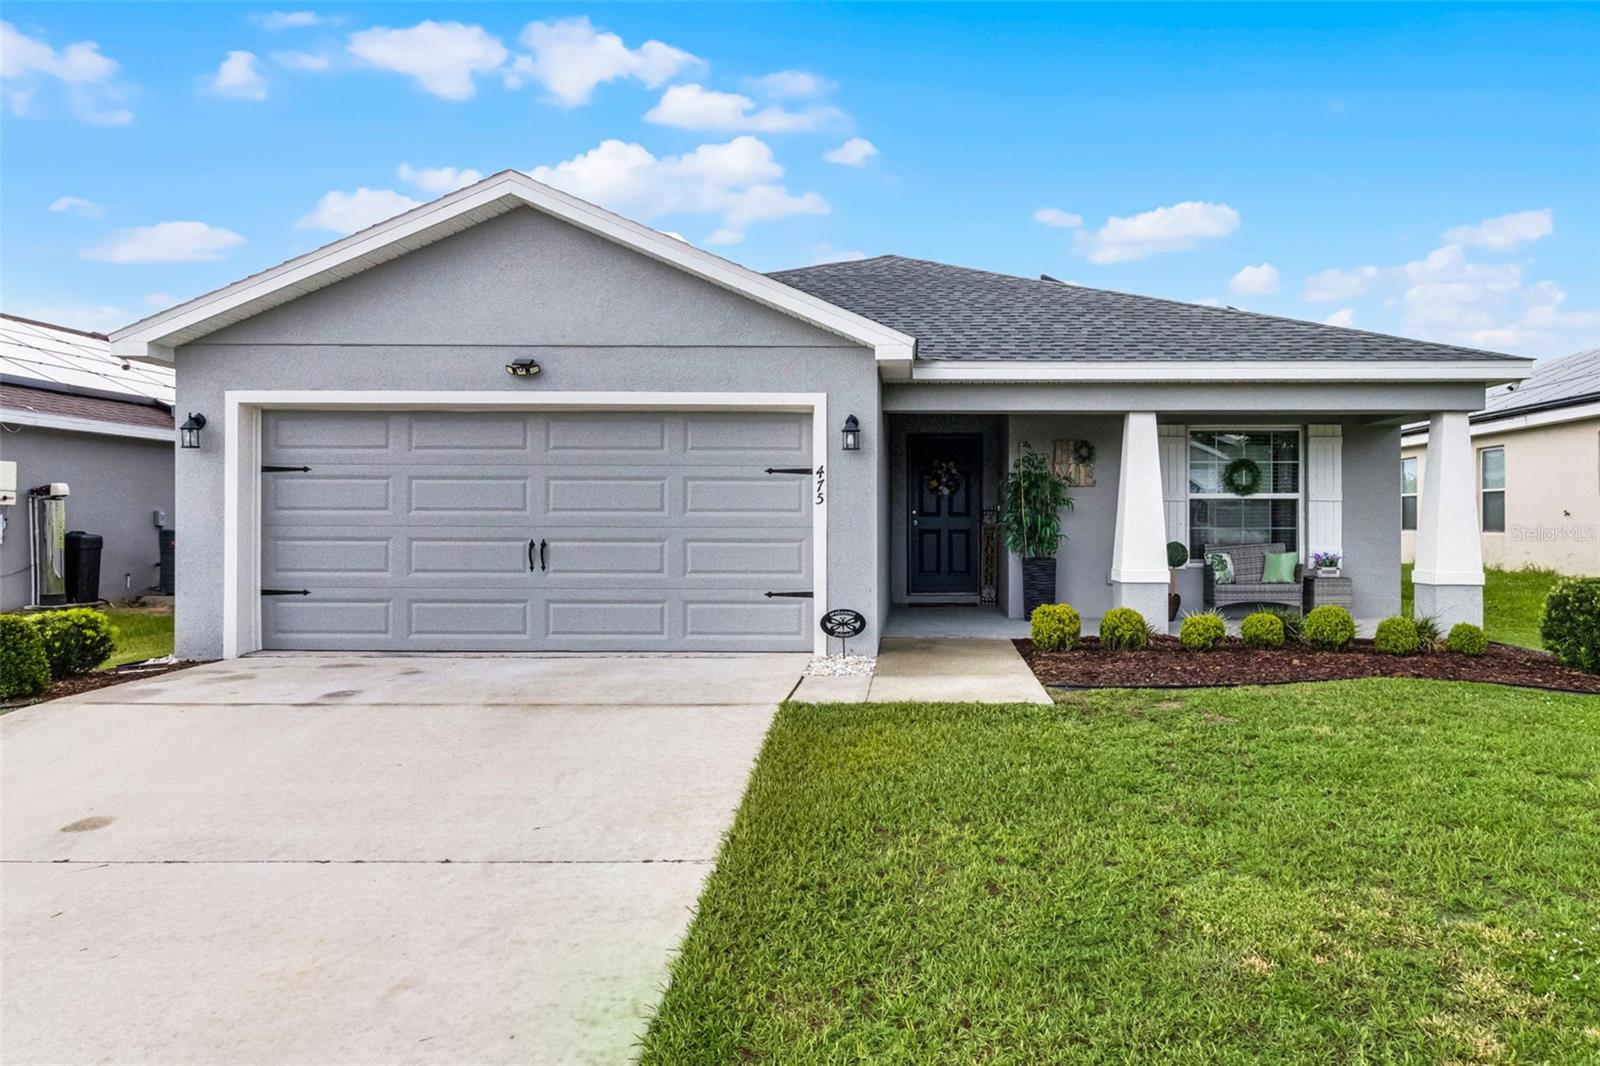
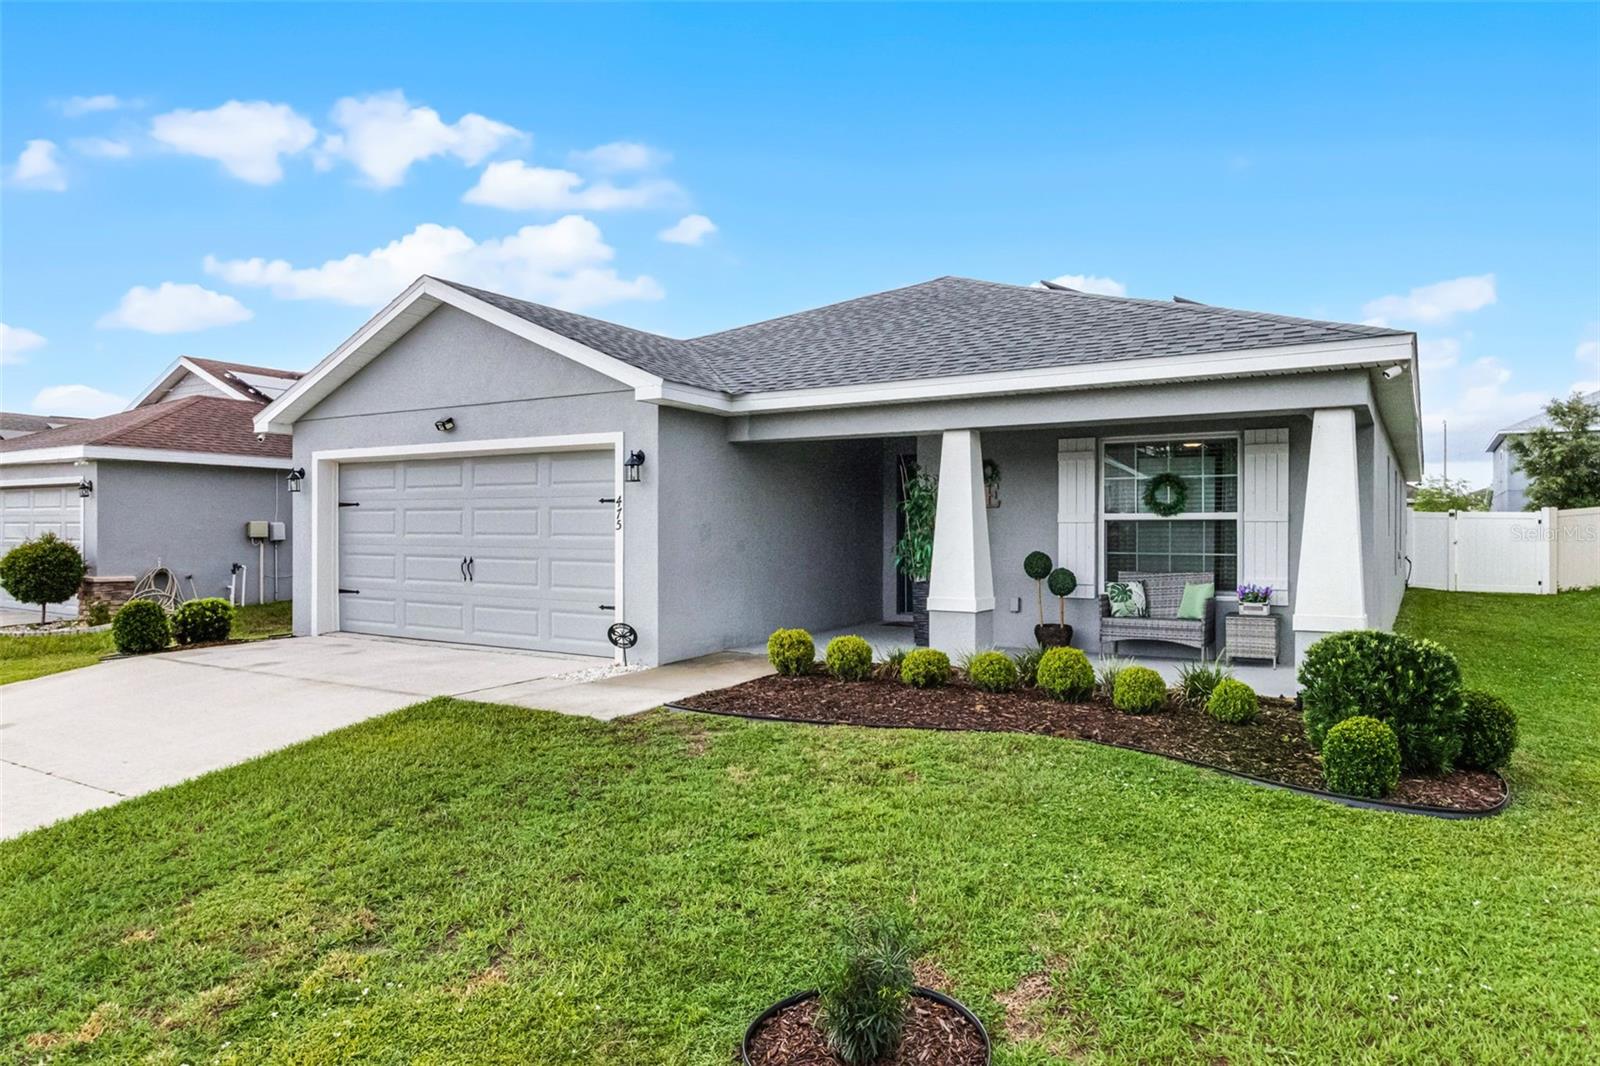
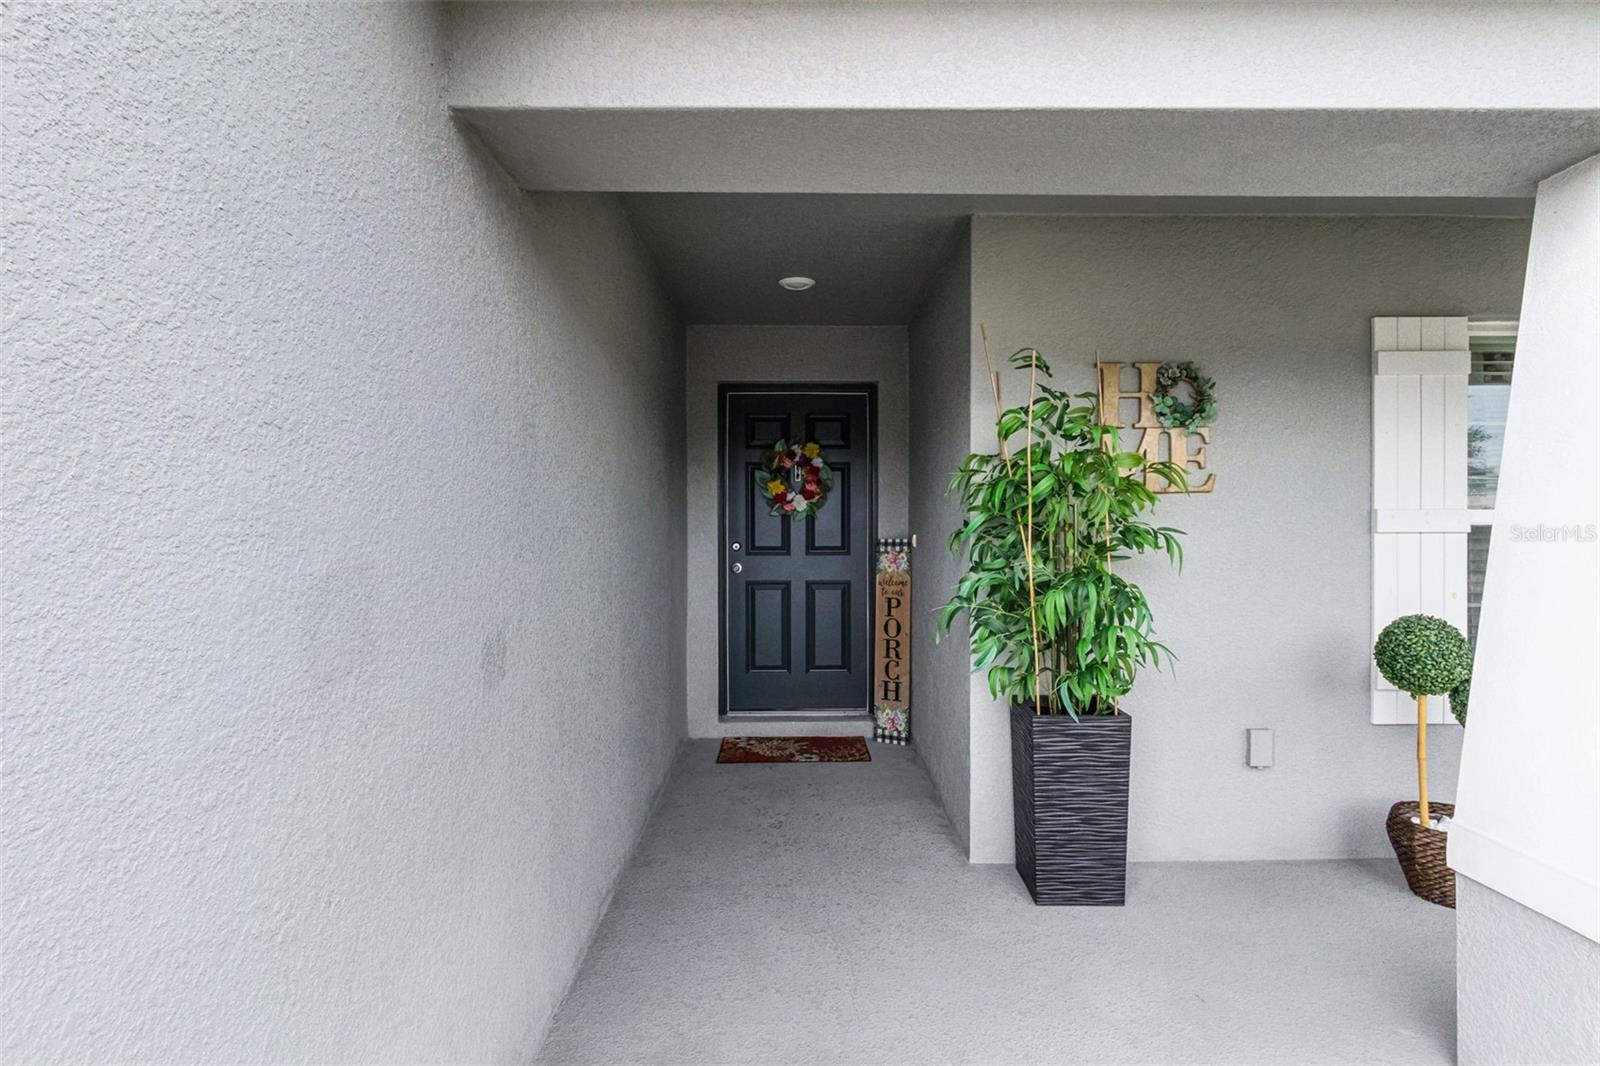
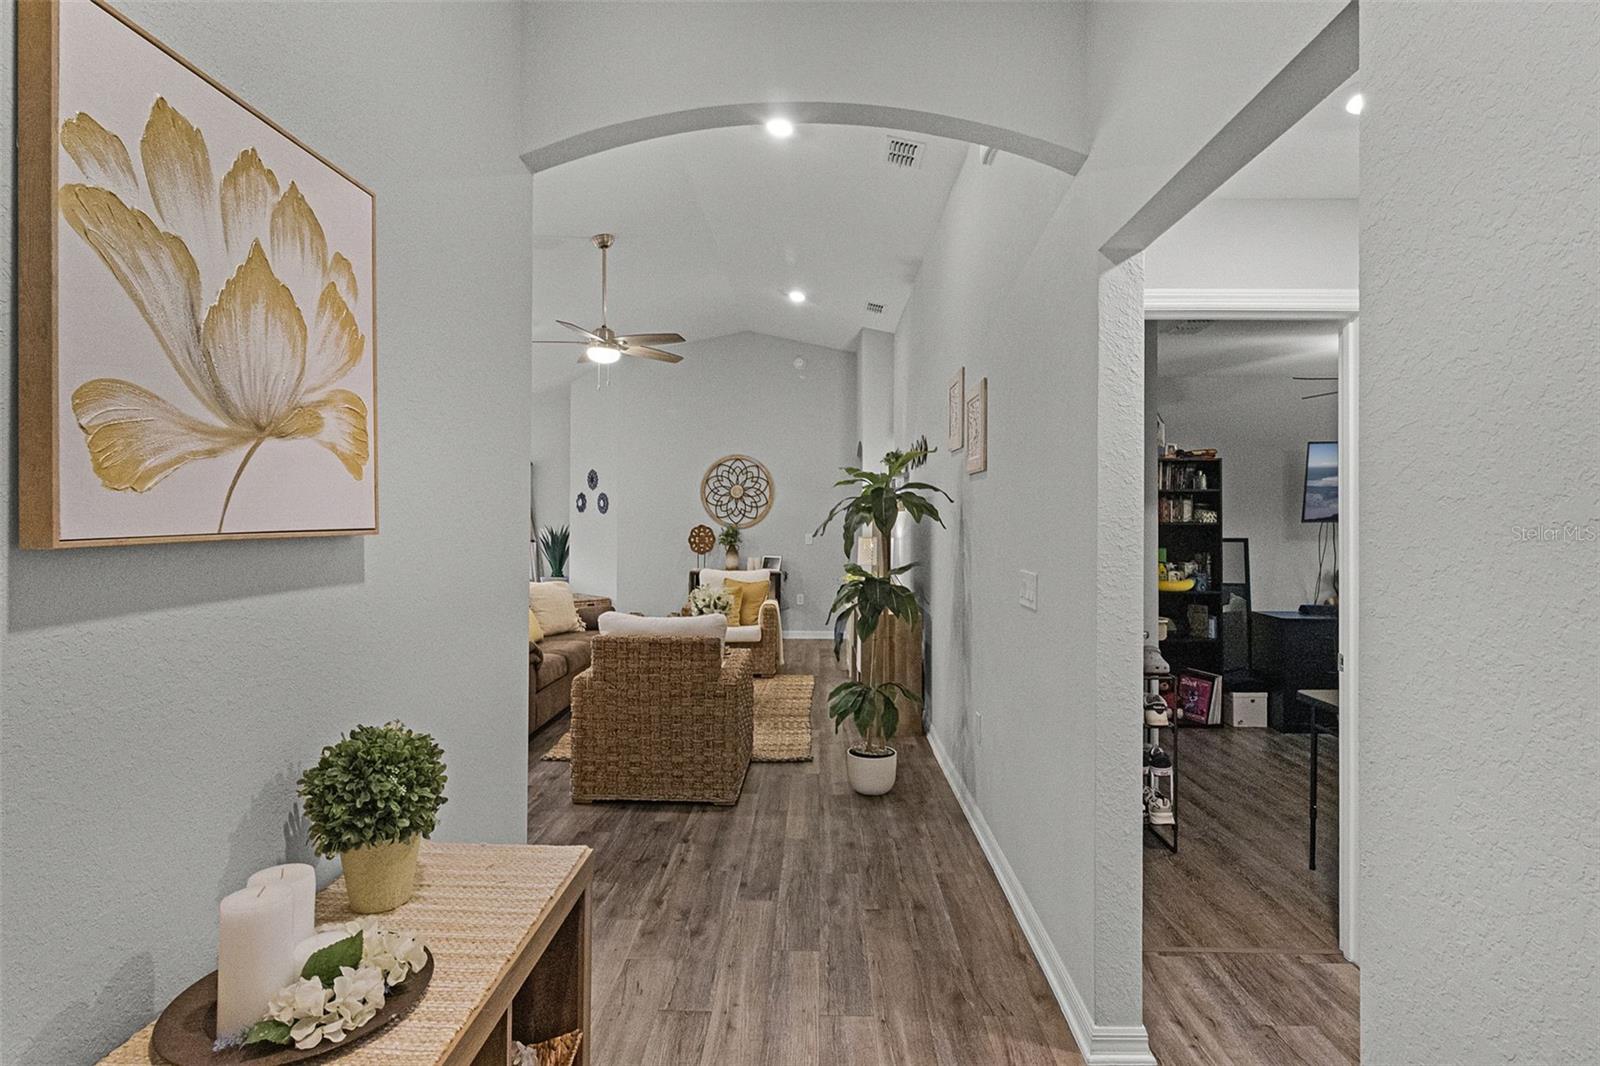
Property Description
Home is eligible for an ASSUMABLE LOAN OF 2.25%. Also, $20,000 towards Buyer(s) closing costs and prepaid items!!! WITH AN ACCEPTED OFFER AT FULL ASKING PRICE AND CLOSING BY 11/25/2025, SELLERS ARE CONCEDING UP TO $20,000.00 (YES, $20,000.00) TO BE USED TOWARDS CLOSING COSTS OR TO BUY INTEREST RATE DOWN OR TO DECREASE THE SOLAR PANEL PAYOFF. Why wait for a house to be build when this one is ready to move-in and to make it your home? Welcome to this absolutely stunning 4 bedroom, 2 bathroom home nestled in the highly sought-after community of Monticelli at Tower Lake. Immaculately maintained and full of charm, this residence offers a harmonious blend of modern upgrades, spacious living, and serene outdoor spaces, making it truly one of a kind. As you arrive, you'll be instantly captivated by the lush, manicured landscaping, a spacious 2-car garage, and a welcoming front porch, the prime spot to sip your morning coffee and enjoy the quiet surroundings. Step inside to discover easy-care laminate flooring throughout (no carpet!), soaring high ceilings, and a bright, open-concept floor plan accented by stylish light fixtures that bring a touch of elegance to every space. At the heart of the home is the gourmet chef’s kitchen—a true showstopper featuring ample cabinetry, unique solid wood countertops, sleek stainless steel appliances, and a massive island with bar seating. Whether you're whipping up weeknight dinners or hosting elaborate gatherings, you'll find everything you need right at your fingertips. Adjacent to the kitchen, the elegant dining area overlooks the backyard through a large set of sliding glass doors, flooding the space with natural light and providing a gorgeous backdrop for memorable meals with family and friends. The private primary suite is tucked away for maximum relaxation, featuring an oversized walk-in closet and a luxurious en-suite bathroom with dual vanities, a soaking tub, and a walk-in shower—your own spa-like escape at the end of a long day. Three additional bedrooms offers endless flexibility for family, guests, or even a home office, gym, or creative studio. A second full bathroom ensures everyone has space and comfort. This house comes equipped with energy-saving brand new solar panels that Buyers will assume at Closing. It also features a paid-off pure touch water filtration system. Step outside to your expansive backyard retreat, where a covered lanai leads to a fully fenced-in yard, perfect for pets, playtime, or gardening. The highlight of the backyard is the custom gazebo lounge area, ideal for summer cookouts, evening bonfires, or simply relaxing under the stars. Centrally located near shopping, dining, and everyday essentials, and with low HOA dues, this home offers both peace of mind and unbeatable value. Homes in this community do not come on the market often—don’t miss this rare opportunity to own a slice of paradise. Call today to schedule your showing—this immaculate gem won’t last long! You will fall in love with it!
Build Your Team
Quickly find investor-friendly professionals who can help you succeed in real estate investing at any stage of the investing journey.


Agents
Match with investor-friendly agents who can help you find, analyze, and close your next deal


Lenders
Get the best funding…find investor-friendly lenders who specialize in your deal strategy


Property Managers
Transition to passive investing. Find a trusted property management partnership that lasts.


Tax Pros & Accountants
Taxes and financial reporting made easy—find experts to create tax savings strategies, file taxes, and more
Location
Property Details
Parking
- Description: Garage
- Details: Driveway, Garage Door Opener, Oversized, Attached
- Garage Spaces: 2
- Spaces Total: 0
Bedroom Information
- # of Bedrooms: 4
Bathroom Information
- # of Baths (Full): 2
- # of Baths (Total): 2.0
Interior Features
- # of Rooms: 3
- # of Stories: 1
Exterior Features
- Exterior Walls Materials: Stucco
- Foundation: Slab
- Roof Type: Hip
- Roof Material: Shingle
HOA
- Has HOA: Yes
- Association: Monticelli at Tower Lake HOA/Nicki Johnson
- HOA Fee: $900/annually
Land Information
- Land Use: Residential
- Land Use Subtype: Single Family Residential
Lot Information
- Parcel ID: 272717741013000190
- Lot Size: 6708 sqft
Property Information
- Property Type: Single Family Residence
- Year Built: 2020
Tax Information
- Annual Tax: $6,039
Utilities
- Water & Sewer: Public
- Heating: Active Solar, Central, Solar
- Cooling: Central Air
Location
- County: Polk
Listing Details
Investment Summary
- Monthly Cash Flow
- -$733
- Cap Rate
- 3.6%
- Cash-on-Cash Return
- -11.2%
- Debt Coverage Ratio
- 0.58
- Internal Rate of Return (5 years)
- -6.9%
Cash Flow
Net Operating Income (NOI) minus mortgage payments.
Calculation:
NOI - Mortgage Payments
Cap Rate (Market Value)
Capitalization Rate is a rate of return that compares the yearly Net Operating Income (NOI) to the market value.
Calculation:
NOI / Market Value
Cash-on-Cash Return (CoC)
Annual Cash Flow / Cash Invested
Calculation:
Annual cash flow divided by initial cash invested.
Debt Coverage Ratio (DCR)
Net Operating Income (NOI) divided by total debt payments.
Calculation:
NOI / Total Debt Payments
Internal Rate of Return (IRR)
A metric for assessing profitability over time. IRR is the discount rate at which the net present value (NPV) of all future cash flows (positive and negative) from an investment equals zero — including both periodic cash flow (such as rent) and a projected sale at the end of the holding period. It represents the expected annualized return, accounting for income, expenses, and the recovery of capital through a future sale.
Purchase Details
Purchase PriceThe price paid for the property. Purchase price:
| $340,000 |
|---|---|
Amount FinancedThe amount of the purchase financed through a loan. Amount financed:
| -$272,000 |
Down paymentThe initial payment made towards the purchase. Down payment:
| $68,000 |
Closing CostsFees and expenses associated with purchasing a property, typically ranging from 2% to 5% of the home’s purchase price, paid at the end of a home purchase to cover services like lending, title transfer, and taxes. Closing costs:
| $10,200 |
Rehab CostsCosts incurred to repair or improve the property, including: roof, flooring, exterior siding, kitchen, exterior paint, bathrooms, etc. Rehab costs:
| $0 |
Initial Cash InvestedThe total initial cash invested in the property. Calculation:Down payment + Buying costs + Rehab costs Initial cash invested:
| $78,200 |
Square Feet (SQFT)The total square footage of the property. Square feet:
| 1,698 |
Cost Per Square FootCost per square foot of the property. Calculation:Purchase Price / Square Feet Cost per square foot:
| $200 |
Monthly Rent Per Square FootMonthly rent divided by the number of square feet. This ratio helps investors compare rental income efficiency across properties, markets, and unit sizes Calculation:Monthly Rent / Square Feet Monthly rent per square foot:
| $1.35 |
Financing Details
Loan AmountThe total sum of money borrowed from a lender to finance a property purchase. Calculation:Purchase Price - Down Payment
Loan amount:
| $272,000 |
|---|---|
Loan to Value Ratio (LTV)Loan amount divided by the market value of the property. Calculation:Loan Amount / Market Value
Loan to value ratio:
| 80.0% |
Loan TypeThe type of loan (e.g., fixed, adjustable).
Loan type:
| Amortizing |
TermThe loan repayment period in years.
Term:
| 30 years |
Interest RateThe percentage a lender charges on the borrowed amount of a loan, determining the cost of borrowing money.
Interest rate:
| 6.625% |
Principal & Interest (PI)The principal is the portion of the loan payment that reduces the loan balance. The interest is the lender's charge for borrowing money. Calculation:(P * r * (1 + r) ** n) / ((1 + r) ** n - 1) Where:
P = Loan amount (principal)
Principal & interest:
| $1,742 |
Property TaxesAnnual taxes levied by local governments on real estate properties. These taxes fund public services like schools, roads, and emergency services.
Property tax:
| $503 |
InsuranceThe costs for insurance coverage to protect against financial losses due to risks like fire, natural disasters, theft, liability, or tenant-related damages. Calculation:Assumes 7% of gross rental income, unless insurance rates are specified.
Insurance:
| $161 |
Private Mortgage Insurance (PMI)A fee that borrowers pay when they take out a conventional loan with a loan-to-value (LTV) ratio above 80%.
Private mortgage insurance (PMI):
| $0 |
Monthly PaymentThe fixed amount a borrower pays each month to repay a loan. It typically includes principal and interest (P&I) and may also cover property taxes, insurance, HOA fees, and PMI if escrowed. Monthly payment:
| $2,406 |
Operating Income
| % Rent | Monthly | Yearly | |
|---|---|---|---|
Gross RentThe total rental income received from tenants before deducting any expenses. Includes base rent, late fees, pet fees, parking fees, and other recurring charges.
Gross rent:
| $2,300 | $27,600 | |
Vacancy LossExpected loss of rent due to vacancies.
Vacancy loss:
(6%)
| 6% | -$138 | -$1,656 |
Operating IncomeGross rental income minus vacancy loss. Calculation:Gross rent - Vacancy loss
Operating income:
| $2,162 | $25,944 |
Operating Expenses
| % Rent | Monthly | Yearly | |
|---|---|---|---|
Property TaxesAnnual taxes levied by local governments on real estate properties. These taxes fund public services like schools, roads, and emergency services. | 22% | -$503 | -$6,039 |
InsuranceThe costs for insurance coverage to protect against financial losses due to risks like fire, natural disasters, theft, liability, or tenant-related damages. Calculation:Assumes 7% of gross rental income, unless insurance rates are specified. | 7% | -$161 | -$1,932 |
Property ManagementThe costs associated with hiring a property manager to handle the day-to-day operations of a rental property. Includes management fees, leasing fes, eviction fees, etc. Calculation:Assumes 8% of gross rental income. | 8% | -$184 | -$2,208 |
Repairs & MaintenanceOngoing costs for routine upkeep and minor fixes needed to keep a property in good working condition. Calculation:Assumes 5% of gross rental income. Varies by property age and condition. | 5% | -$115 | -$1,380 |
Capital ExpensesLarge, infrequent costs for major improvements or replacements, like a new roof, HVAC system, or appliances. Calculation:Assumes 5% of gross rental income. Varies by property age. | 5% | -$115 | -$1,380 |
HOA FeesRegular dues paid to a Homeowners Association for community maintenance, amenities, and management. Similar fees include: Condo Association Fees, Co-op Maintenance Fees, etc. | 3% | -$75 | -$900 |
Operating ExpensesRecurring costs required to maintain and manage a rental property, including property taxes, insurance, maintenance, repairs, utilities (if paid by the owner), property management fees, and other day-to-day expenses. Calculation:Insurance + Property Taxes + Property Management + Repairs & Maintenance + Capital Expenditures + HOA Fees | 50% | -$1,153 | -$13,839 |
Cash Flow
| Monthly | Yearly | |
|---|---|---|
Net Operating Income (NOI)The income generated from a property after deducting all operating expenses but before deducting mortgage payments, taxes, and capital expenditures. Calculation:Gross Operating Income - Operating Expenses
Net operating income:
| $1,009 | $12,108 |
Mortgage PaymentThe fixed amount a borrower pays each month to repay a loan. It typically includes principal and interest (P&I) and may also cover property taxes, insurance, HOA fees, and PMI if escrowed. | -$1,742 | -$20,904 |
Cash FlowNet Operating Income (NOI) minus mortgage payments. Calculation:NOI - Mortgage Payments | -$733 | -$8,796 |