$799,990
Investment Summary
- Monthly Cash Flow
- -$2,225
- Cap Rate
- 2.8%
- Cash-on-Cash Return
- -14.5%
- Debt Coverage Ratio
- 0.46
- Internal Rate of Return (5 years)
- -10.0%
Cash Flow
Net Operating Income (NOI) minus mortgage payments.
Calculation:
NOI - Mortgage Payments
Cap Rate (Market Value)
Capitalization Rate is a rate of return that compares the yearly Net Operating Income (NOI) to the market value.
Calculation:
NOI / Market Value
Cash-on-Cash Return (CoC)
Annual Cash Flow / Cash Invested
Calculation:
Annual cash flow divided by initial cash invested.
Debt Coverage Ratio (DCR)
Net Operating Income (NOI) divided by total debt payments.
Calculation:
NOI / Total Debt Payments
Internal Rate of Return (IRR)
A metric for assessing profitability over time. IRR is the discount rate at which the net present value (NPV) of all future cash flows (positive and negative) from an investment equals zero — including both periodic cash flow (such as rent) and a projected sale at the end of the holding period. It represents the expected annualized return, accounting for income, expenses, and the recovery of capital through a future sale.
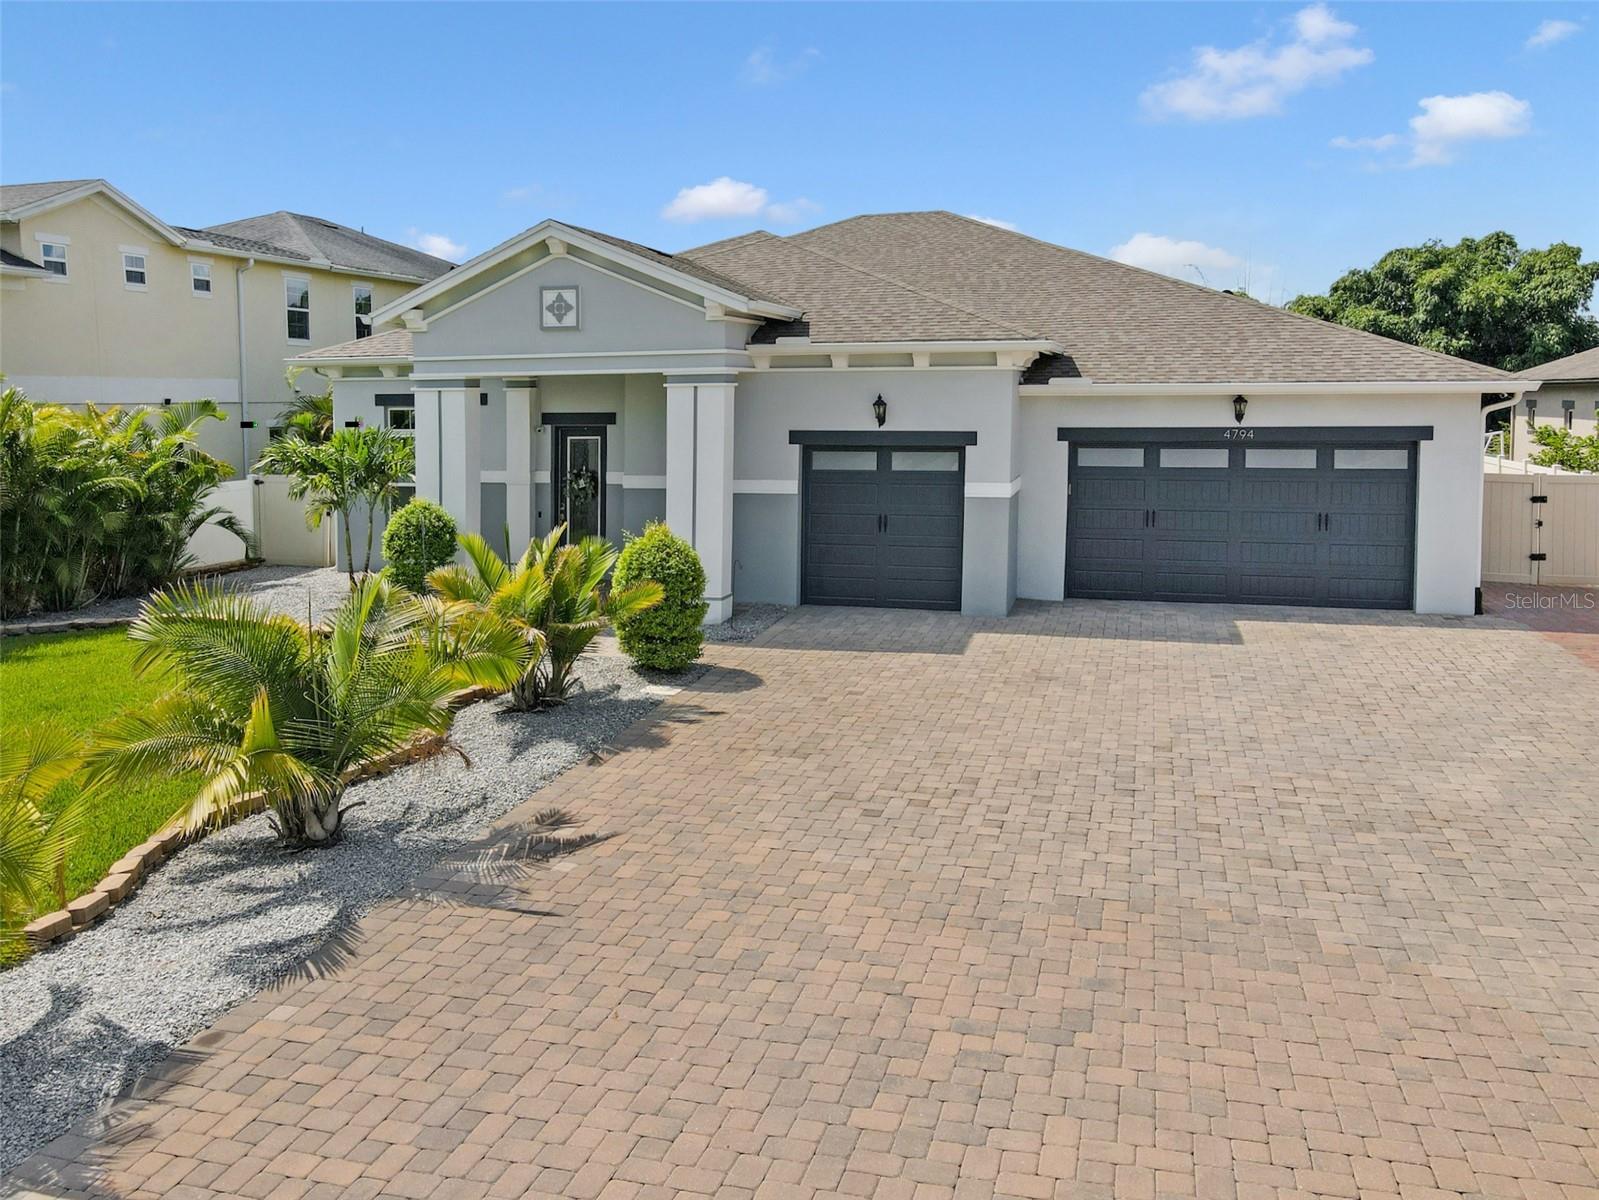
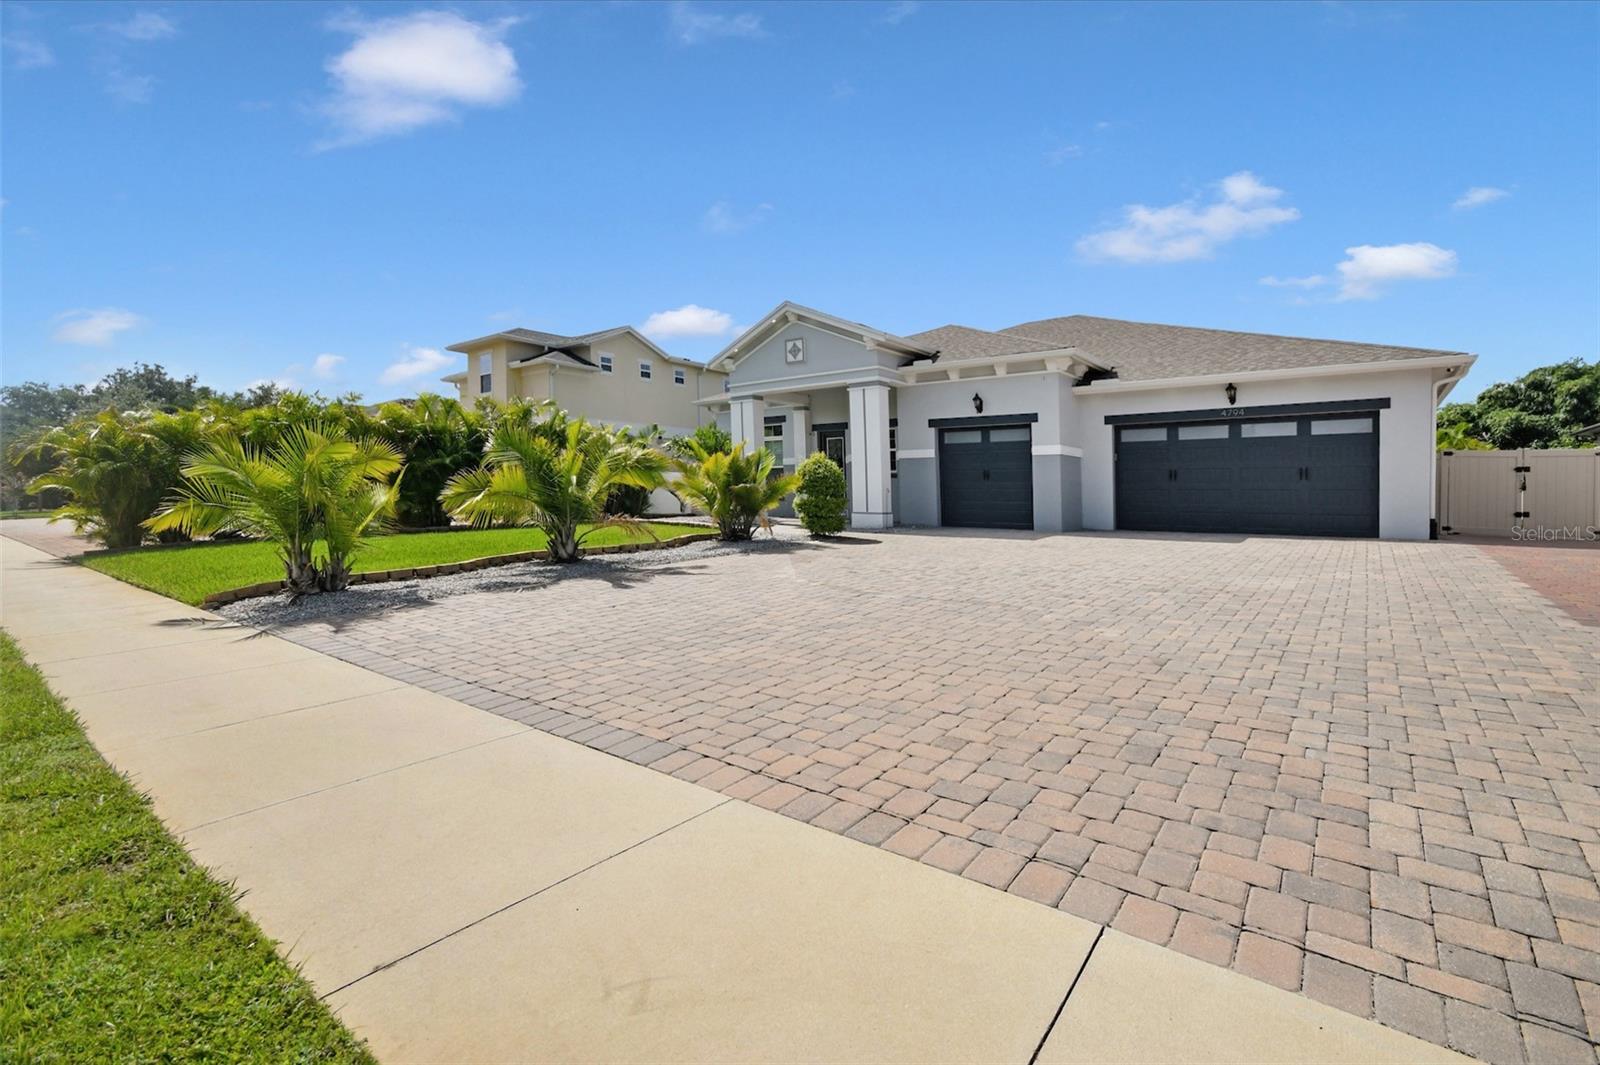
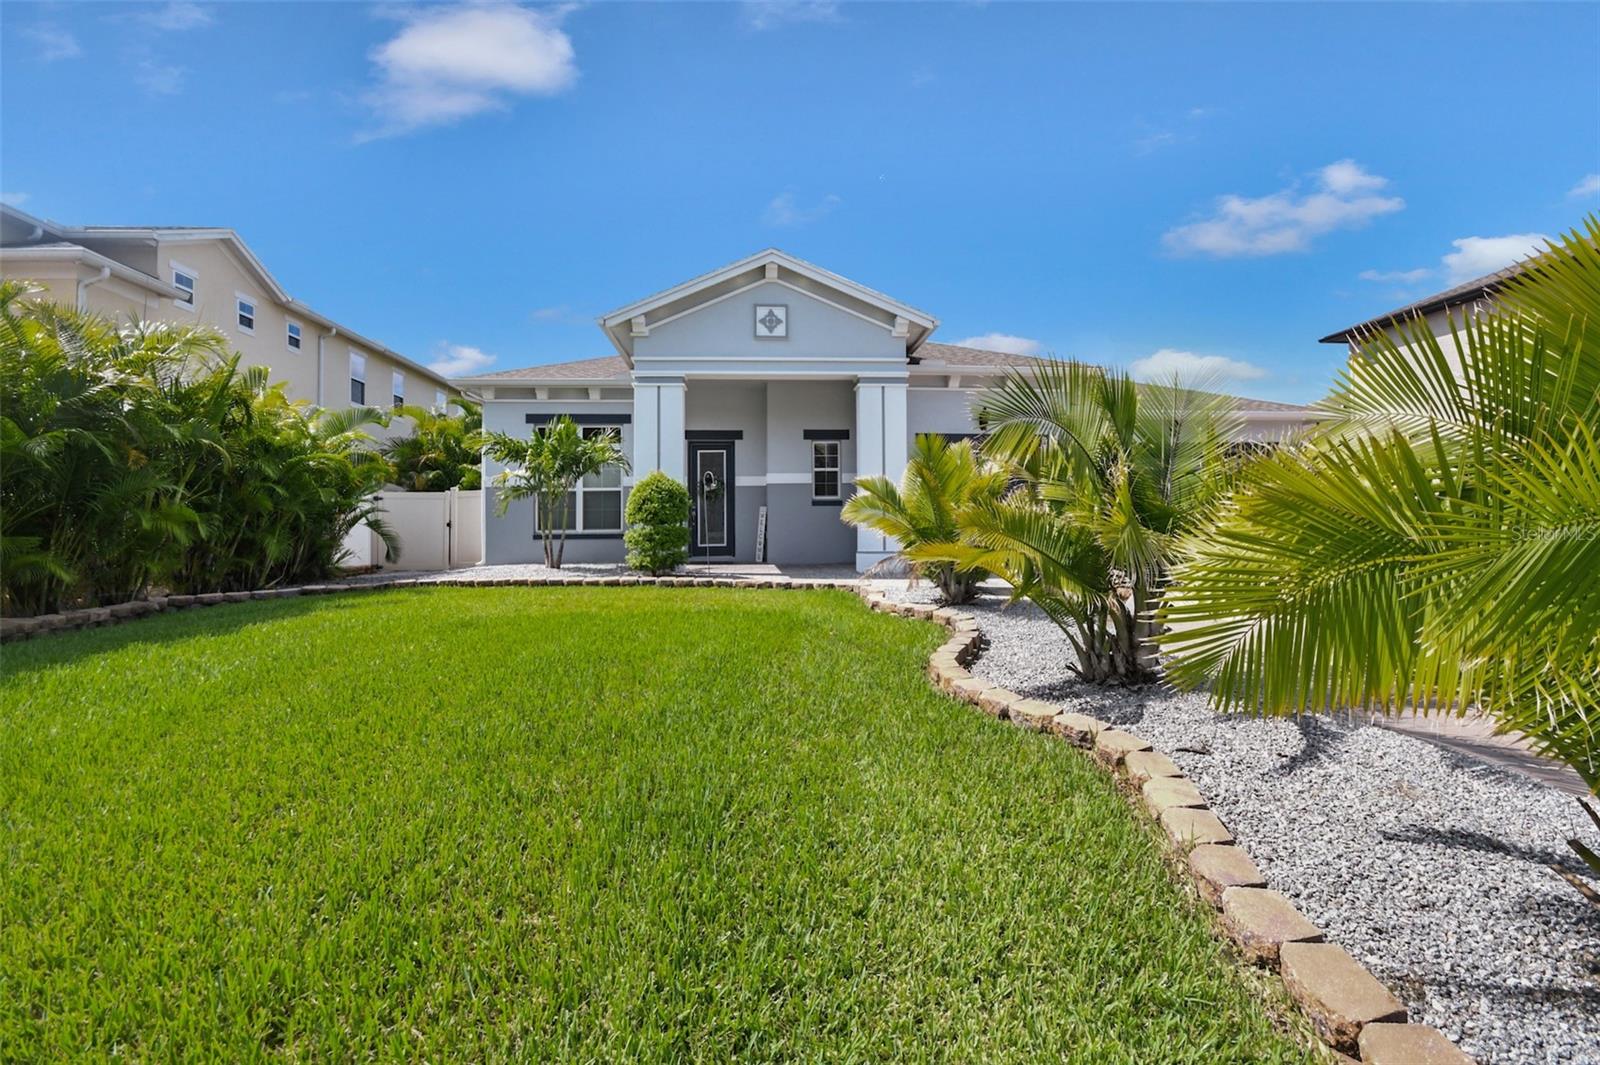
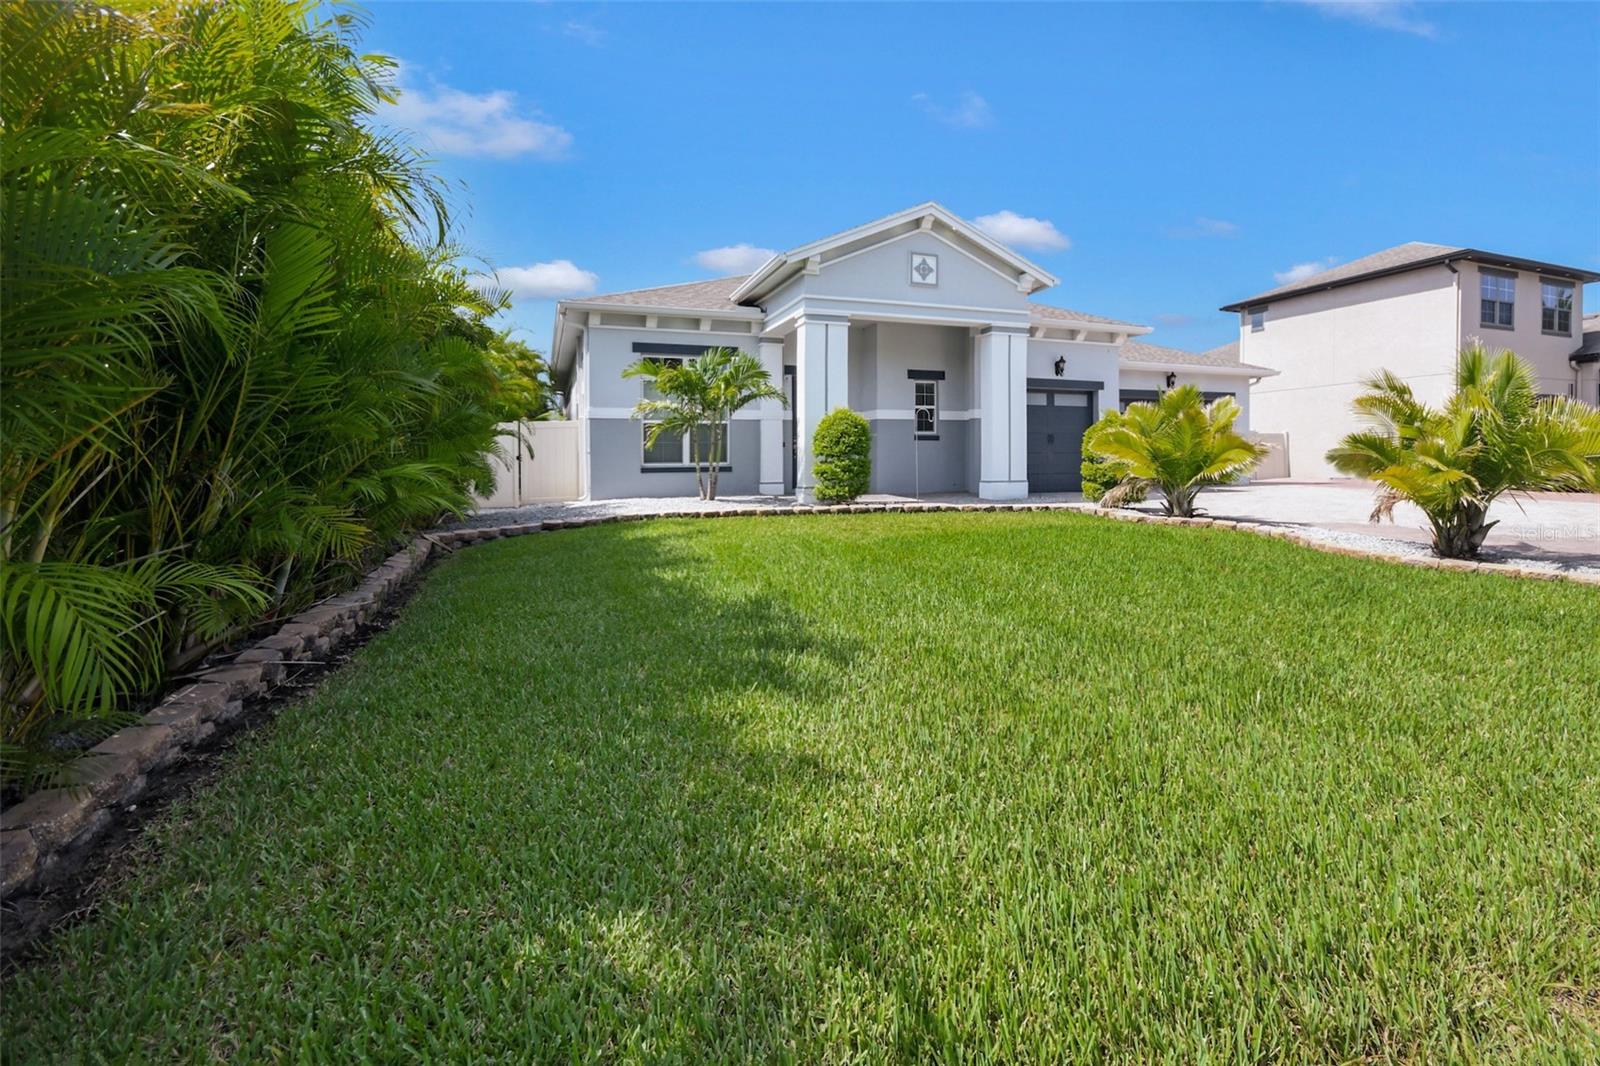
Property Description
Welcome to this stunning 3 bedroom, 3 full bathrooms home built by Jones Homes. This sought-after Sanibel model boasts impressive 12-foot ceilings, a rare find in the market. The home has undergone significant upgrades, including the addition of subway tiles above and below the cabinets, quartz countertops, and luxury waterproof vinyl flooring. Upgraded fans and lighting fixtures enhance the home's ambiance, while new electric blinds on remote control for the large telescoping sliding doors and new blinds throughout provide privacy and convenience. The bathrooms have been tastefully updated with new mirrors, lighting, and shelving, while the master bedroom's tray ceiling now features additional can lights. This home has also been recently painted inside and out. A new 5 ton high efficiency ac was just installed May 25th, 2025. The exterior of the home has not been neglected, with the addition of 192 Aerica Palms for privacy and a new vinyl-fenced backyard with large gates on both the front and rear of the property. The home's open concept kitchen, dining, and living room create a spacious and inviting atmosphere, complemented by beautiful double windows. A designated office space with double glass doors provides a quiet workspace, while the large laundry room with cabinets, coffee bar, and huge walk-in pantry offers ample storage and convenience. The master suite is a true retreat, featuring a spacious walk-in closet, sitting area and a luxurious master bath with an expanded walk-in shower equipped with double shower heads and a bench. All bedrooms are equipped with walk-in closets, and the home boasts 6-inch baseboards throughout, beautiful wood window seals, 8-foot doors, and stylish barn doors that set it apart from other new builds. The expanded brick paver driveway can comfortably accommodate up to 8 cars, leading to a massive three-car garage with overhead attic and shelving for ample storage. Custom epoxy floors add a touch of sophistication to the garage. The exterior of the home is further enhanced by accent lighting in the soffit, which beautifully illuminates the property at night and can be controlled via a smartphone app. Over half of the property is covered in landscaping rocks, with numerous palm trees adding a tropical touch. As an added bonus, the owner has recently designed and installed a sparkling pool with a pool deck and screened enclosure, creating a serene oasis perfect for relaxation. The pool features a mesmerizing rock wall waterfall, overlooking the expansive half-acre lot. This exceptional home is situated in a desirable location with no HOA or CDD fees. Minutes from Saint Cloud’s Lake Front Park and Marina with walking trails, sunset cruises and great cuisine! Located close to Saint Cloud’s downtown district and Lake Nona as well. Don't miss this opportunity to make this beautifully appointed home yours, schedule a viewing and experience the epitome of luxury living and make this your home today!
Build Your Team
Quickly find investor-friendly professionals who can help you succeed in real estate investing at any stage of the investing journey.


Agents
Match with investor-friendly agents who can help you find, analyze, and close your next deal


Lenders
Get the best funding…find investor-friendly lenders who specialize in your deal strategy


Property Managers
Transition to passive investing. Find a trusted property management partnership that lasts.


Tax Pros & Accountants
Taxes and financial reporting made easy—find experts to create tax savings strategies, file taxes, and more
Location
Property Details
Parking
- Description: Garage Door Opener, Oversized
- Details: Garage Door Opener, Oversized, Attached
- Garage Spaces: 3
- Spaces Total: 0
Bedroom Information
- # of Bedrooms: 3
Bathroom Information
- # of Baths (Full): 3
- # of Baths (Partial): 1
- # of Baths (Total): 3.0
Interior Features
- # of Rooms: 12
- # of Stories: 1
Exterior Features
- Exterior Walls Materials: Concrete Block
- Foundation: Slab
- Roof Type: Gable or Hip
- Roof Material: Shingle
- Pool: Yes
Land Information
- Land Use: Residential
- Land Use Subtype: Single Family Residential
Lot Information
- Parcel ID: 312531062200010070
- Lot Size: 18731 sqft
Property Information
- Property Type: Single Family Residence
- Style: Contemporary
- Year Built: 2017
Tax Information
- Annual Tax: $6,502
Utilities
- Water & Sewer: Public
- Heating: Central, Heat Pump
- Cooling: Central Air
Location
- County: Osceola
Listing Details
Investment Summary
- Monthly Cash Flow
- -$2,225
- Cap Rate
- 2.8%
- Cash-on-Cash Return
- -14.5%
- Debt Coverage Ratio
- 0.46
- Internal Rate of Return (5 years)
- -10.0%
Cash Flow
Net Operating Income (NOI) minus mortgage payments.
Calculation:
NOI - Mortgage Payments
Cap Rate (Market Value)
Capitalization Rate is a rate of return that compares the yearly Net Operating Income (NOI) to the market value.
Calculation:
NOI / Market Value
Cash-on-Cash Return (CoC)
Annual Cash Flow / Cash Invested
Calculation:
Annual cash flow divided by initial cash invested.
Debt Coverage Ratio (DCR)
Net Operating Income (NOI) divided by total debt payments.
Calculation:
NOI / Total Debt Payments
Internal Rate of Return (IRR)
A metric for assessing profitability over time. IRR is the discount rate at which the net present value (NPV) of all future cash flows (positive and negative) from an investment equals zero — including both periodic cash flow (such as rent) and a projected sale at the end of the holding period. It represents the expected annualized return, accounting for income, expenses, and the recovery of capital through a future sale.
Purchase Details
Purchase PriceThe price paid for the property. Purchase price:
| $799,990 |
|---|---|
Amount FinancedThe amount of the purchase financed through a loan. Amount financed:
| -$639,992 |
Down paymentThe initial payment made towards the purchase. Down payment:
| $159,998 |
Closing CostsFees and expenses associated with purchasing a property, typically ranging from 2% to 5% of the home’s purchase price, paid at the end of a home purchase to cover services like lending, title transfer, and taxes. Closing costs:
| $24,000 |
Rehab CostsCosts incurred to repair or improve the property, including: roof, flooring, exterior siding, kitchen, exterior paint, bathrooms, etc. Rehab costs:
| $0 |
Initial Cash InvestedThe total initial cash invested in the property. Calculation:Down payment + Buying costs + Rehab costs Initial cash invested:
| $183,998 |
Square Feet (SQFT)The total square footage of the property. Square feet:
| 2,936 |
Cost Per Square FootCost per square foot of the property. Calculation:Purchase Price / Square Feet Cost per square foot:
| $272 |
Monthly Rent Per Square FootMonthly rent divided by the number of square feet. This ratio helps investors compare rental income efficiency across properties, markets, and unit sizes Calculation:Monthly Rent / Square Feet Monthly rent per square foot:
| $1.19 |
Financing Details
Loan AmountThe total sum of money borrowed from a lender to finance a property purchase. Calculation:Purchase Price - Down Payment
Loan amount:
| $639,992 |
|---|---|
Loan to Value Ratio (LTV)Loan amount divided by the market value of the property. Calculation:Loan Amount / Market Value
Loan to value ratio:
| 80.0% |
Loan TypeThe type of loan (e.g., fixed, adjustable).
Loan type:
| Amortizing |
TermThe loan repayment period in years.
Term:
| 30 years |
Interest RateThe percentage a lender charges on the borrowed amount of a loan, determining the cost of borrowing money.
Interest rate:
| 6.625% |
Principal & Interest (PI)The principal is the portion of the loan payment that reduces the loan balance. The interest is the lender's charge for borrowing money. Calculation:(P * r * (1 + r) ** n) / ((1 + r) ** n - 1) Where:
P = Loan amount (principal)
Principal & interest:
| $4,098 |
Property TaxesAnnual taxes levied by local governments on real estate properties. These taxes fund public services like schools, roads, and emergency services.
Property tax:
| $542 |
InsuranceThe costs for insurance coverage to protect against financial losses due to risks like fire, natural disasters, theft, liability, or tenant-related damages. Calculation:Assumes 7% of gross rental income, unless insurance rates are specified.
Insurance:
| $245 |
Private Mortgage Insurance (PMI)A fee that borrowers pay when they take out a conventional loan with a loan-to-value (LTV) ratio above 80%.
Private mortgage insurance (PMI):
| $0 |
Monthly PaymentThe fixed amount a borrower pays each month to repay a loan. It typically includes principal and interest (P&I) and may also cover property taxes, insurance, HOA fees, and PMI if escrowed. Monthly payment:
| $4,885 |
Operating Income
| % Rent | Monthly | Yearly | |
|---|---|---|---|
Gross RentThe total rental income received from tenants before deducting any expenses. Includes base rent, late fees, pet fees, parking fees, and other recurring charges.
Gross rent:
| $3,500 | $42,000 | |
Vacancy LossExpected loss of rent due to vacancies.
Vacancy loss:
(6%)
| 6% | -$210 | -$2,520 |
Operating IncomeGross rental income minus vacancy loss. Calculation:Gross rent - Vacancy loss
Operating income:
| $3,290 | $39,480 |
Operating Expenses
| % Rent | Monthly | Yearly | |
|---|---|---|---|
Property TaxesAnnual taxes levied by local governments on real estate properties. These taxes fund public services like schools, roads, and emergency services. | 15% | -$542 | -$6,502 |
InsuranceThe costs for insurance coverage to protect against financial losses due to risks like fire, natural disasters, theft, liability, or tenant-related damages. Calculation:Assumes 7% of gross rental income, unless insurance rates are specified. | 7% | -$245 | -$2,940 |
Property ManagementThe costs associated with hiring a property manager to handle the day-to-day operations of a rental property. Includes management fees, leasing fes, eviction fees, etc. Calculation:Assumes 8% of gross rental income. | 8% | -$280 | -$3,360 |
Repairs & MaintenanceOngoing costs for routine upkeep and minor fixes needed to keep a property in good working condition. Calculation:Assumes 5% of gross rental income. Varies by property age and condition. | 5% | -$175 | -$2,100 |
Capital ExpensesLarge, infrequent costs for major improvements or replacements, like a new roof, HVAC system, or appliances. Calculation:Assumes 5% of gross rental income. Varies by property age. | 5% | -$175 | -$2,100 |
HOA FeesRegular dues paid to a Homeowners Association for community maintenance, amenities, and management. Similar fees include: Condo Association Fees, Co-op Maintenance Fees, etc. | n/a | n/a | n/a |
Operating ExpensesRecurring costs required to maintain and manage a rental property, including property taxes, insurance, maintenance, repairs, utilities (if paid by the owner), property management fees, and other day-to-day expenses. Calculation:Insurance + Property Taxes + Property Management + Repairs & Maintenance + Capital Expenditures + HOA Fees | 40% | -$1,417 | -$17,002 |
Cash Flow
| Monthly | Yearly | |
|---|---|---|
Net Operating Income (NOI)The income generated from a property after deducting all operating expenses but before deducting mortgage payments, taxes, and capital expenditures. Calculation:Gross Operating Income - Operating Expenses
Net operating income:
| $1,873 | $22,476 |
Mortgage PaymentThe fixed amount a borrower pays each month to repay a loan. It typically includes principal and interest (P&I) and may also cover property taxes, insurance, HOA fees, and PMI if escrowed. | -$4,098 | -$49,176 |
Cash FlowNet Operating Income (NOI) minus mortgage payments. Calculation:NOI - Mortgage Payments | $2,225 | $26,700 |