$899,000
Investment Summary
- Monthly Cash Flow
- -$2,605
- Cap Rate
- 2.7%
- Cash-on-Cash Return
- -15.1%
- Debt Coverage Ratio
- 0.43
- Internal Rate of Return (5 years)
- -10.6%
Cash Flow
Net Operating Income (NOI) minus mortgage payments.
Calculation:
NOI - Mortgage Payments
Cap Rate (Market Value)
Capitalization Rate is a rate of return that compares the yearly Net Operating Income (NOI) to the market value.
Calculation:
NOI / Market Value
Cash-on-Cash Return (CoC)
Annual Cash Flow / Cash Invested
Calculation:
Annual cash flow divided by initial cash invested.
Debt Coverage Ratio (DCR)
Net Operating Income (NOI) divided by total debt payments.
Calculation:
NOI / Total Debt Payments
Internal Rate of Return (IRR)
A metric for assessing profitability over time. IRR is the discount rate at which the net present value (NPV) of all future cash flows (positive and negative) from an investment equals zero — including both periodic cash flow (such as rent) and a projected sale at the end of the holding period. It represents the expected annualized return, accounting for income, expenses, and the recovery of capital through a future sale.
Property Description
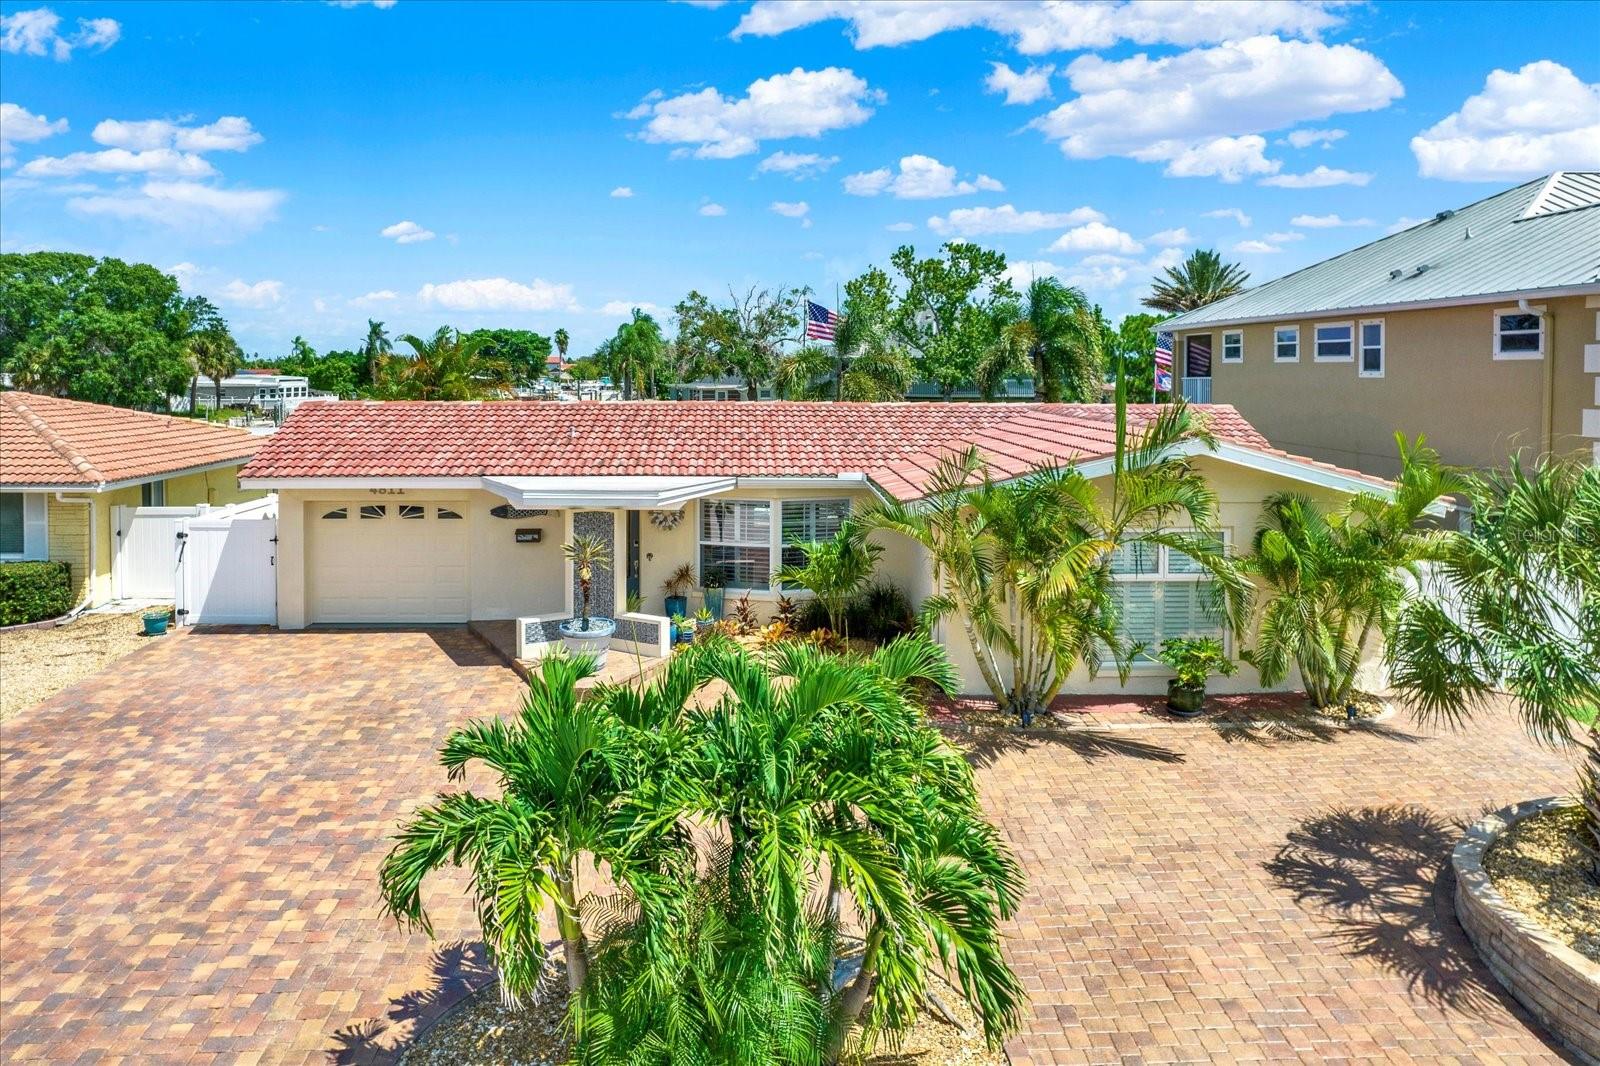
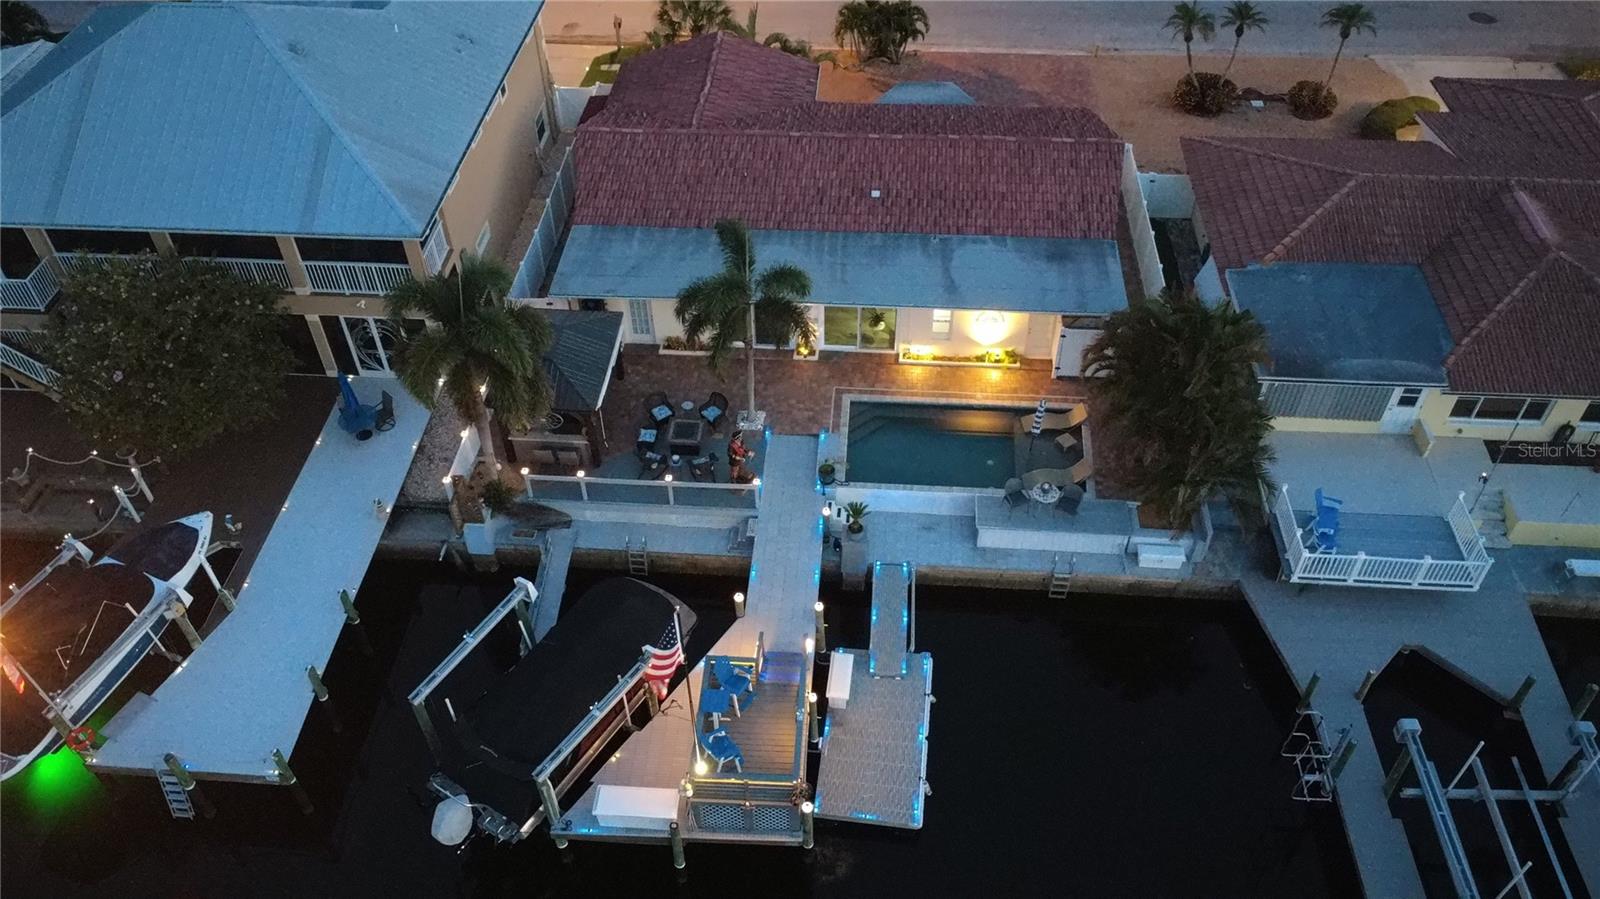
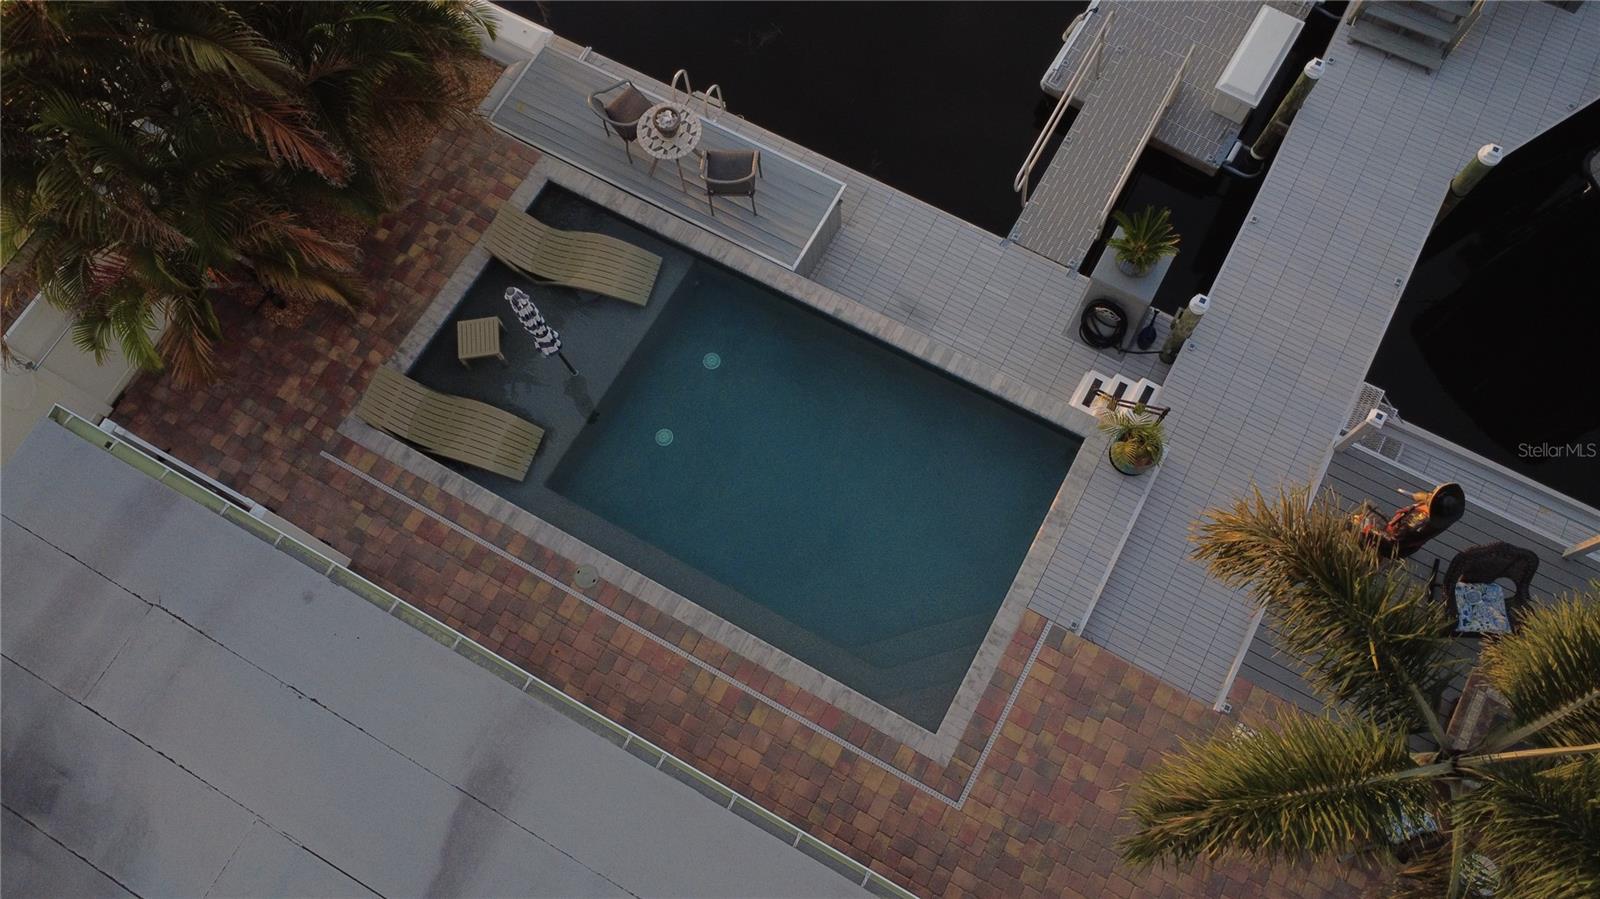
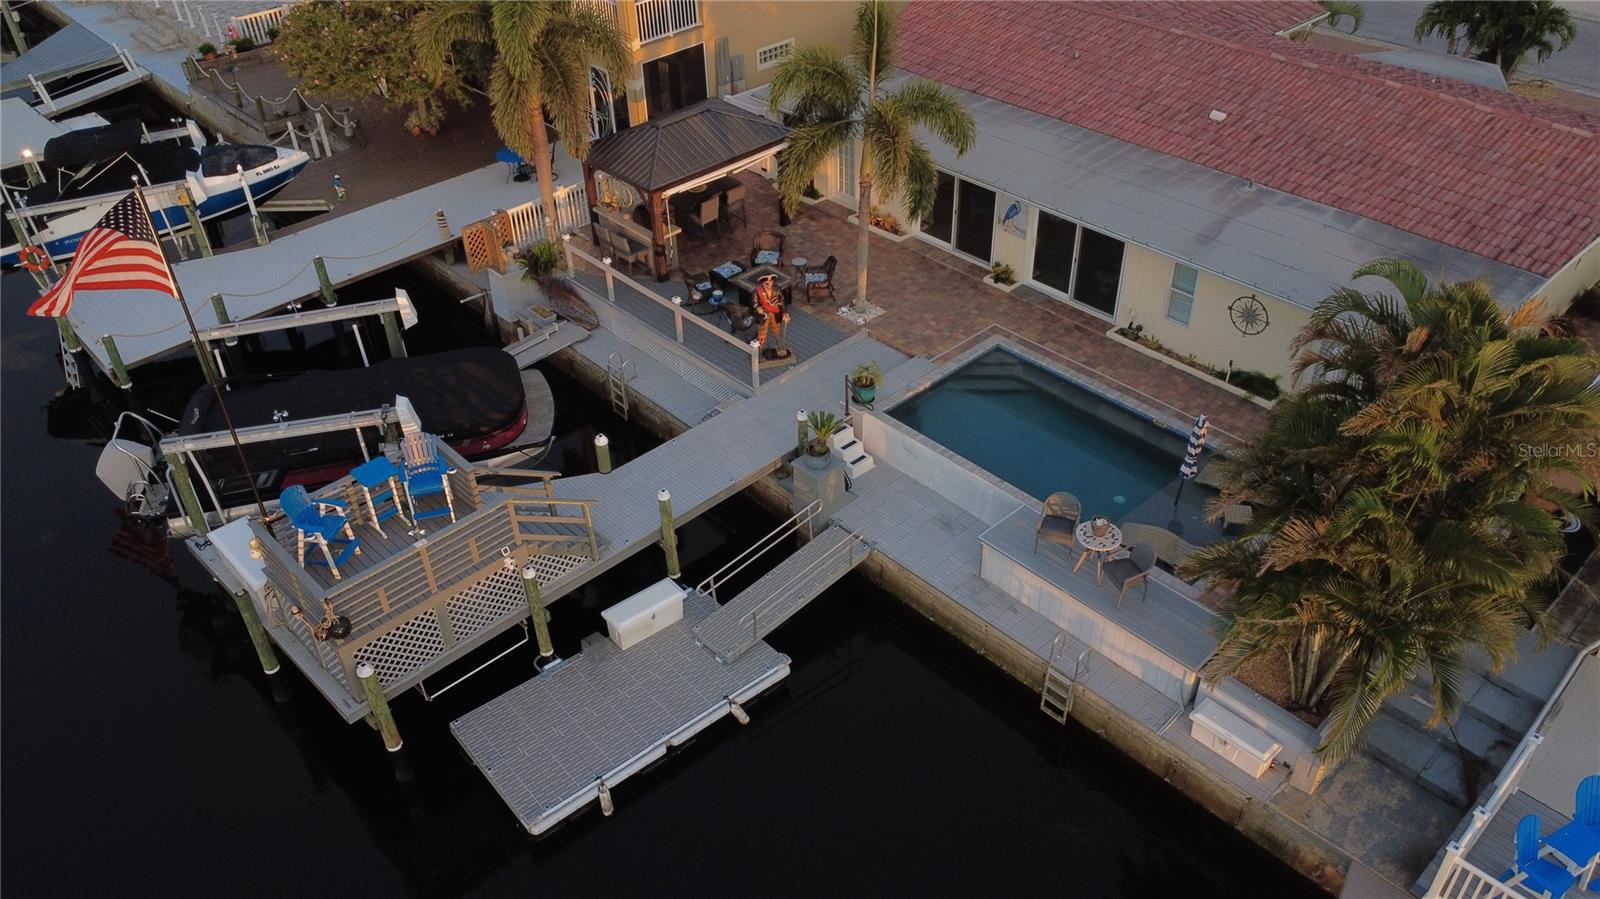
Waterfront Luxury is calling you! Lets Gulf! Live the lifestyle you have been dreaming of. This one checks all the boxes—and more. Quietly tucked away on a cul-de-sac / dead end with minimal traffic & peaceful living! Paradise is calling in this 3-bedroom 2.5 bath salt water POOL home positioned directly on the deep, wide south channel of Gulf Harbors! (New Pool 2023 & it's gorgeous) Interior is impressive with an extra-large primary walk-in closet, brass finishes in the kitchen, granite, new cabinets, top-of-the-line disposal, & updated decor, new flooring, ceiling fans, spa bathrooms, plantation shutters, updated windows & sliders, brand new kitchen with stainless steel GE appliance package! (all of the fine furnishings convey, including washer & dryer) HVAC 2019, Water heater 2025, Pool = 2023, years remaining on the clay tile roof. Flat roof replaced in 2020. Home had flood damage from the 2024 Hurricane Helene & has been completely remediated & remodeled to comply with county code & all work is fully permitted and closed! Nothing to do except move in. Every detail of the property has been impeccably updated! Fine finishes and upscale furnishings (included in the sale) have been hand-picked to create a “high-end coastal vibe” that matches the impeccable outdoor entertaining/living space where your family and friends will bask & enjoy a truly remarkable tropical paradise. Minimal yard care with this professionally paved front yard, adding to the Mediterranean ambiance/curb appeal & clay tile roof! Boasting ample parking space for guests! Outdoor living space includes: Covered tik for cooking on the BULL gas grill + table/chairs for gathering,+ new outdoor fridge. The evening lighting is spot on! - Stationary Dock, Floating Dock + Boat lift provide the space needed for all of your watercraft! Dock & deck made from top-of-the-line composite construction that lasts forever! (low maintenance) Situated on the south channel of Gulf Harbors, where the water is deep and the channel is wide to accommodate large vessels, including sailboats! Extra-large covered dock storage boxes included + extra space for kayaks and paddleboards! Electric + water at the dock! Cranes Roost seating to watch the sunsets from a raised level = amazing feature! Adirondack chairs (hand-made) are included! * furnished with Tommy Bahama + Arnold Palmer + high end wall decor. It's all included ! Firepit + coastal seating for entertaining. Salt water Pool with lounging pad. This home boasts a 5-star outdoor living space that will deliver resort/paradise experiences for you and your guests, coupled with sunsets that humble the soul! This one is worth your time to tour! You will not be disappointed touring this beauty on Shell Stream! The VIAGGIO boat is for sale! This home delivers on quality of work + waterfront location, + exceptional outdoor living space! Community offers 2 boat ramps + a private beach (optional to join) and a local YACHT club (optional to join)
Build Your Team
Quickly find investor-friendly professionals who can help you succeed in real estate investing at any stage of the investing journey.


Agents
Match with investor-friendly agents who can help you find, analyze, and close your next deal


Lenders
Get the best funding…find investor-friendly lenders who specialize in your deal strategy


Property Managers
Transition to passive investing. Find a trusted property management partnership that lasts.


Tax Pros & Accountants
Taxes and financial reporting made easy—find experts to create tax savings strategies, file taxes, and more
Location
Property Details
Parking
- Description: Garage
- Details: Circular Driveway, Driveway, Garage Door Opener, Parking Pad, Workshop in Garage, Attached
- Garage Spaces: 1
- Spaces Total: 0
Bedroom Information
- # of Bedrooms: 3
Bathroom Information
- # of Baths (Full): 2
- # of Baths (Total): 3.0
Interior Features
- # of Rooms: 4
- # of Stories: 1
Exterior Features
- Exterior Walls Materials: Concrete Block
- Foundation: Slab
- Roof Type: Gable
- Roof Material: Tile
- Pool: Yes
HOA
- Association: Gulf Harbors Civic Association
Land Information
- Land Use: Residential
- Land Use Subtype: Single Family Residential
Lot Information
- Parcel ID: 182616038A001000350
- Lot Size: 5610 sqft
Property Information
- Property Type: Single Family Residence
- Year Built: 1963
Tax Information
- Annual Tax: $8,286
Utilities
- Water & Sewer: Public
- Heating: Central
- Cooling: Central Air
Location
- County: Pasco
Listing Details
Investment Summary
- Monthly Cash Flow
- -$2,605
- Cap Rate
- 2.7%
- Cash-on-Cash Return
- -15.1%
- Debt Coverage Ratio
- 0.43
- Internal Rate of Return (5 years)
- -10.6%
Cash Flow
Net Operating Income (NOI) minus mortgage payments.
Calculation:
NOI - Mortgage Payments
Cap Rate (Market Value)
Capitalization Rate is a rate of return that compares the yearly Net Operating Income (NOI) to the market value.
Calculation:
NOI / Market Value
Cash-on-Cash Return (CoC)
Annual Cash Flow / Cash Invested
Calculation:
Annual cash flow divided by initial cash invested.
Debt Coverage Ratio (DCR)
Net Operating Income (NOI) divided by total debt payments.
Calculation:
NOI / Total Debt Payments
Internal Rate of Return (IRR)
A metric for assessing profitability over time. IRR is the discount rate at which the net present value (NPV) of all future cash flows (positive and negative) from an investment equals zero — including both periodic cash flow (such as rent) and a projected sale at the end of the holding period. It represents the expected annualized return, accounting for income, expenses, and the recovery of capital through a future sale.
Purchase Details
Purchase PriceThe price paid for the property. Purchase price:
| $899,000 |
|---|---|
Amount FinancedThe amount of the purchase financed through a loan. Amount financed:
| -$719,200 |
Down paymentThe initial payment made towards the purchase. Down payment:
| $179,800 |
Closing CostsFees and expenses associated with purchasing a property, typically ranging from 2% to 5% of the home’s purchase price, paid at the end of a home purchase to cover services like lending, title transfer, and taxes. Closing costs:
| $26,970 |
Rehab CostsCosts incurred to repair or improve the property, including: roof, flooring, exterior siding, kitchen, exterior paint, bathrooms, etc. Rehab costs:
| $0 |
Initial Cash InvestedThe total initial cash invested in the property. Calculation:Down payment + Buying costs + Rehab costs Initial cash invested:
| $206,770 |
Square Feet (SQFT)The total square footage of the property. Square feet:
| 1,828 |
Cost Per Square FootCost per square foot of the property. Calculation:Purchase Price / Square Feet Cost per square foot:
| $492 |
Monthly Rent Per Square FootMonthly rent divided by the number of square feet. This ratio helps investors compare rental income efficiency across properties, markets, and unit sizes Calculation:Monthly Rent / Square Feet Monthly rent per square foot:
| $2.13 |
Financing Details
Loan AmountThe total sum of money borrowed from a lender to finance a property purchase. Calculation:Purchase Price - Down Payment
Loan amount:
| $719,200 |
|---|---|
Loan to Value Ratio (LTV)Loan amount divided by the market value of the property. Calculation:Loan Amount / Market Value
Loan to value ratio:
| 80.0% |
Loan TypeThe type of loan (e.g., fixed, adjustable).
Loan type:
| Amortizing |
TermThe loan repayment period in years.
Term:
| 30 years |
Interest RateThe percentage a lender charges on the borrowed amount of a loan, determining the cost of borrowing money.
Interest rate:
| 6.625% |
Principal & Interest (PI)The principal is the portion of the loan payment that reduces the loan balance. The interest is the lender's charge for borrowing money. Calculation:(P * r * (1 + r) ** n) / ((1 + r) ** n - 1) Where:
P = Loan amount (principal)
Principal & interest:
| $4,605 |
Property TaxesAnnual taxes levied by local governments on real estate properties. These taxes fund public services like schools, roads, and emergency services.
Property tax:
| $691 |
InsuranceThe costs for insurance coverage to protect against financial losses due to risks like fire, natural disasters, theft, liability, or tenant-related damages. Calculation:Assumes 7% of gross rental income, unless insurance rates are specified.
Insurance:
| $273 |
Private Mortgage Insurance (PMI)A fee that borrowers pay when they take out a conventional loan with a loan-to-value (LTV) ratio above 80%.
Private mortgage insurance (PMI):
| $0 |
Monthly PaymentThe fixed amount a borrower pays each month to repay a loan. It typically includes principal and interest (P&I) and may also cover property taxes, insurance, HOA fees, and PMI if escrowed. Monthly payment:
| $5,569 |
Operating Income
| % Rent | Monthly | Yearly | |
|---|---|---|---|
Gross RentThe total rental income received from tenants before deducting any expenses. Includes base rent, late fees, pet fees, parking fees, and other recurring charges.
Gross rent:
| $3,900 | $46,800 | |
Vacancy LossExpected loss of rent due to vacancies.
Vacancy loss:
(6%)
| 6% | -$234 | -$2,808 |
Operating IncomeGross rental income minus vacancy loss. Calculation:Gross rent - Vacancy loss
Operating income:
| $3,666 | $43,992 |
Operating Expenses
| % Rent | Monthly | Yearly | |
|---|---|---|---|
Property TaxesAnnual taxes levied by local governments on real estate properties. These taxes fund public services like schools, roads, and emergency services. | 18% | -$691 | -$8,287 |
InsuranceThe costs for insurance coverage to protect against financial losses due to risks like fire, natural disasters, theft, liability, or tenant-related damages. Calculation:Assumes 7% of gross rental income, unless insurance rates are specified. | 7% | -$273 | -$3,276 |
Property ManagementThe costs associated with hiring a property manager to handle the day-to-day operations of a rental property. Includes management fees, leasing fes, eviction fees, etc. Calculation:Assumes 8% of gross rental income. | 8% | -$312 | -$3,744 |
Repairs & MaintenanceOngoing costs for routine upkeep and minor fixes needed to keep a property in good working condition. Calculation:Assumes 5% of gross rental income. Varies by property age and condition. | 5% | -$195 | -$2,340 |
Capital ExpensesLarge, infrequent costs for major improvements or replacements, like a new roof, HVAC system, or appliances. Calculation:Assumes 5% of gross rental income. Varies by property age. | 5% | -$195 | -$2,340 |
HOA FeesRegular dues paid to a Homeowners Association for community maintenance, amenities, and management. Similar fees include: Condo Association Fees, Co-op Maintenance Fees, etc. | n/a | n/a | n/a |
Operating ExpensesRecurring costs required to maintain and manage a rental property, including property taxes, insurance, maintenance, repairs, utilities (if paid by the owner), property management fees, and other day-to-day expenses. Calculation:Insurance + Property Taxes + Property Management + Repairs & Maintenance + Capital Expenditures + HOA Fees | 43% | -$1,666 | -$19,987 |
Cash Flow
| Monthly | Yearly | |
|---|---|---|
Net Operating Income (NOI)The income generated from a property after deducting all operating expenses but before deducting mortgage payments, taxes, and capital expenditures. Calculation:Gross Operating Income - Operating Expenses
Net operating income:
| $2,000 | $24,000 |
Mortgage PaymentThe fixed amount a borrower pays each month to repay a loan. It typically includes principal and interest (P&I) and may also cover property taxes, insurance, HOA fees, and PMI if escrowed. | -$4,605 | -$55,260 |
Cash FlowNet Operating Income (NOI) minus mortgage payments. Calculation:NOI - Mortgage Payments | -$2,605 | -$31,260 |