$539,000
Investment Summary
- Monthly Cash Flow
- -$1,743
- Cap Rate
- 2.3%
- Cash-on-Cash Return
- -16.9%
- Debt Coverage Ratio
- 0.37
- Internal Rate of Return (5 years)
- -12.3%
Cash Flow
Net Operating Income (NOI) minus mortgage payments.
Calculation:
NOI - Mortgage Payments
Cap Rate (Market Value)
Capitalization Rate is a rate of return that compares the yearly Net Operating Income (NOI) to the market value.
Calculation:
NOI / Market Value
Cash-on-Cash Return (CoC)
Annual Cash Flow / Cash Invested
Calculation:
Annual cash flow divided by initial cash invested.
Debt Coverage Ratio (DCR)
Net Operating Income (NOI) divided by total debt payments.
Calculation:
NOI / Total Debt Payments
Internal Rate of Return (IRR)
A metric for assessing profitability over time. IRR is the discount rate at which the net present value (NPV) of all future cash flows (positive and negative) from an investment equals zero — including both periodic cash flow (such as rent) and a projected sale at the end of the holding period. It represents the expected annualized return, accounting for income, expenses, and the recovery of capital through a future sale.
Property Description
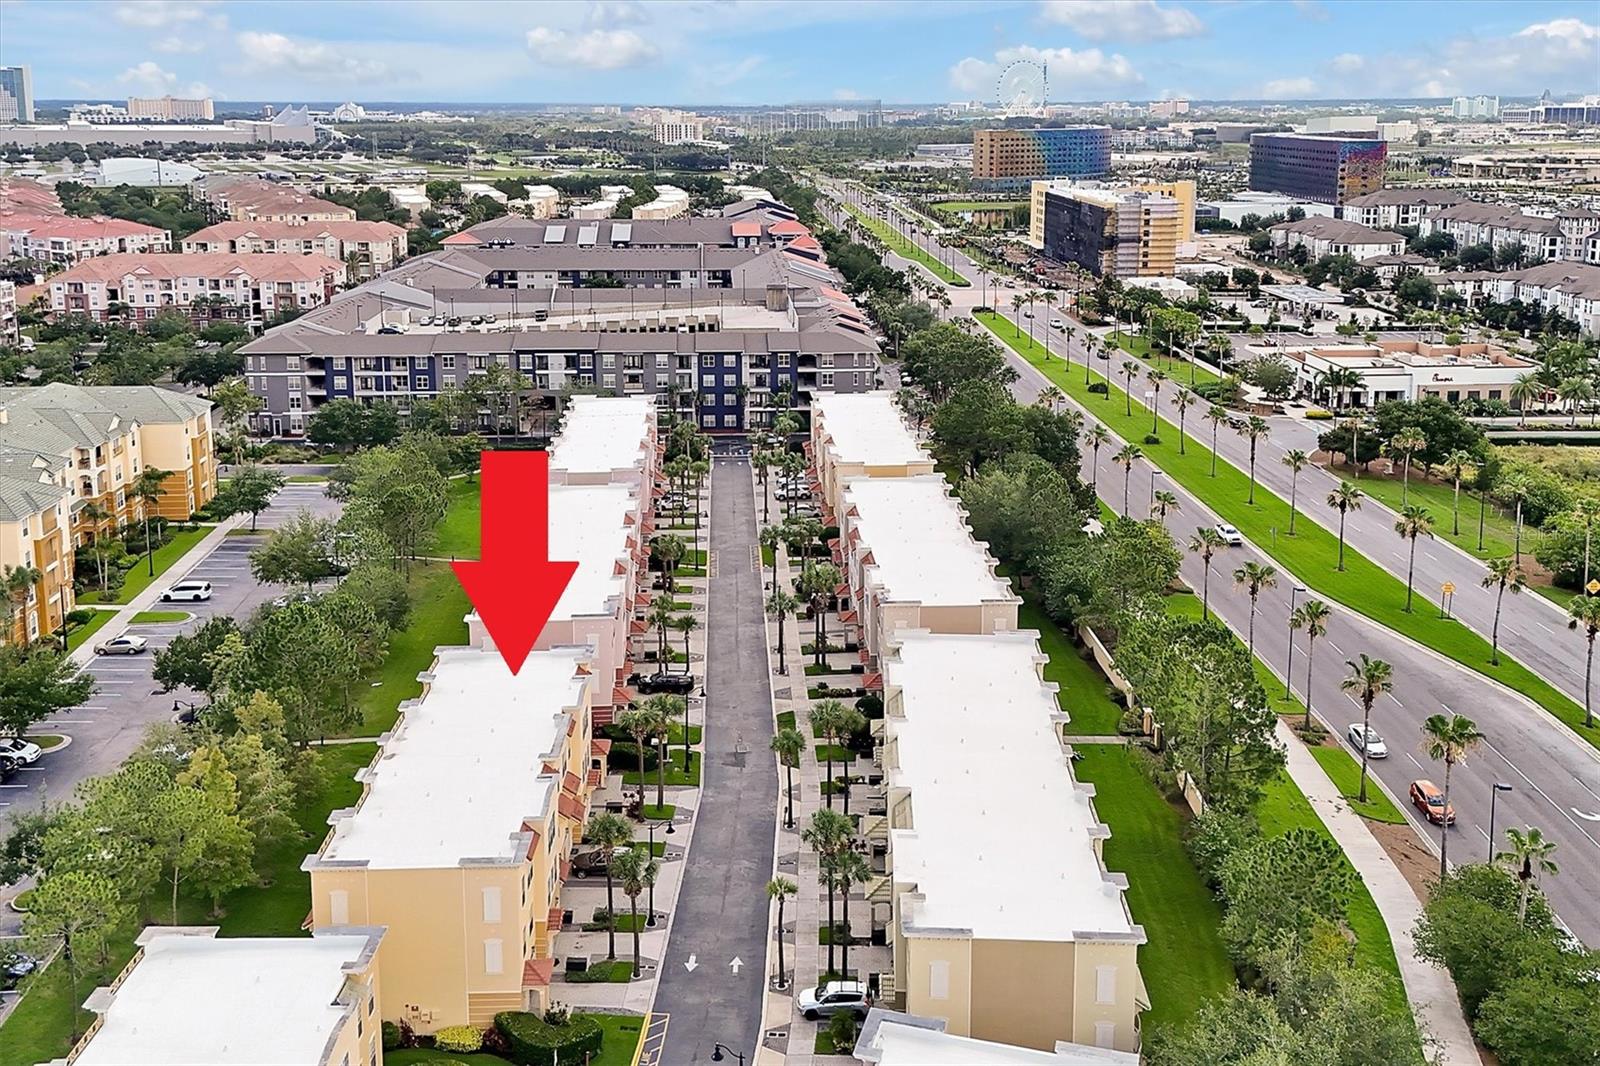
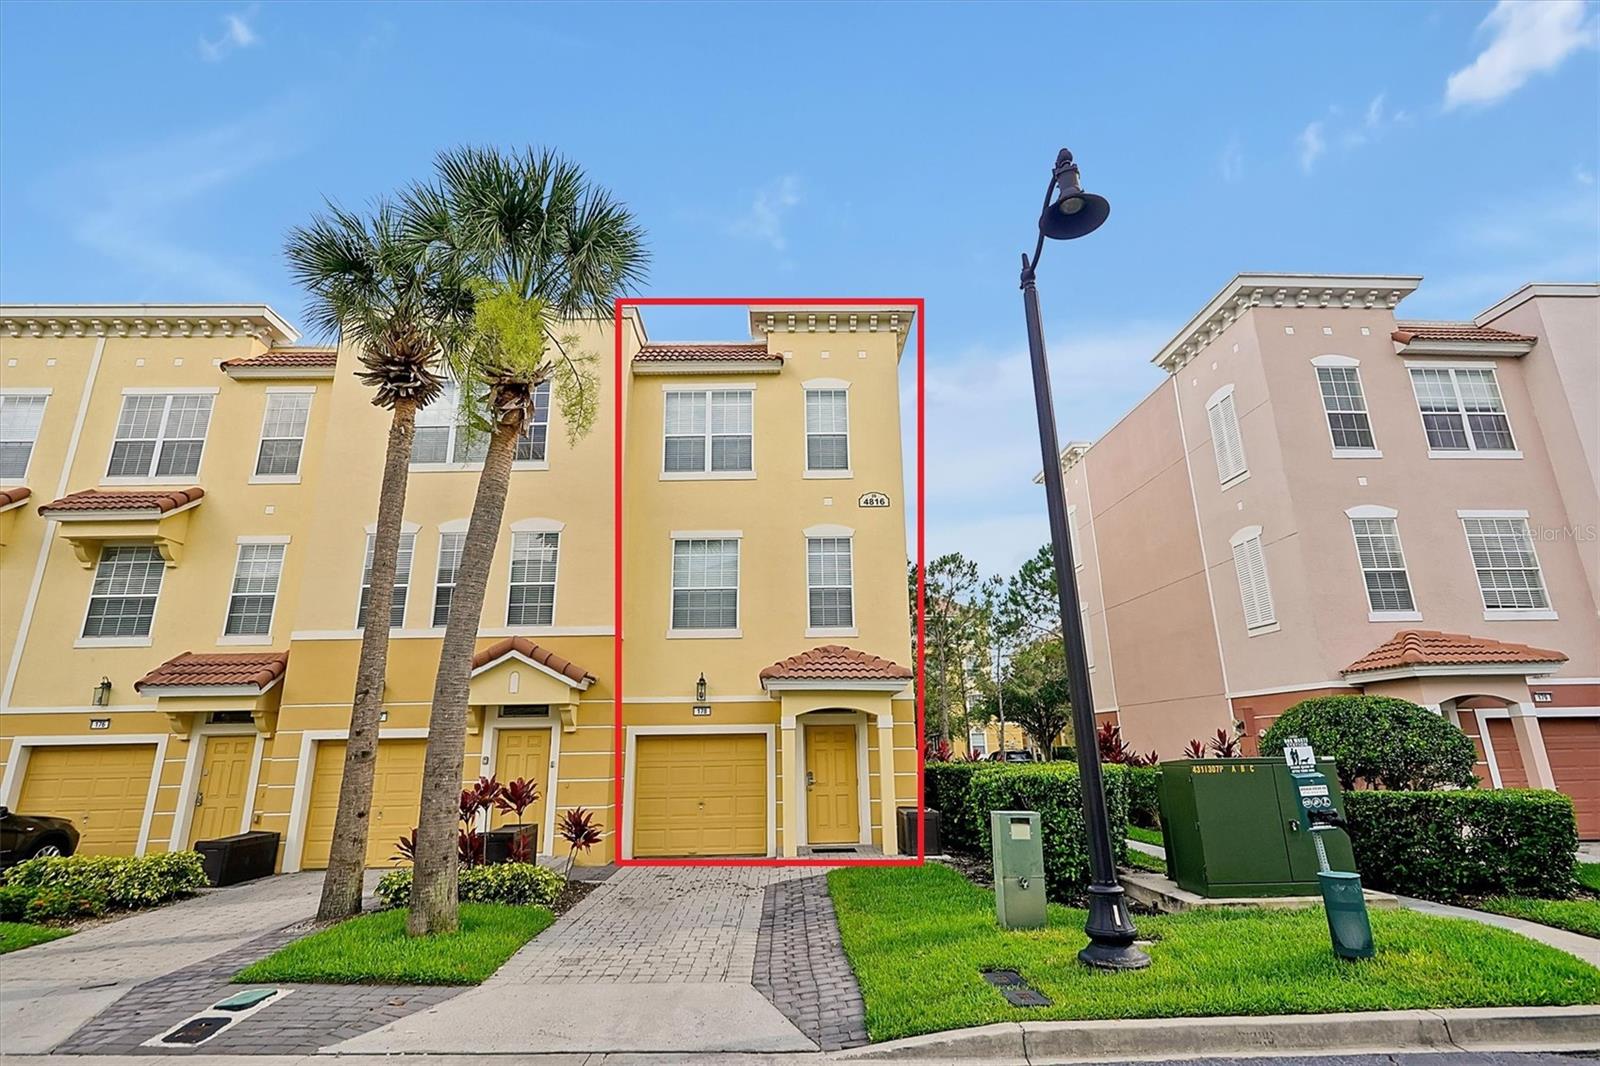
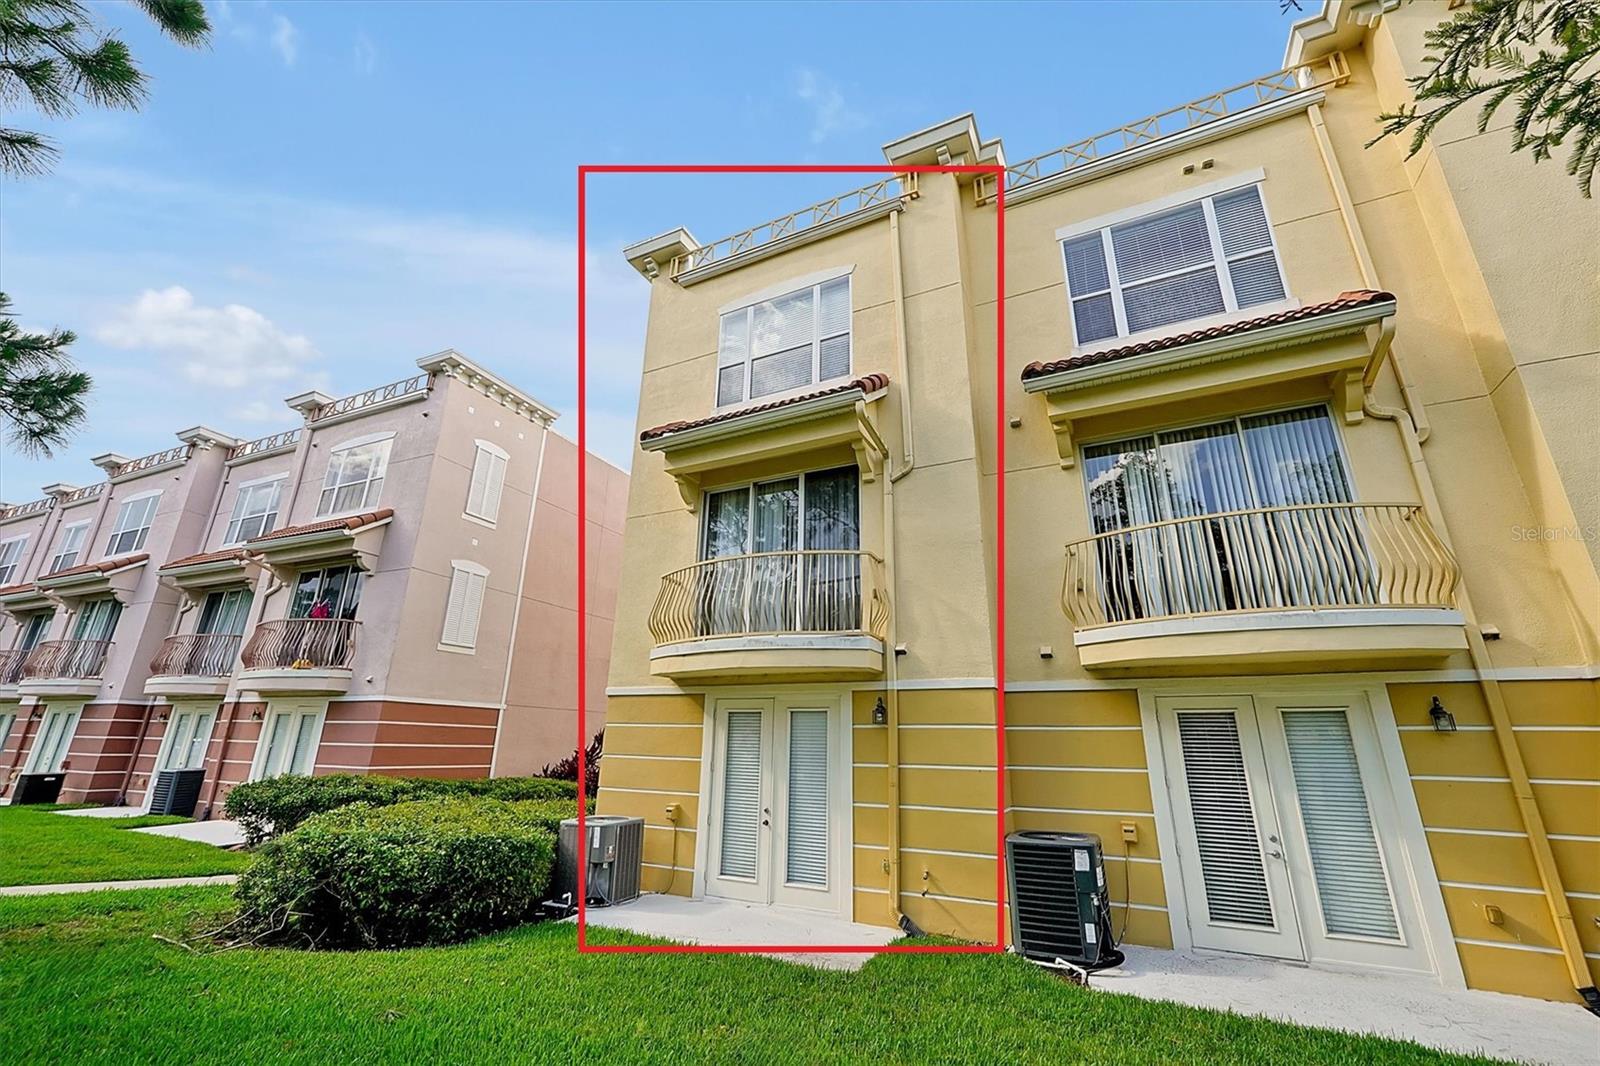
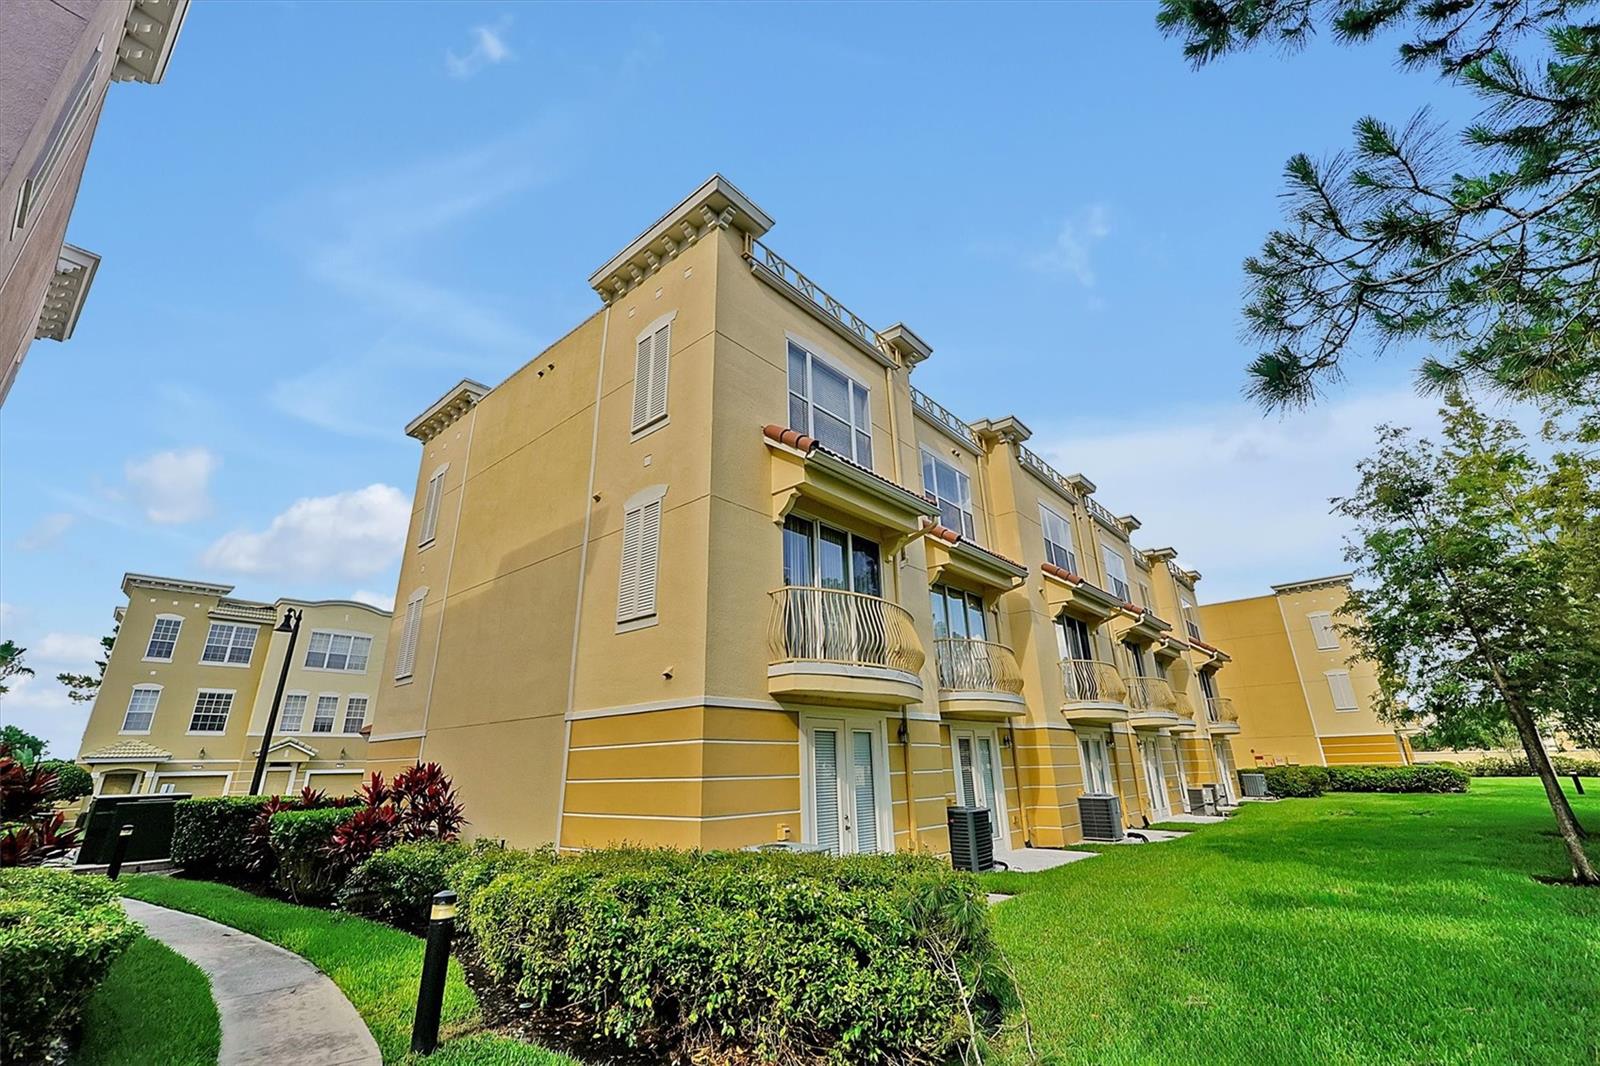
Investor’s Dream in Orlando’s Premier Airbnb Community – Fully Furnished, Short-Term Rental Approved Townhome Across from Epic Universe Attraction Park! Accepted offer pending, but taking backup offers. This fully furnished 3-bedroom, 3.5-bathroom CORNER UNIT townhome is turn-key ready and located in one of the only communities in Orange County zoned for short-term rentals, making it an exceptional investment opportunity and an ideal income-generating property through platforms like Airbnb and VRBO. Situated just across from the brand-new EPIC Universe Theme Park (now open as of May 2025!) and minutes from the Orlando Convention Center, International Drive, SeaWorld, Millenia Mall, Dr Phillips area, Disney Parks and Orlando International Airport—this property places business and leisure travelers right in the heart of the action. Inside this beautiful three-story home enjoy the benefits of new luxury vinyl plank floors (installed December 2024), new roof (replaced June 2022), newer AC (installed 2/2019) and modern décor curated by a professional designer. With a direct-entry one-car garage, each of the three en-suite bedrooms offers privacy and style—including a ground-floor suite with French doors that open to a cozy outdoor patio. The second floor's open-concept layout features 9' ceilings and an abundance of natural light and a balcony, connecting the gourmet kitchen, breakfast nook, formal dining area, and spacious living room—perfect for both relaxation and entertaining. Two additional en-suites on the third floor provide space and comfort for guests or long-term tenants. Vista Cay's top-tier resort amenities include: • Three resort-style pools (including a newly renovated main pool, kids bucket/slide water feature and expanded spa) • Two full-service poolside bars • Beautifully maintained landscaping within a gated community. • A 2-mile scenic lakefront walking trail • Full basketball court, playground, shaded picnic areas • Fitness center, movie theater, game room, and clubhouse • HOA includes internet, cable, trash and access to all amenities! With no minimum lease restrictions, this property offers flexibility for daily, weekly, monthly, or annual rentals and also can be used as residence. Whether you choose to manage it yourself or partner with a property manager, the proven track record of strong rental income and rising demand—especially with the recent launch of Epic Universe—makes this a highly lucrative and low-maintenance investment. All future bookings can be transferred to new owner if using same property management. Seeking your next profitable asset, this Vista Cay townhome checks all the boxes. Make your appointment now! Don’t miss your chance to own a prime piece of Orlando real estate!
Build Your Team
Quickly find investor-friendly professionals who can help you succeed in real estate investing at any stage of the investing journey.


Agents
Match with investor-friendly agents who can help you find, analyze, and close your next deal


Lenders
Get the best funding…find investor-friendly lenders who specialize in your deal strategy


Property Managers
Transition to passive investing. Find a trusted property management partnership that lasts.


Tax Pros & Accountants
Taxes and financial reporting made easy—find experts to create tax savings strategies, file taxes, and more
Location
Property Details
Parking
- Description: Garage
- Details: Attached
- Garage Spaces: 1
- Spaces Total: 0
Bedroom Information
- # of Bedrooms: 3
Bathroom Information
- # of Baths (Full): 3
- # of Baths (Partial): 1
- # of Baths (Total): 4.0
Interior Features
- # of Rooms: 6
- # of Stories: 3
Exterior Features
- Exterior Walls Materials: Concrete Block
- Foundation: Slab
- Roof Material: Other
HOA
- Has HOA: Yes
- Association: Optimum Community Management
- HOA Fee: $1,635/quarterly
- Additional Association: Vista Cay at Harbor Square Master HOA
Land Information
- Land Use: Residential
- Land Use Subtype: Condominium Unit
Lot Information
- Parcel ID: 062429013726178
- Lot Size: 698 sqft
Property Information
- Property Type: Townhouse
- Year Built: 2007
Tax Information
- Annual Tax: $5,258
Utilities
- Water & Sewer: Public
- Heating: Central, Electric
- Cooling: Central Air
Location
- County: Orange
Listing Details
Investment Summary
- Monthly Cash Flow
- -$1,743
- Cap Rate
- 2.3%
- Cash-on-Cash Return
- -16.9%
- Debt Coverage Ratio
- 0.37
- Internal Rate of Return (5 years)
- -12.3%
Cash Flow
Net Operating Income (NOI) minus mortgage payments.
Calculation:
NOI - Mortgage Payments
Cap Rate (Market Value)
Capitalization Rate is a rate of return that compares the yearly Net Operating Income (NOI) to the market value.
Calculation:
NOI / Market Value
Cash-on-Cash Return (CoC)
Annual Cash Flow / Cash Invested
Calculation:
Annual cash flow divided by initial cash invested.
Debt Coverage Ratio (DCR)
Net Operating Income (NOI) divided by total debt payments.
Calculation:
NOI / Total Debt Payments
Internal Rate of Return (IRR)
A metric for assessing profitability over time. IRR is the discount rate at which the net present value (NPV) of all future cash flows (positive and negative) from an investment equals zero — including both periodic cash flow (such as rent) and a projected sale at the end of the holding period. It represents the expected annualized return, accounting for income, expenses, and the recovery of capital through a future sale.
Purchase Details
Purchase PriceThe price paid for the property. Purchase price:
| $539,000 |
|---|---|
Amount FinancedThe amount of the purchase financed through a loan. Amount financed:
| -$431,200 |
Down paymentThe initial payment made towards the purchase. Down payment:
| $107,800 |
Closing CostsFees and expenses associated with purchasing a property, typically ranging from 2% to 5% of the home’s purchase price, paid at the end of a home purchase to cover services like lending, title transfer, and taxes. Closing costs:
| $16,170 |
Rehab CostsCosts incurred to repair or improve the property, including: roof, flooring, exterior siding, kitchen, exterior paint, bathrooms, etc. Rehab costs:
| $0 |
Initial Cash InvestedThe total initial cash invested in the property. Calculation:Down payment + Buying costs + Rehab costs Initial cash invested:
| $123,970 |
Square Feet (SQFT)The total square footage of the property. Square feet:
| 1,771 |
Cost Per Square FootCost per square foot of the property. Calculation:Purchase Price / Square Feet Cost per square foot:
| $304 |
Monthly Rent Per Square FootMonthly rent divided by the number of square feet. This ratio helps investors compare rental income efficiency across properties, markets, and unit sizes Calculation:Monthly Rent / Square Feet Monthly rent per square foot:
| $1.64 |
Financing Details
Loan AmountThe total sum of money borrowed from a lender to finance a property purchase. Calculation:Purchase Price - Down Payment
Loan amount:
| $431,200 |
|---|---|
Loan to Value Ratio (LTV)Loan amount divided by the market value of the property. Calculation:Loan Amount / Market Value
Loan to value ratio:
| 80.0% |
Loan TypeThe type of loan (e.g., fixed, adjustable).
Loan type:
| Amortizing |
TermThe loan repayment period in years.
Term:
| 30 years |
Interest RateThe percentage a lender charges on the borrowed amount of a loan, determining the cost of borrowing money.
Interest rate:
| 6.625% |
Principal & Interest (PI)The principal is the portion of the loan payment that reduces the loan balance. The interest is the lender's charge for borrowing money. Calculation:(P * r * (1 + r) ** n) / ((1 + r) ** n - 1) Where:
P = Loan amount (principal)
Principal & interest:
| $2,761 |
Property TaxesAnnual taxes levied by local governments on real estate properties. These taxes fund public services like schools, roads, and emergency services.
Property tax:
| $438 |
InsuranceThe costs for insurance coverage to protect against financial losses due to risks like fire, natural disasters, theft, liability, or tenant-related damages. Calculation:Assumes 7% of gross rental income, unless insurance rates are specified.
Insurance:
| $203 |
Private Mortgage Insurance (PMI)A fee that borrowers pay when they take out a conventional loan with a loan-to-value (LTV) ratio above 80%.
Private mortgage insurance (PMI):
| $0 |
Monthly PaymentThe fixed amount a borrower pays each month to repay a loan. It typically includes principal and interest (P&I) and may also cover property taxes, insurance, HOA fees, and PMI if escrowed. Monthly payment:
| $3,402 |
Operating Income
| % Rent | Monthly | Yearly | |
|---|---|---|---|
Gross RentThe total rental income received from tenants before deducting any expenses. Includes base rent, late fees, pet fees, parking fees, and other recurring charges.
Gross rent:
| $2,900 | $34,800 | |
Vacancy LossExpected loss of rent due to vacancies.
Vacancy loss:
(6%)
| 6% | -$174 | -$2,088 |
Operating IncomeGross rental income minus vacancy loss. Calculation:Gross rent - Vacancy loss
Operating income:
| $2,726 | $32,712 |
Operating Expenses
| % Rent | Monthly | Yearly | |
|---|---|---|---|
Property TaxesAnnual taxes levied by local governments on real estate properties. These taxes fund public services like schools, roads, and emergency services. | 15% | -$438 | -$5,259 |
InsuranceThe costs for insurance coverage to protect against financial losses due to risks like fire, natural disasters, theft, liability, or tenant-related damages. Calculation:Assumes 7% of gross rental income, unless insurance rates are specified. | 7% | -$203 | -$2,436 |
Property ManagementThe costs associated with hiring a property manager to handle the day-to-day operations of a rental property. Includes management fees, leasing fes, eviction fees, etc. Calculation:Assumes 8% of gross rental income. | 8% | -$232 | -$2,784 |
Repairs & MaintenanceOngoing costs for routine upkeep and minor fixes needed to keep a property in good working condition. Calculation:Assumes 5% of gross rental income. Varies by property age and condition. | 5% | -$145 | -$1,740 |
Capital ExpensesLarge, infrequent costs for major improvements or replacements, like a new roof, HVAC system, or appliances. Calculation:Assumes 5% of gross rental income. Varies by property age. | 5% | -$145 | -$1,740 |
HOA FeesRegular dues paid to a Homeowners Association for community maintenance, amenities, and management. Similar fees include: Condo Association Fees, Co-op Maintenance Fees, etc. | 19% | -$545 | -$6,540 |
Operating ExpensesRecurring costs required to maintain and manage a rental property, including property taxes, insurance, maintenance, repairs, utilities (if paid by the owner), property management fees, and other day-to-day expenses. Calculation:Insurance + Property Taxes + Property Management + Repairs & Maintenance + Capital Expenditures + HOA Fees | 59% | -$1,708 | -$20,499 |
Cash Flow
| Monthly | Yearly | |
|---|---|---|
Net Operating Income (NOI)The income generated from a property after deducting all operating expenses but before deducting mortgage payments, taxes, and capital expenditures. Calculation:Gross Operating Income - Operating Expenses
Net operating income:
| $1,018 | $12,216 |
Mortgage PaymentThe fixed amount a borrower pays each month to repay a loan. It typically includes principal and interest (P&I) and may also cover property taxes, insurance, HOA fees, and PMI if escrowed. | -$2,761 | -$33,132 |
Cash FlowNet Operating Income (NOI) minus mortgage payments. Calculation:NOI - Mortgage Payments | -$1,743 | -$20,916 |