
$734,900
Investment Summary
- Monthly Cash Flow
- -$1,803
- Cap Rate
- 3.2%
- Cash-on-Cash Return
- -12.8%
- Debt Coverage Ratio
- 0.52
- Internal Rate of Return (5 years)
- -8.4%
Cash Flow
Net Operating Income (NOI) minus mortgage payments.
Calculation:
NOI - Mortgage Payments
Cap Rate (Market Value)
Capitalization Rate is a rate of return that compares the yearly Net Operating Income (NOI) to the market value.
Calculation:
NOI / Market Value
Cash-on-Cash Return (CoC)
Annual Cash Flow / Cash Invested
Calculation:
Annual cash flow divided by initial cash invested.
Debt Coverage Ratio (DCR)
Net Operating Income (NOI) divided by total debt payments.
Calculation:
NOI / Total Debt Payments
Internal Rate of Return (IRR)
A metric for assessing profitability over time. IRR is the discount rate at which the net present value (NPV) of all future cash flows (positive and negative) from an investment equals zero — including both periodic cash flow (such as rent) and a projected sale at the end of the holding period. It represents the expected annualized return, accounting for income, expenses, and the recovery of capital through a future sale.
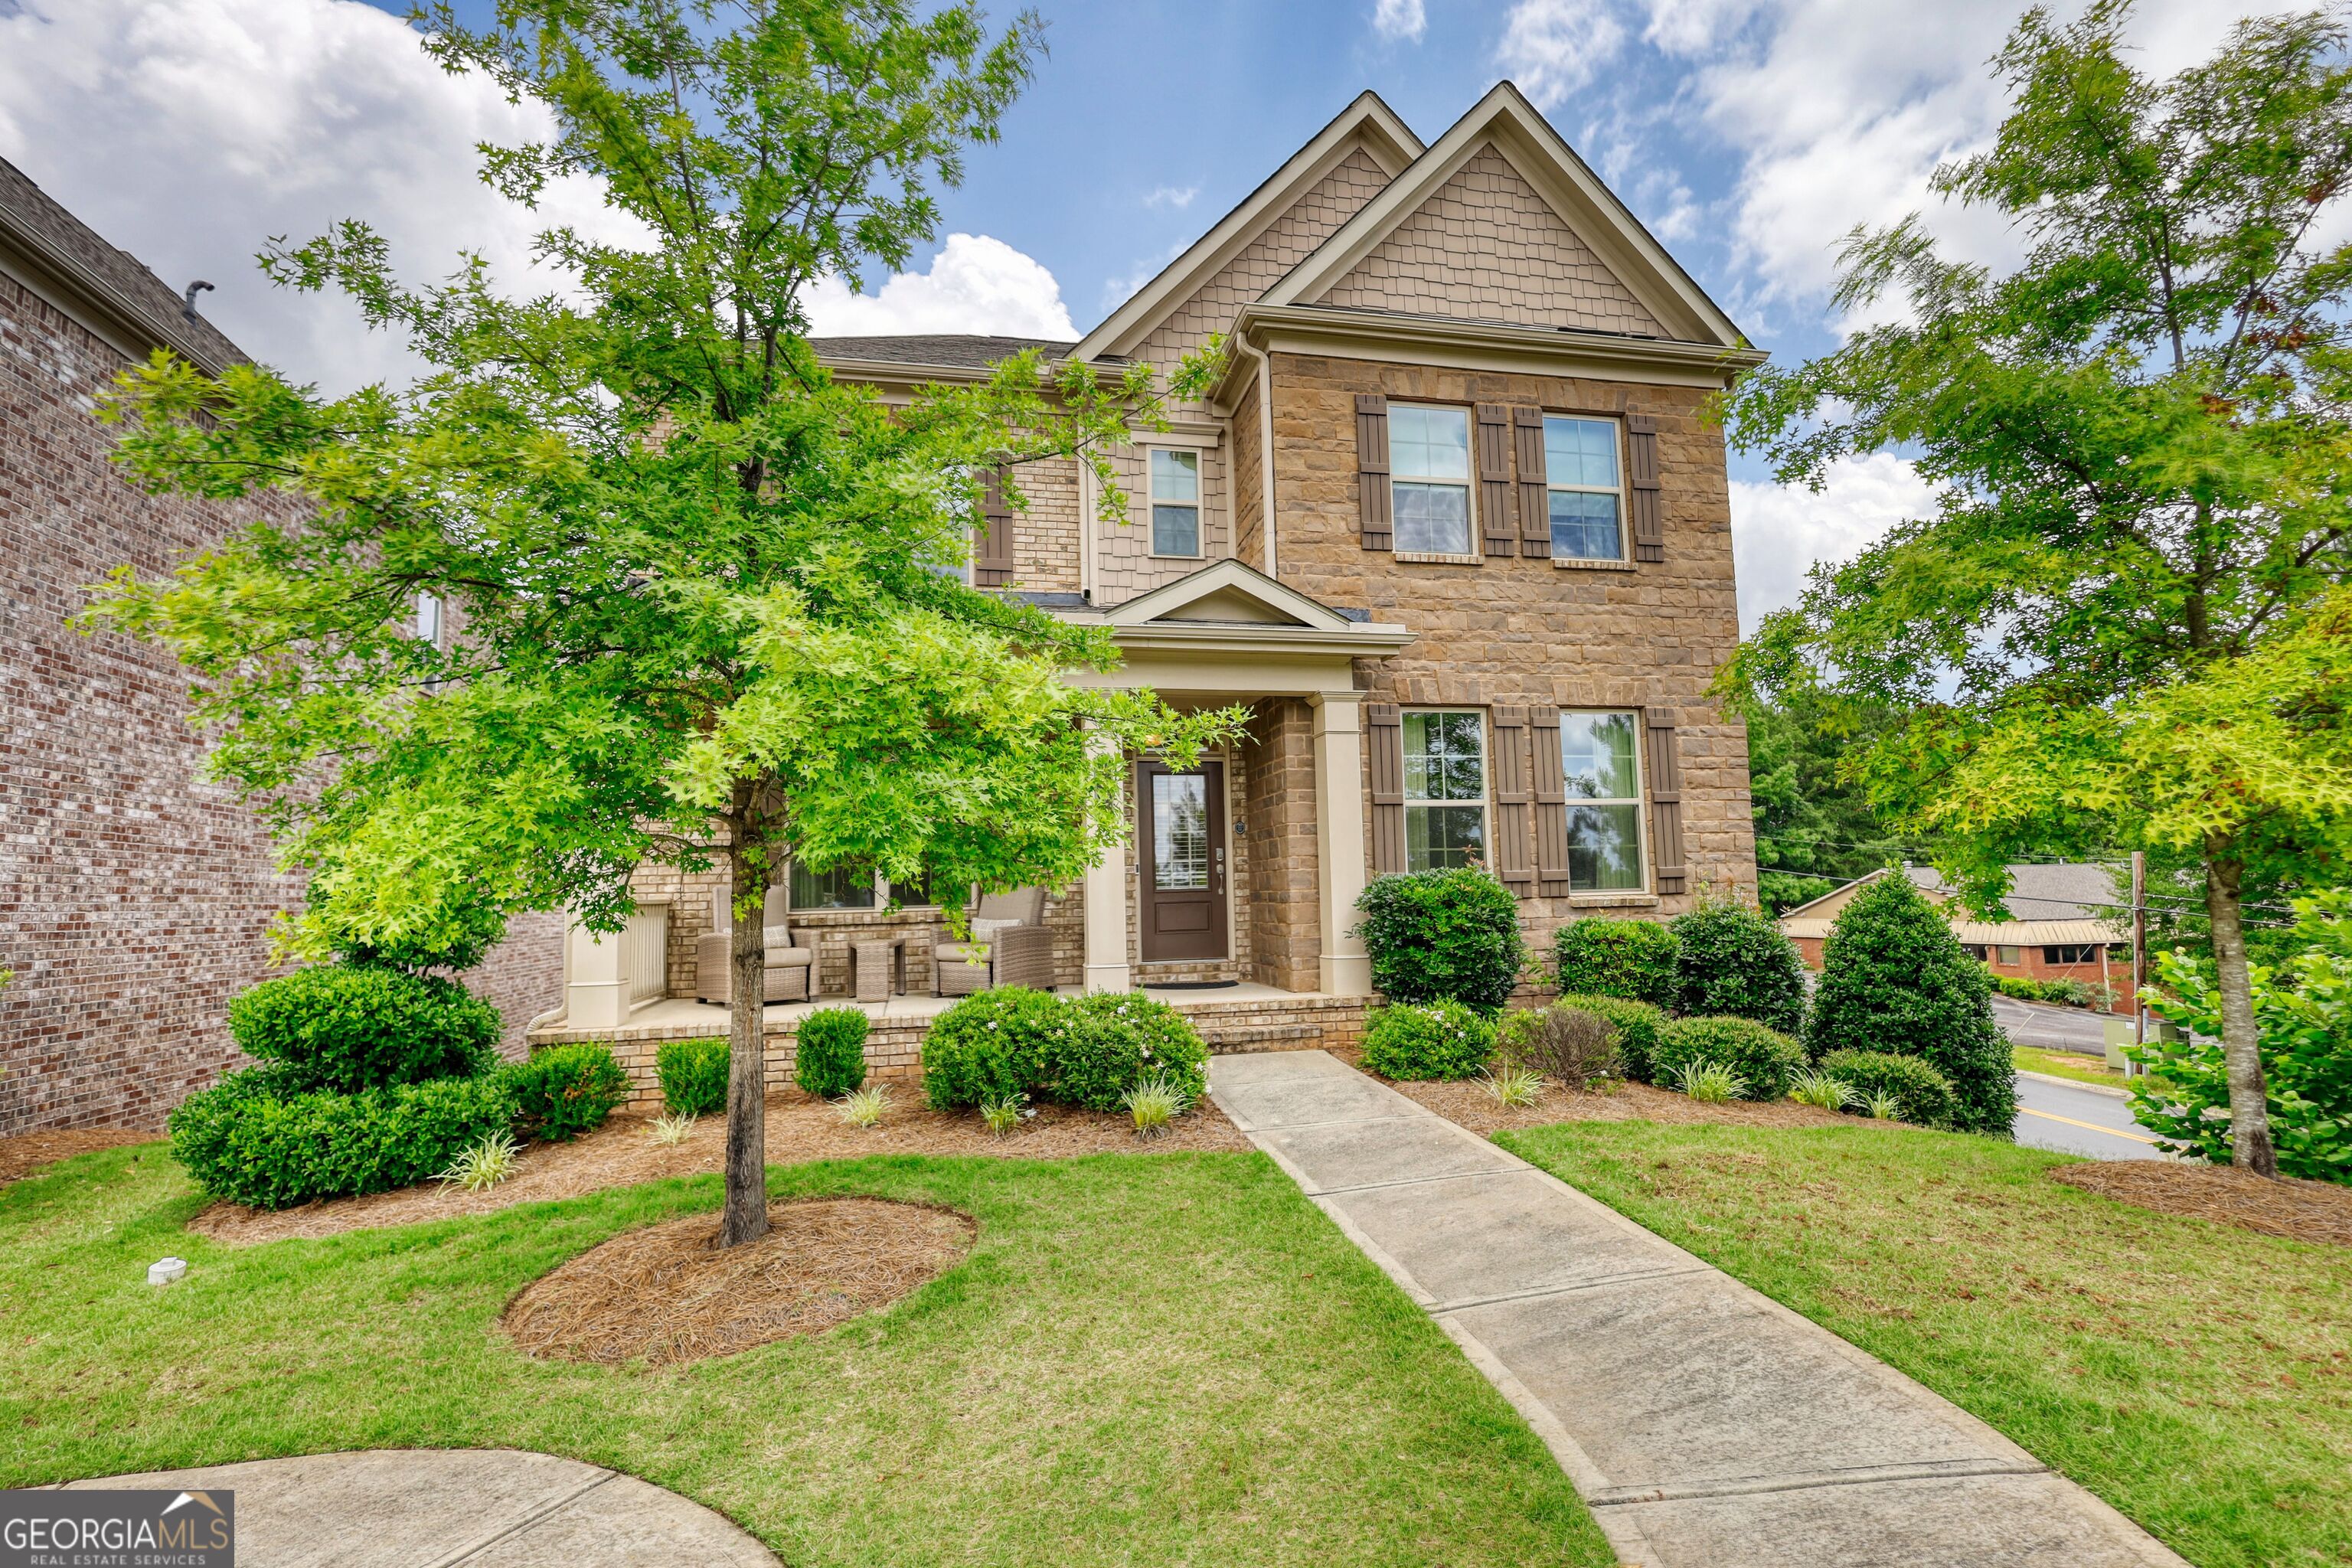
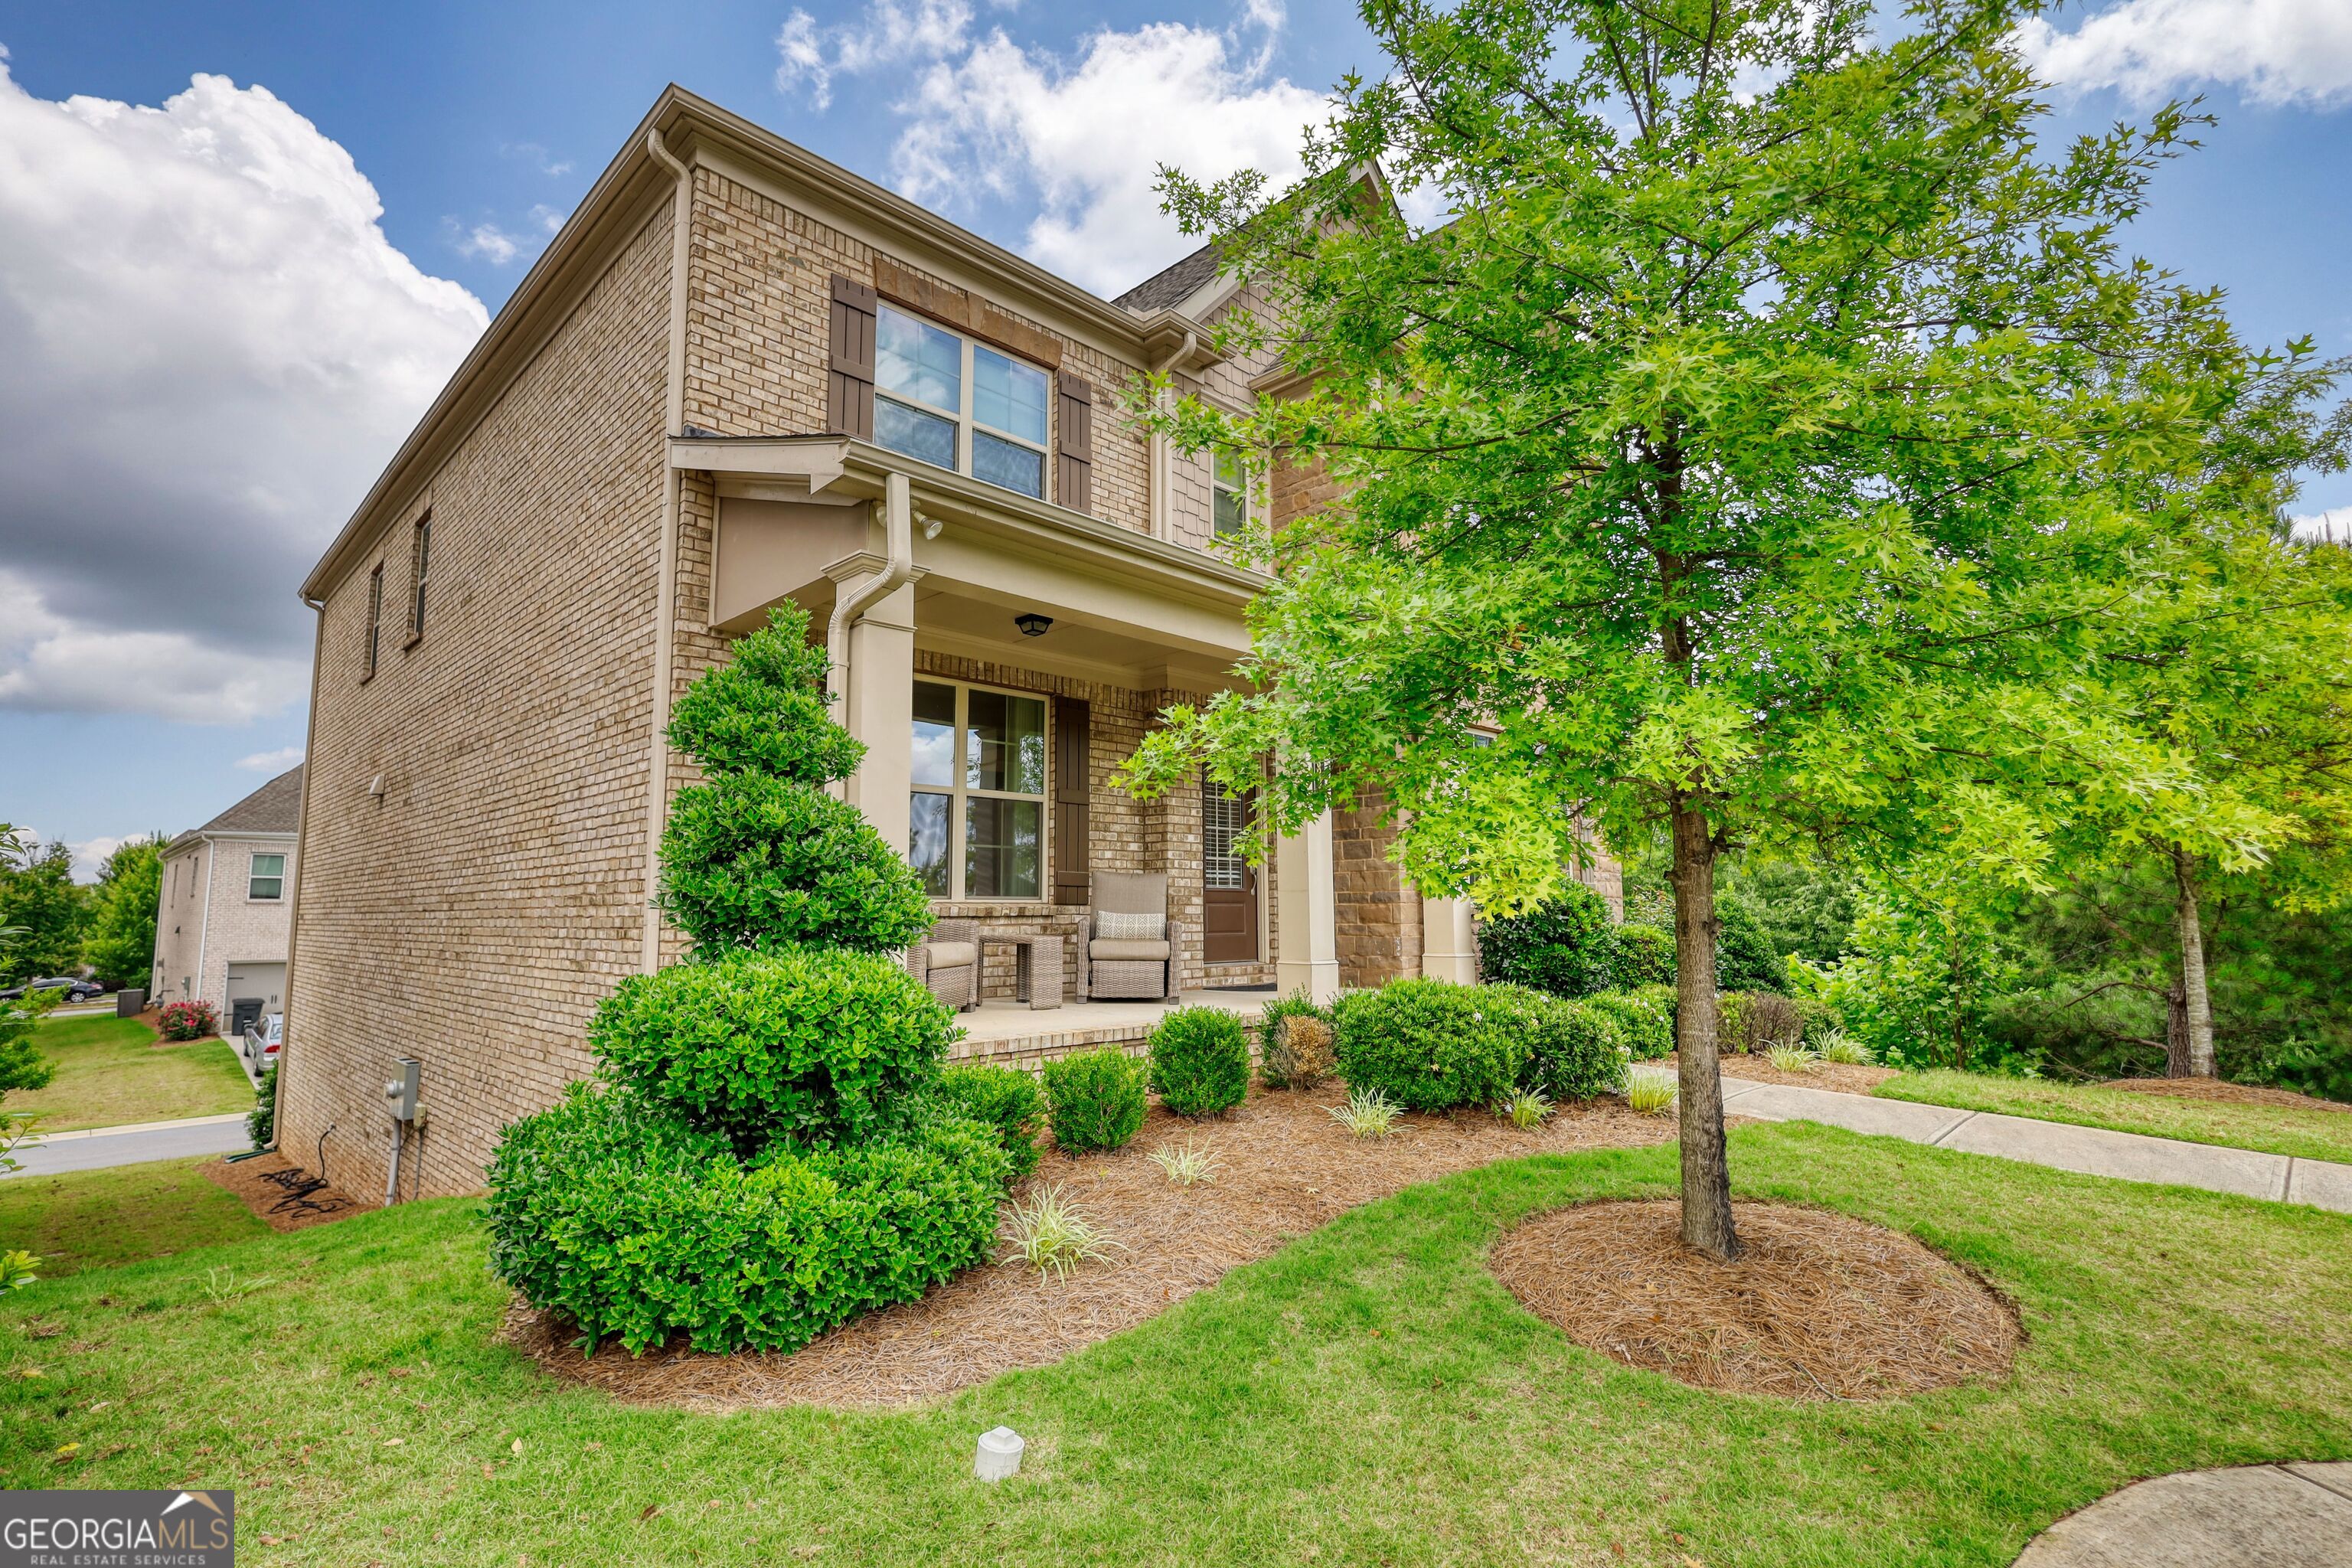
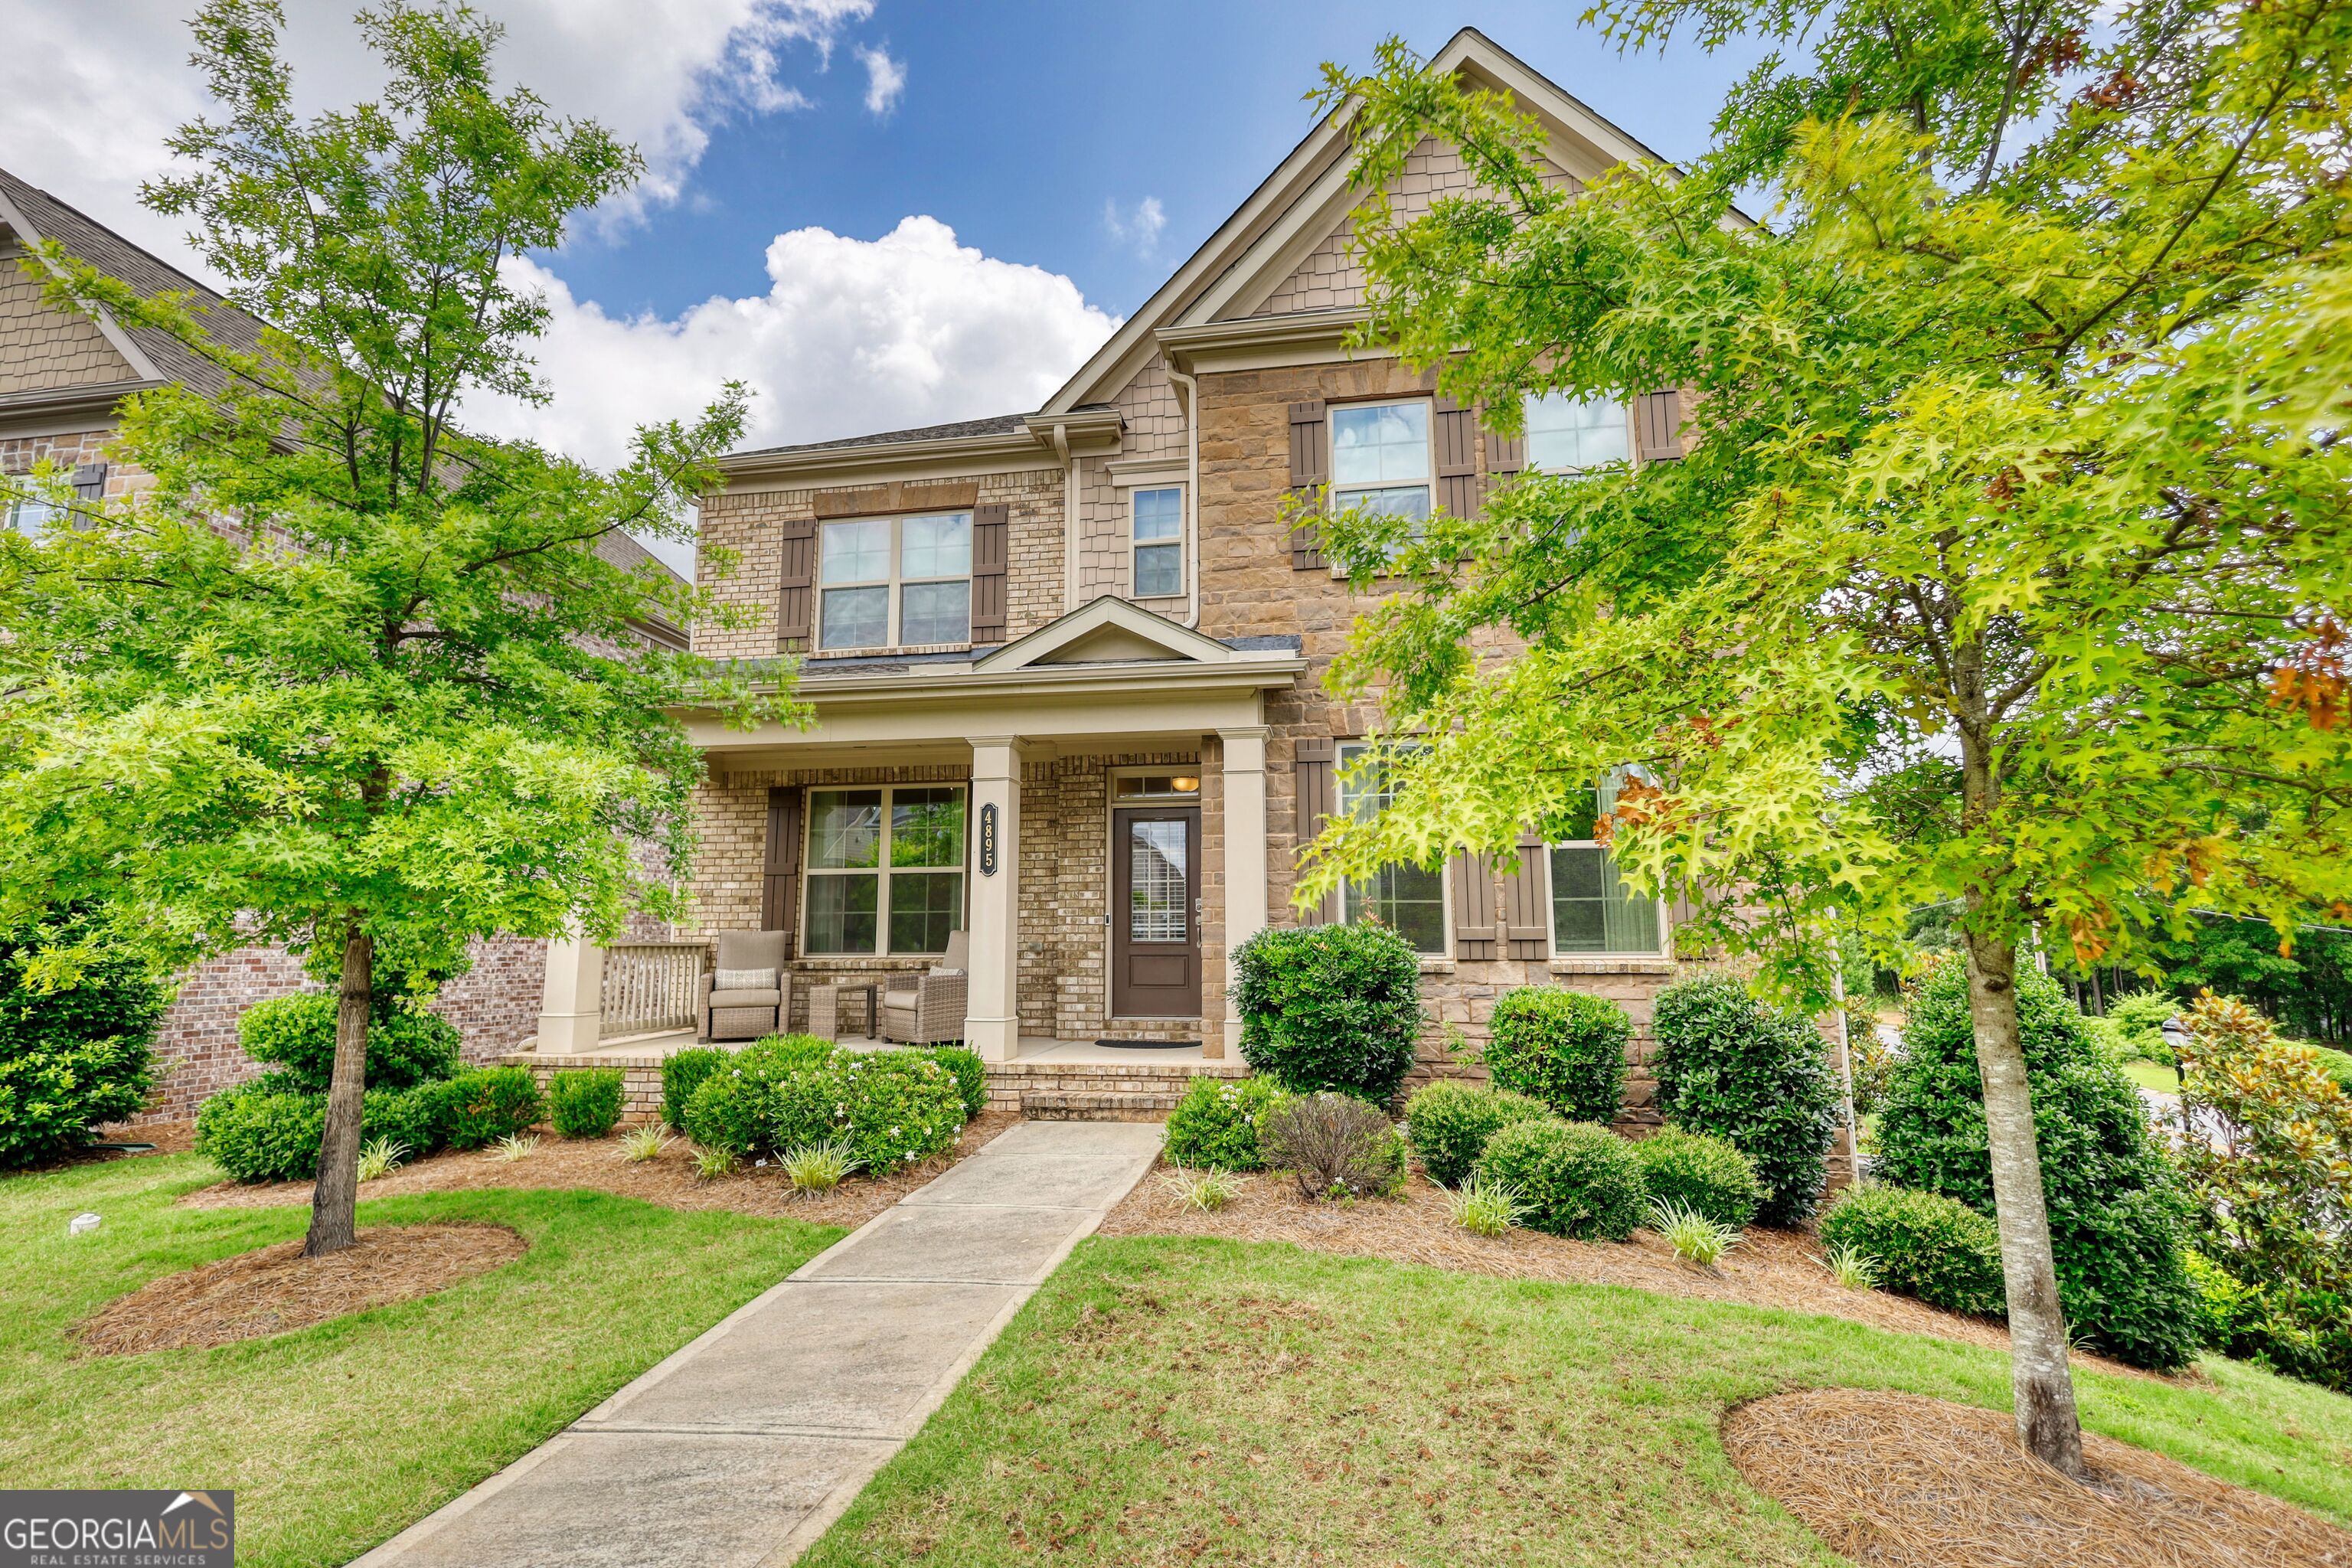
Property Description
Gorgeous Move In Ready Home! This beautiful home qualifies for a credit of up to 1% of the loan amount with preferred lender! Welcome to the Home That Has It All - In the #1 School District in the Nation! Prepare to fall in love the moment you arrive at this extraordinary corner-lot masterpiece nestled in the prestigious Buford City School District - now ranked the best in the country. Every inch of this home is a statement of elegance, comfort, and intentional luxury, with over $40,000 in high-end upgrades since 2022 - and not a single detail overlooked. From the moment you step inside, you're met with a sense of refined grandeur: Expansive open-concept living, rich engineered hardwoods throughout (yes - no carpet anywhere), and light pouring in from every angle. Host unforgettable holiday gatherings in the formal dining room, where elegance meets function. At the heart of the home? A show-stopping chef's kitchen worthy of a magazine cover - complete with gleaming stainless-steel appliances, crisp white cabinetry, a massive granite island, and a butler's pantry that elevates everyday living into a luxurious experience. The breakfast room seamlessly connects the kitchen to the living space, with plenty of room for a six-person table - all flowing into a designer-inspired family room featuring custom white built-ins topped with granite, and a beautiful fireplace, creating an atmosphere that's both welcoming and upscale. Step outside to your covered deck retreat, where the outdoor fireplace invites cozy mornings and wine-filled evenings overlooking peaceful, tree-lined views - a rare and tranquil extension of your living space. Downstairs also includes a private fifth bedroom or executive office, adjacent to a full bath with a custom tiled shower - perfect for multigenerational living, guests, or working from home in total comfort. Upstairs, discover your dream owner's suite - a serene sanctuary with spa-like vibes: * California-style ensuite with dual granite vanities * Oversized garden tub and glass-enclosed shower * A custom walk-in closet designed to make mornings effortless Three additional spacious bedrooms await, with a thoughtful Jack & Jill bath between two, and a private en-suite for the third - the ideal setup for teens, in-laws, or guests. The second floor includes a generously sized laundry room with abundant storage, making laundry day feel efficient, organized, and even enjoyable. And there's more... The daylight basement, already plumbed for a full bathroom, is your blank canvas: home theater, gym, game room, wine cellar - the possibilities are endless. The three-car garage features brand new epoxy floors, providing the polished, showroom-style finish that's the cherry on top. Why wait? Homes of this caliber in Buford's top school district don't stay on the market. Schedule your private showing today and experience what it feels like to truly come home - to luxury, location, and lifestyle in perfect harmony.
Build Your Team
Quickly find investor-friendly professionals who can help you succeed in real estate investing at any stage of the investing journey.


Agents
Match with investor-friendly agents who can help you find, analyze, and close your next deal


Lenders
Get the best funding…find investor-friendly lenders who specialize in your deal strategy


Property Managers
Transition to passive investing. Find a trusted property management partnership that lasts.


Tax Pros & Accountants
Taxes and financial reporting made easy—find experts to create tax savings strategies, file taxes, and more
Location
Property Details
Parking
- Description: Attached, Drive Under Main Level, Driveway, Garage, Garage Door Opener, Garage Faces Rear, Level Driveway
- Details: Attached, Basement, Garage, Garage Door Opener
- Garage Spaces: 6
- Spaces Total: 6
Bedroom Information
- # of Bedrooms: 5
Bathroom Information
- # of Baths (Full): 4
- # of Baths (Total): 4.0
Interior Features
- # of Rooms: 8
- # of Stories: 2
- Basement: Yes
- Basement Description: Bath/Stubbed, Exterior Entry, Interior Entry, Unfinished
- Fireplace: Yes
Exterior Features
- Exterior Walls Materials: Brick
- Roof Type: Gable or Hip
- Roof Material: Composition
HOA
- Has HOA: Yes
- Association: Fieldstone Association
- HOA Fee: $1,675/annually
Land Information
- Land Use: Residential
- Land Use Subtype: Single Family Residential
Lot Information
- Parcel ID: R7269122
- Lot Size: 0 sqft
Property Information
- Property Type: Single Family Residence
- Style: Brick 4 Side, Traditional
- Year Built: 2018
Tax Information
- Annual Tax: $3,760
Utilities
- Water & Sewer: Public
- Heating: Forced Air, Natural Gas, Zoned
- Cooling: Ceiling Fan(s), Central Air, Electric, Zoned
Location
- County: Gwinnett
Listing Details
Investment Summary
- Monthly Cash Flow
- -$1,803
- Cap Rate
- 3.2%
- Cash-on-Cash Return
- -12.8%
- Debt Coverage Ratio
- 0.52
- Internal Rate of Return (5 years)
- -8.4%
Cash Flow
Net Operating Income (NOI) minus mortgage payments.
Calculation:
NOI - Mortgage Payments
Cap Rate (Market Value)
Capitalization Rate is a rate of return that compares the yearly Net Operating Income (NOI) to the market value.
Calculation:
NOI / Market Value
Cash-on-Cash Return (CoC)
Annual Cash Flow / Cash Invested
Calculation:
Annual cash flow divided by initial cash invested.
Debt Coverage Ratio (DCR)
Net Operating Income (NOI) divided by total debt payments.
Calculation:
NOI / Total Debt Payments
Internal Rate of Return (IRR)
A metric for assessing profitability over time. IRR is the discount rate at which the net present value (NPV) of all future cash flows (positive and negative) from an investment equals zero — including both periodic cash flow (such as rent) and a projected sale at the end of the holding period. It represents the expected annualized return, accounting for income, expenses, and the recovery of capital through a future sale.
Purchase Details
Purchase PriceThe price paid for the property. Purchase price:
| $734,900 |
|---|---|
Amount FinancedThe amount of the purchase financed through a loan. Amount financed:
| -$587,920 |
Down paymentThe initial payment made towards the purchase. Down payment:
| $146,980 |
Closing CostsFees and expenses associated with purchasing a property, typically ranging from 2% to 5% of the home’s purchase price, paid at the end of a home purchase to cover services like lending, title transfer, and taxes. Closing costs:
| $22,047 |
Rehab CostsCosts incurred to repair or improve the property, including: roof, flooring, exterior siding, kitchen, exterior paint, bathrooms, etc. Rehab costs:
| $0 |
Initial Cash InvestedThe total initial cash invested in the property. Calculation:Down payment + Buying costs + Rehab costs Initial cash invested:
| $169,027 |
Square Feet (SQFT)The total square footage of the property. Square feet:
| 3,180 |
Cost Per Square FootCost per square foot of the property. Calculation:Purchase Price / Square Feet Cost per square foot:
| $231 |
Monthly Rent Per Square FootMonthly rent divided by the number of square feet. This ratio helps investors compare rental income efficiency across properties, markets, and unit sizes Calculation:Monthly Rent / Square Feet Monthly rent per square foot:
| $1.10 |
Financing Details
Loan AmountThe total sum of money borrowed from a lender to finance a property purchase. Calculation:Purchase Price - Down Payment
Loan amount:
| $587,920 |
|---|---|
Loan to Value Ratio (LTV)Loan amount divided by the market value of the property. Calculation:Loan Amount / Market Value
Loan to value ratio:
| 80.0% |
Loan TypeThe type of loan (e.g., fixed, adjustable).
Loan type:
| Amortizing |
TermThe loan repayment period in years.
Term:
| 30 years |
Interest RateThe percentage a lender charges on the borrowed amount of a loan, determining the cost of borrowing money.
Interest rate:
| 6.625% |
Principal & Interest (PI)The principal is the portion of the loan payment that reduces the loan balance. The interest is the lender's charge for borrowing money. Calculation:(P * r * (1 + r) ** n) / ((1 + r) ** n - 1) Where:
P = Loan amount (principal)
Principal & interest:
| $3,765 |
Property TaxesAnnual taxes levied by local governments on real estate properties. These taxes fund public services like schools, roads, and emergency services.
Property tax:
| $313 |
InsuranceThe costs for insurance coverage to protect against financial losses due to risks like fire, natural disasters, theft, liability, or tenant-related damages. Calculation:Assumes 7% of gross rental income, unless insurance rates are specified.
Insurance:
| $245 |
Private Mortgage Insurance (PMI)A fee that borrowers pay when they take out a conventional loan with a loan-to-value (LTV) ratio above 80%.
Private mortgage insurance (PMI):
| $0 |
Monthly PaymentThe fixed amount a borrower pays each month to repay a loan. It typically includes principal and interest (P&I) and may also cover property taxes, insurance, HOA fees, and PMI if escrowed. Monthly payment:
| $4,323 |
Operating Income
| % Rent | Monthly | Yearly | |
|---|---|---|---|
Gross RentThe total rental income received from tenants before deducting any expenses. Includes base rent, late fees, pet fees, parking fees, and other recurring charges.
Gross rent:
| $3,500 | $42,000 | |
Vacancy LossExpected loss of rent due to vacancies.
Vacancy loss:
(6%)
| 6% | -$210 | -$2,520 |
Operating IncomeGross rental income minus vacancy loss. Calculation:Gross rent - Vacancy loss
Operating income:
| $3,290 | $39,480 |
Operating Expenses
| % Rent | Monthly | Yearly | |
|---|---|---|---|
Property TaxesAnnual taxes levied by local governments on real estate properties. These taxes fund public services like schools, roads, and emergency services. | 9% | -$313 | -$3,760 |
InsuranceThe costs for insurance coverage to protect against financial losses due to risks like fire, natural disasters, theft, liability, or tenant-related damages. Calculation:Assumes 7% of gross rental income, unless insurance rates are specified. | 7% | -$245 | -$2,940 |
Property ManagementThe costs associated with hiring a property manager to handle the day-to-day operations of a rental property. Includes management fees, leasing fes, eviction fees, etc. Calculation:Assumes 8% of gross rental income. | 8% | -$280 | -$3,360 |
Repairs & MaintenanceOngoing costs for routine upkeep and minor fixes needed to keep a property in good working condition. Calculation:Assumes 5% of gross rental income. Varies by property age and condition. | 5% | -$175 | -$2,100 |
Capital ExpensesLarge, infrequent costs for major improvements or replacements, like a new roof, HVAC system, or appliances. Calculation:Assumes 5% of gross rental income. Varies by property age. | 5% | -$175 | -$2,100 |
HOA FeesRegular dues paid to a Homeowners Association for community maintenance, amenities, and management. Similar fees include: Condo Association Fees, Co-op Maintenance Fees, etc. | 4% | -$140 | -$1,680 |
Operating ExpensesRecurring costs required to maintain and manage a rental property, including property taxes, insurance, maintenance, repairs, utilities (if paid by the owner), property management fees, and other day-to-day expenses. Calculation:Insurance + Property Taxes + Property Management + Repairs & Maintenance + Capital Expenditures + HOA Fees | 38% | -$1,328 | -$15,940 |
Cash Flow
| Monthly | Yearly | |
|---|---|---|
Net Operating Income (NOI)The income generated from a property after deducting all operating expenses but before deducting mortgage payments, taxes, and capital expenditures. Calculation:Gross Operating Income - Operating Expenses
Net operating income:
| $1,962 | $23,544 |
Mortgage PaymentThe fixed amount a borrower pays each month to repay a loan. It typically includes principal and interest (P&I) and may also cover property taxes, insurance, HOA fees, and PMI if escrowed. | -$3,765 | -$45,180 |
Cash FlowNet Operating Income (NOI) minus mortgage payments. Calculation:NOI - Mortgage Payments | $1,803 | $21,636 |