Buford, GA Investment Properties for Sale
Browse homes for sale and investment properties in Buford, GA. Refine your search by price, property type, or more.
Best cash flowing properties in Buford, GA
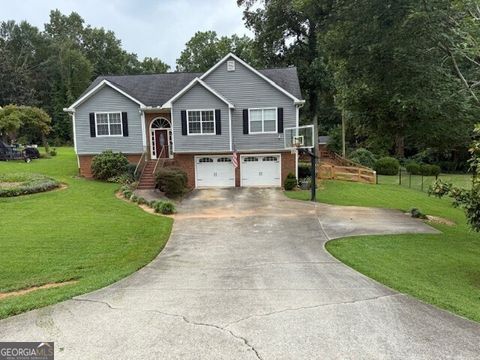
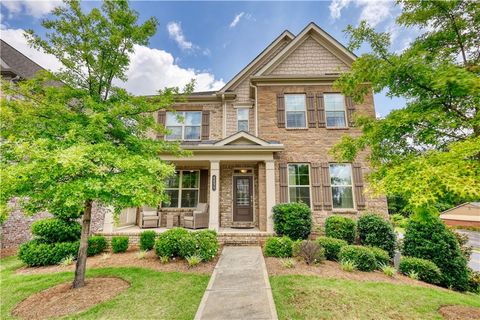
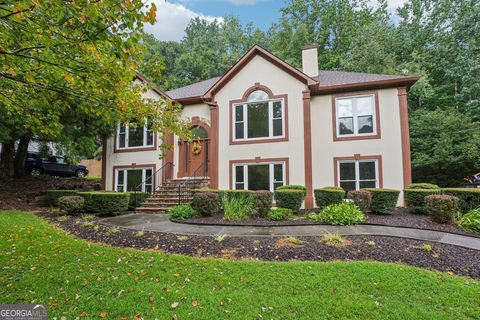
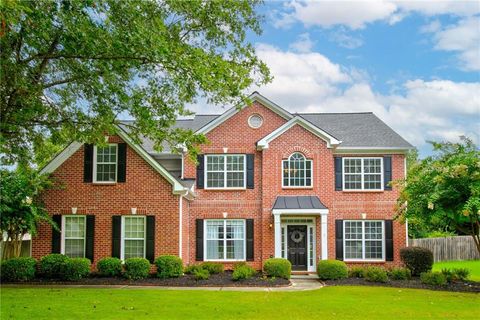
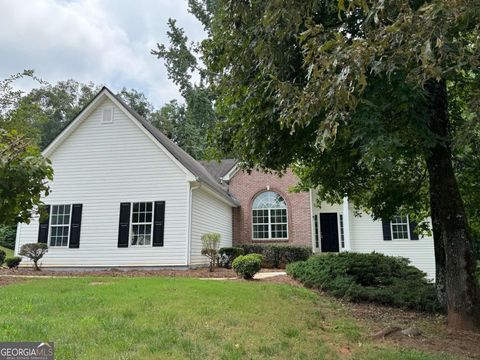
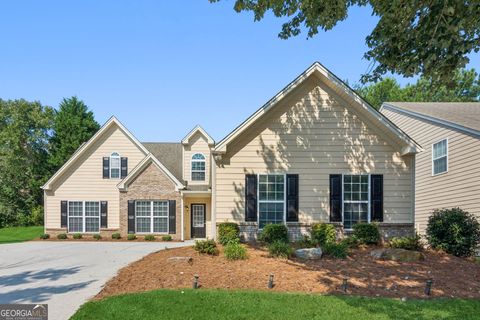
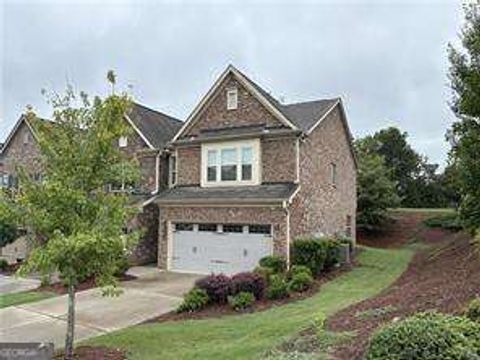
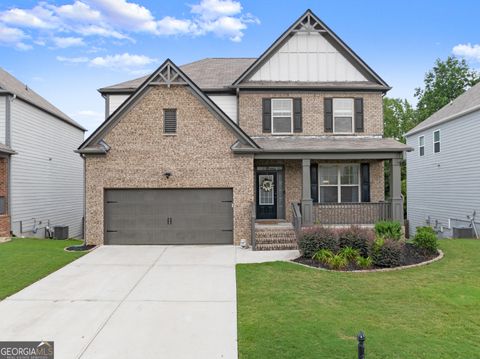
Active
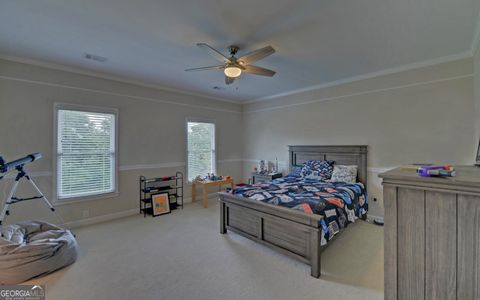
$449,800
3
bds
|
2.5
ba
|
2,206
sqft
|
built
1993
100 Victor Dr, Buford, GA 30518
$-635
Cash flow
-7.4%
Cash-on-Cash Return
4.5%
Cap rate
0.6%
Rent to Value Ratio
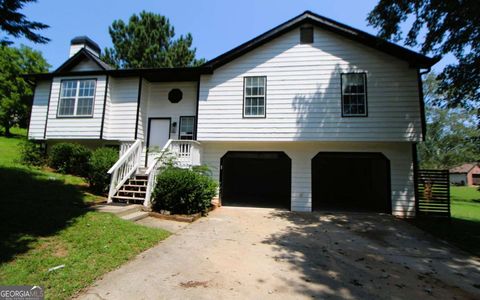
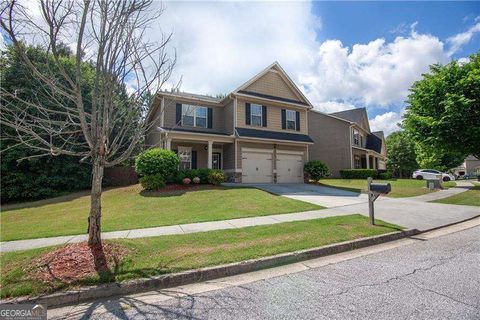
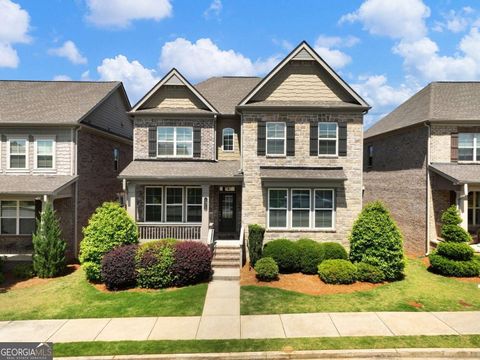
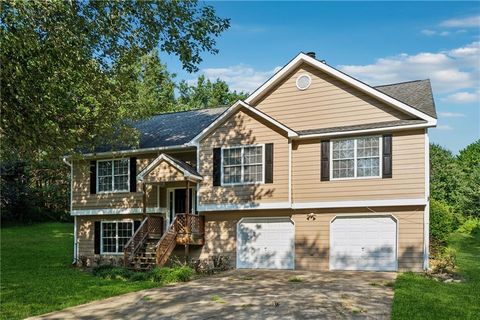
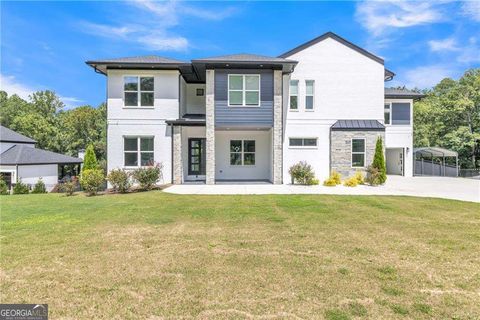
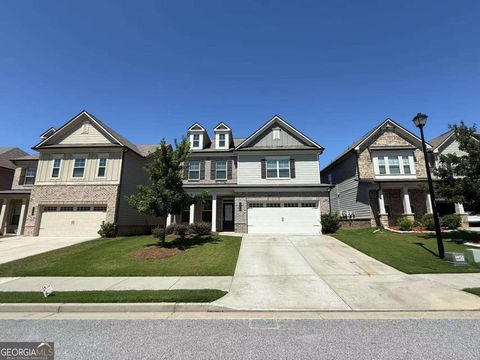
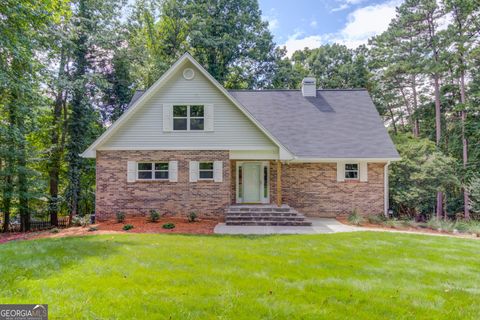
Active
$380,000
4
bds
|
2
ba
|
0
sqft
|
built
1992
3202 Windgate Dr, Buford, GA 30519
$-699
Cash flow
-9.6%
Cash-on-Cash Return
3.9%
Cap rate
0.6%
Rent to Value Ratio
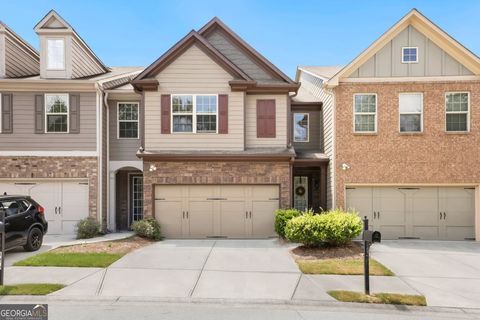
229 out of 250 properties for sale in Buford, GA
Limited Results Shown
Create a free account, or log in to reveal all property listings and enjoy the complete experience.
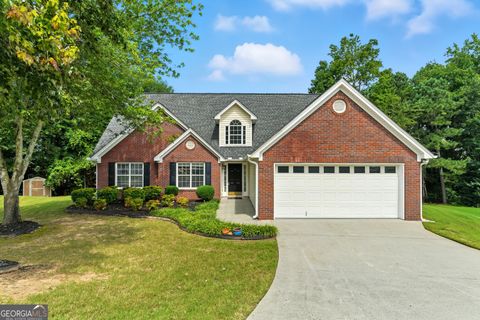
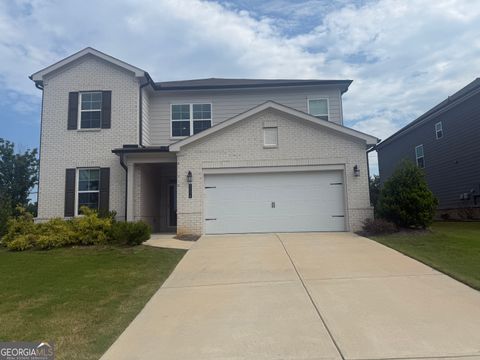
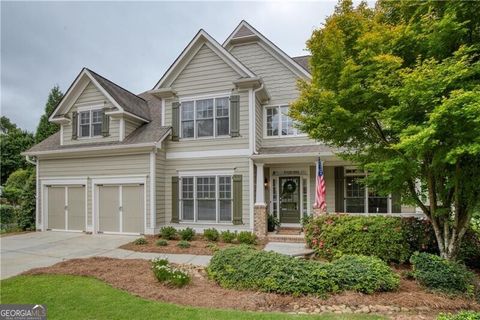
Active
$430,000
4
bds
|
2.5
ba
|
2,793
sqft
|
built
2002
5735 Lake Windsor Pkwy, Buford, GA 30518
$-935
Cash flow
-11.3%
Cash-on-Cash Return
3.5%
Cap rate
0.7%
Rent to Value Ratio
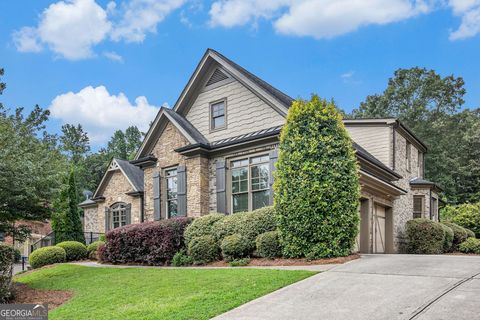
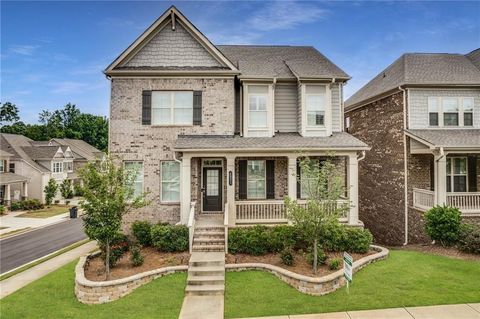
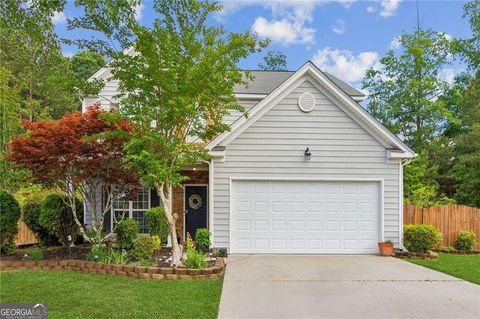
Active
$625,000
4
bds
|
3
ba
|
3,118
sqft
|
built
2021
3606 Andover Way, Buford, GA 30519
$-1,791
Cash flow
-15.0%
Cash-on-Cash Return
2.7%
Cap rate
0.5%
Rent to Value Ratio
Active
$729,900
5
bds
|
4
ba
|
3,180
sqft
|
built
2018
4895 Sterling Close, Buford, GA 30518
$-2,195
Cash flow
-15.7%
Cash-on-Cash Return
2.5%
Cap rate
0.5%
Rent to Value Ratio

Active
$519,000
5
bds
|
3
ba
|
0
sqft
|
built
2013
3248 Sag Harbor Ct, Buford, GA 30519
$-1,458
Cash flow
-14.7%
Cash-on-Cash Return
2.8%
Cap rate
0.5%
Rent to Value Ratio
Active
$395,000
3
bds
|
3
ba
|
0
sqft
|
built
2021
2378 Morgan Creek Rd, Buford, GA 30519
$-782
Cash flow
-10.3%
Cash-on-Cash Return
3.8%
Cap rate
0.6%
Rent to Value Ratio
Active
$580,000
3
bds
|
2.5
ba
|
2,200
sqft
|
built
1998
5025 Harbor Ridge Dr, Buford, GA 30518
$-1,182
Cash flow
-10.6%
Cash-on-Cash Return
3.7%
Cap rate
0.5%
Rent to Value Ratio
Active
$359,000
3
bds
|
2.5
ba
|
1,956
sqft
|
built
2013
3315 Sardis Bend Dr, Buford, GA 30519
$-785
Cash flow
-11.4%
Cash-on-Cash Return
3.5%
Cap rate
0.6%
Rent to Value Ratio
Active
$450,000
3
bds
|
3
ba
|
3,157
sqft
|
built
1994
2038 Buford Dam Rd, Buford, GA 30518
$-767
Cash flow
-8.9%
Cash-on-Cash Return
4.1%
Cap rate
0.5%
Rent to Value Ratio
Active
$499,900
4
bds
|
3
ba
|
3,800
sqft
|
built
1994
5820 Elm Tree Dr, Buford, GA 30518
$-1,022
Cash flow
-10.7%
Cash-on-Cash Return
3.7%
Cap rate
0.5%
Rent to Value Ratio
Active
$479,900
4
bds
|
3
ba
|
0
sqft
|
built
2014
4271 Haywater Cv, Buford, GA 30519
$-1,156
Cash flow
-12.6%
Cash-on-Cash Return
3.3%
Cap rate
0.5%
Rent to Value Ratio
Active
$419,000
4
bds
|
3
ba
|
0
sqft
|
built
2001
3066 Gem Creek Rd, Buford, GA 30519
$-1,110
Cash flow
-13.8%
Cash-on-Cash Return
3.0%
Cap rate
0.5%
Rent to Value Ratio
Active
$850,000
5
bds
|
4
ba
|
4,143
sqft
|
built
2006
2953 Springbluff Ln, Buford, GA 30519
$-3,071
Cash flow
-18.9%
Cash-on-Cash Return
1.8%
Cap rate
0.4%
Rent to Value Ratio
Active
$549,000
5
bds
|
3
ba
|
2,938
sqft
|
built
2001
3102 Seneca Farm Ln, Buford, GA 30519
$-1,453
Cash flow
-13.8%
Cash-on-Cash Return
3.0%
Cap rate
0.5%
Rent to Value Ratio
Active
$679,900
5
bds
|
4
ba
|
3,720
sqft
|
built
2018
4905 Sterling Close, Buford, GA 30518
$-1,616
Cash flow
-12.4%
Cash-on-Cash Return
3.3%
Cap rate
0.5%
Rent to Value Ratio
Active
$671,000
5
bds
|
4.5
ba
|
0
sqft
|
built
2020
2066 Holland Creek Ct, Buford, GA 30519
$-2,170
Cash flow
-16.9%
Cash-on-Cash Return
2.3%
Cap rate
0.4%
Rent to Value Ratio
Active
$367,000
3
bds
|
2.5
ba
|
1,968
sqft
|
built
2014
3669 Brockenhurst Dr, Buford, GA 30519
$-752
Cash flow
-10.7%
Cash-on-Cash Return
3.7%
Cap rate
0.6%
Rent to Value Ratio
Active
$599,000
3
bds
|
3
ba
|
2,837
sqft
|
built
1964
2410 Thrasher Rd, Buford, GA 30519
$-1,400
Cash flow
-12.2%
Cash-on-Cash Return
3.3%
Cap rate
0.4%
Rent to Value Ratio
Active
$399,900
3
bds
|
2
ba
|
0
sqft
|
built
2000
4556 Duane Dr, Buford, GA 30519
$-898
Cash flow
-11.7%
Cash-on-Cash Return
3.5%
Cap rate
0.6%
Rent to Value Ratio
Active
$369,000
4
bds
|
3
ba
|
0
sqft
|
built
1994
3310 Windward Gate Ln, Buford, GA 30519
$-704
Cash flow
-10.0%
Cash-on-Cash Return
3.9%
Cap rate
0.6%
Rent to Value Ratio
Active
$525,300
4
bds
|
2.5
ba
|
3,122
sqft
|
built
2014
4457 Water Mill Dr, Buford, GA 30519
$-1,211
Cash flow
-12.0%
Cash-on-Cash Return
3.4%
Cap rate
0.6%
Rent to Value Ratio
Active
$449,000
4
bds
|
3
ba
|
2,242
sqft
|
built
2015
2436 Loughridge Dr, Buford, GA 30519
$-887
Cash flow
-10.3%
Cash-on-Cash Return
3.8%
Cap rate
0.6%
Rent to Value Ratio
Active
$449,950
4
bds
|
3
ba
|
2,664
sqft
|
built
2007
2818 Suttonwood Way, Buford, GA 30519
$-932
Cash flow
-10.8%
Cash-on-Cash Return
3.7%
Cap rate
0.6%
Rent to Value Ratio
Active
$345,000
4
bds
|
2.5
ba
|
0
sqft
|
built
2008
2433 Sardis Chase Ct, Buford, GA 30519
$-1,081
Cash flow
-16.3%
Cash-on-Cash Return
2.4%
Cap rate
0.6%
Rent to Value Ratio
Active
$1,999,900
5
bds
|
6
ba
|
8,458
sqft
|
built
2022
3671 Hamilton Mill Rd, Buford, GA 30519
$-8,293
Cash flow
-21.6%
Cash-on-Cash Return
1.2%
Cap rate
0.3%
Rent to Value Ratio
Active
$599,000
5
bds
|
4
ba
|
3,379
sqft
|
built
2021
3334 Long Creek Dr, Buford, GA 30519
$-1,284
Cash flow
-11.2%
Cash-on-Cash Return
3.6%
Cap rate
0.5%
Rent to Value Ratio
Active
$749,500
4
bds
|
4
ba
|
4,567
sqft
|
built
2018
4831 Miller Hill Rd, Buford, GA 30518
$-1,566
Cash flow
-10.9%
Cash-on-Cash Return
3.6%
Cap rate
0.5%
Rent to Value Ratio
Active
$2,200,000
5
bds
|
5
ba
|
5,716
sqft
|
built
1997
2760 Camp Branch Rd, Buford, GA 30519
$-6,818
Cash flow
-16.2%
Cash-on-Cash Return
2.4%
Cap rate
0.4%
Rent to Value Ratio
Active
$475,000
4
bds
|
3
ba
|
2,166
sqft
|
built
1999
3737 Victoria Dr, Buford, GA 30519
$-949
Cash flow
-10.4%
Cash-on-Cash Return
3.7%
Cap rate
0.5%
Rent to Value Ratio
Active
$800,000
6
bds
|
5
ba
|
4,592
sqft
|
built
2006
4731 Moon Chase Dr, Buford, GA 30519
$-2,430
Cash flow
-15.8%
Cash-on-Cash Return
2.5%
Cap rate
0.4%
Rent to Value Ratio
Active
$499,900
5
bds
|
2.5
ba
|
3,593
sqft
|
built
2007
1183 Lanier Springs Dr, Buford, GA 30518
$-1,090
Cash flow
-11.4%
Cash-on-Cash Return
3.5%
Cap rate
0.6%
Rent to Value Ratio
Active
$410,000
3
bds
|
2.5
ba
|
1,881
sqft
|
built
2019
4360 Lanier Park Dr, Buford, GA 30518
$-1,038
Cash flow
-13.2%
Cash-on-Cash Return
3.1%
Cap rate
0.6%
Rent to Value Ratio
Active
$739,000
4
bds
|
3
ba
|
1,652
sqft
|
built
1981
3105 Hamilton Mill Rd, Buford, GA 30519
$-2,655
Cash flow
-18.7%
Cash-on-Cash Return
1.8%
Cap rate
0.3%
Rent to Value Ratio
Active
$3,800,000
6
bds
|
6
ba
|
11,000
sqft
|
built
2017
2305 Braselton Hwy, Buford, GA 30519
$-17,974
Cash flow
-24.7%
Cash-on-Cash Return
0.5%
Cap rate
0.2%
Rent to Value Ratio
Active
$605,000
4
bds
|
3.5
ba
|
0
sqft
|
built
2021
3075 Andover Trl, Buford, GA 30519
$-1,842
Cash flow
-15.9%
Cash-on-Cash Return
2.5%
Cap rate
0.5%
Rent to Value Ratio
Active
$611,000
5
bds
|
4
ba
|
3,482
sqft
|
built
2019
4398 Mantova Dr, Buford, GA 30519
$-1,698
Cash flow
-14.5%
Cash-on-Cash Return
2.8%
Cap rate
0.5%
Rent to Value Ratio
Active
$745,000
4
bds
|
3
ba
|
3,074
sqft
|
built
1989
6596 Garrett Rd, Buford, GA 30518
$-2,194
Cash flow
-15.4%
Cash-on-Cash Return
2.6%
Cap rate
0.3%
Rent to Value Ratio
Active
$695,000
6
bds
|
5
ba
|
4,310
sqft
|
built
2003
4106 Creekview Ridge Dr, Buford, GA 30518
$-1,970
Cash flow
-14.8%
Cash-on-Cash Return
2.7%
Cap rate
0.5%
Rent to Value Ratio
Active
$410,000
3
bds
|
2.5
ba
|
2,244
sqft
|
built
2000
2173 Beacon Crest Dr, Buford, GA 30519
$-1,070
Cash flow
-13.6%
Cash-on-Cash Return
3.0%
Cap rate
0.6%
Rent to Value Ratio