$1,282,500
Investment Summary
- Monthly Cash Flow
- -$4,913
- Cap Rate
- 1.6%
- Cash-on-Cash Return
- -20.0%
- Debt Coverage Ratio
- 0.25
- Internal Rate of Return (5 years)
- -15.3%
Cash Flow
Net Operating Income (NOI) minus mortgage payments.
Calculation:
NOI - Mortgage Payments
Cap Rate (Market Value)
Capitalization Rate is a rate of return that compares the yearly Net Operating Income (NOI) to the market value.
Calculation:
NOI / Market Value
Cash-on-Cash Return (CoC)
Annual Cash Flow / Cash Invested
Calculation:
Annual cash flow divided by initial cash invested.
Debt Coverage Ratio (DCR)
Net Operating Income (NOI) divided by total debt payments.
Calculation:
NOI / Total Debt Payments
Internal Rate of Return (IRR)
A metric for assessing profitability over time. IRR is the discount rate at which the net present value (NPV) of all future cash flows (positive and negative) from an investment equals zero — including both periodic cash flow (such as rent) and a projected sale at the end of the holding period. It represents the expected annualized return, accounting for income, expenses, and the recovery of capital through a future sale.
Property Description
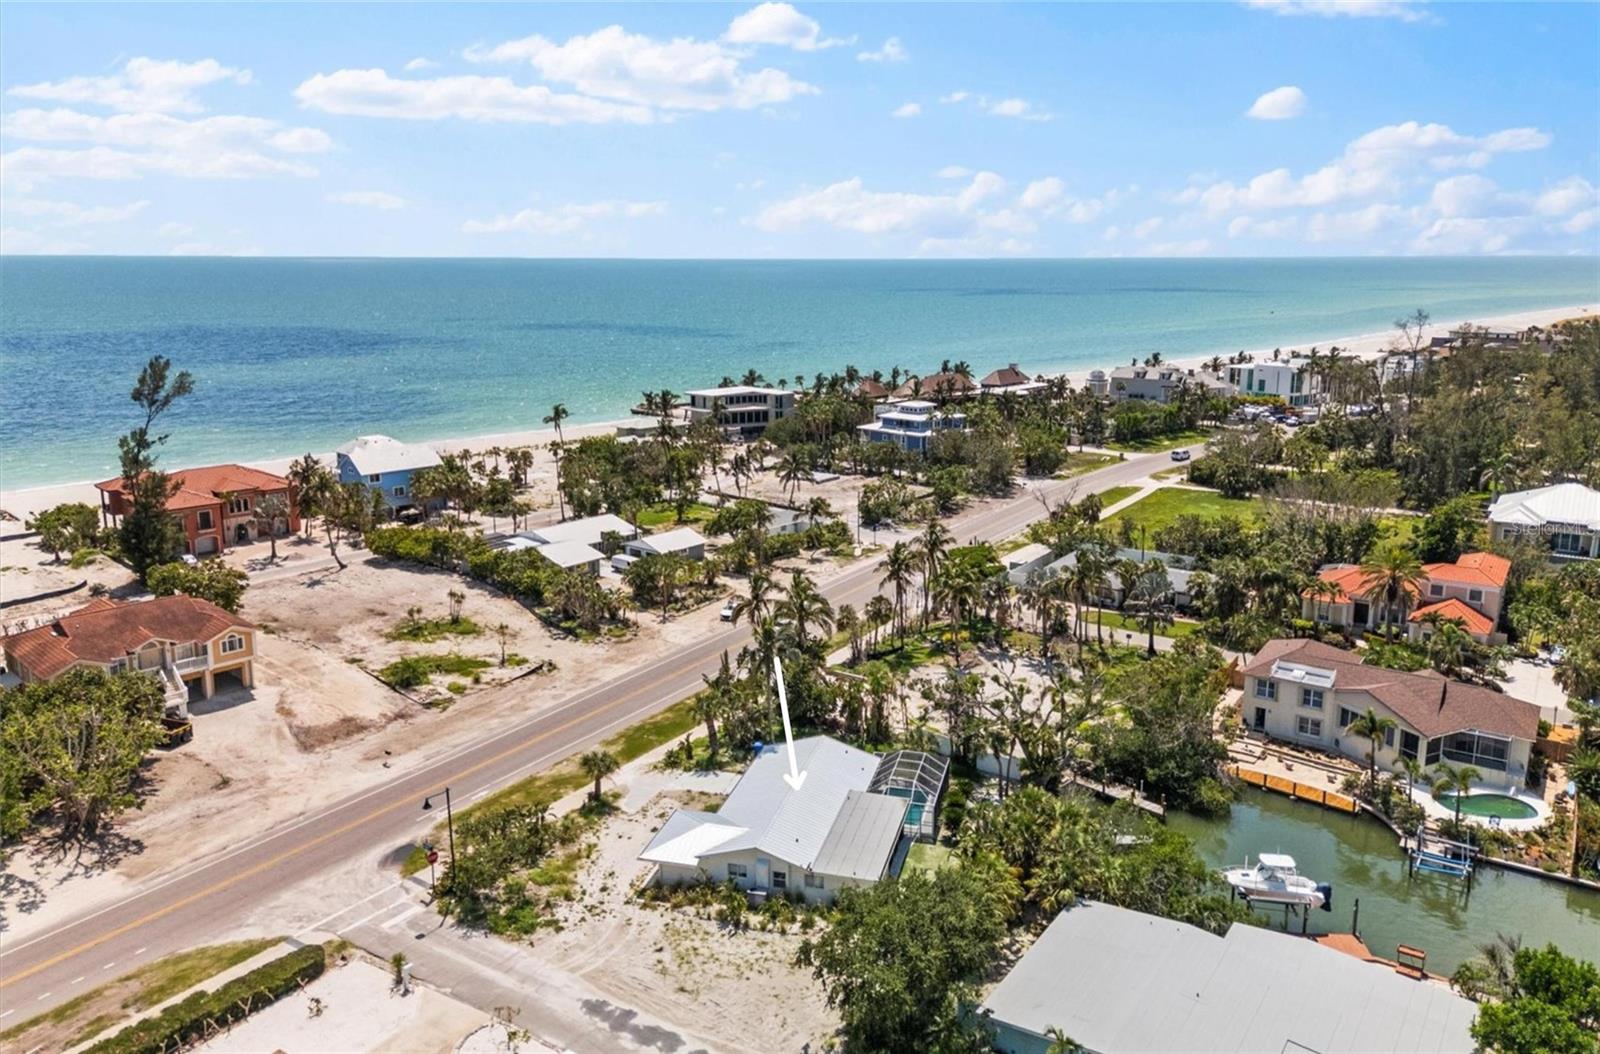
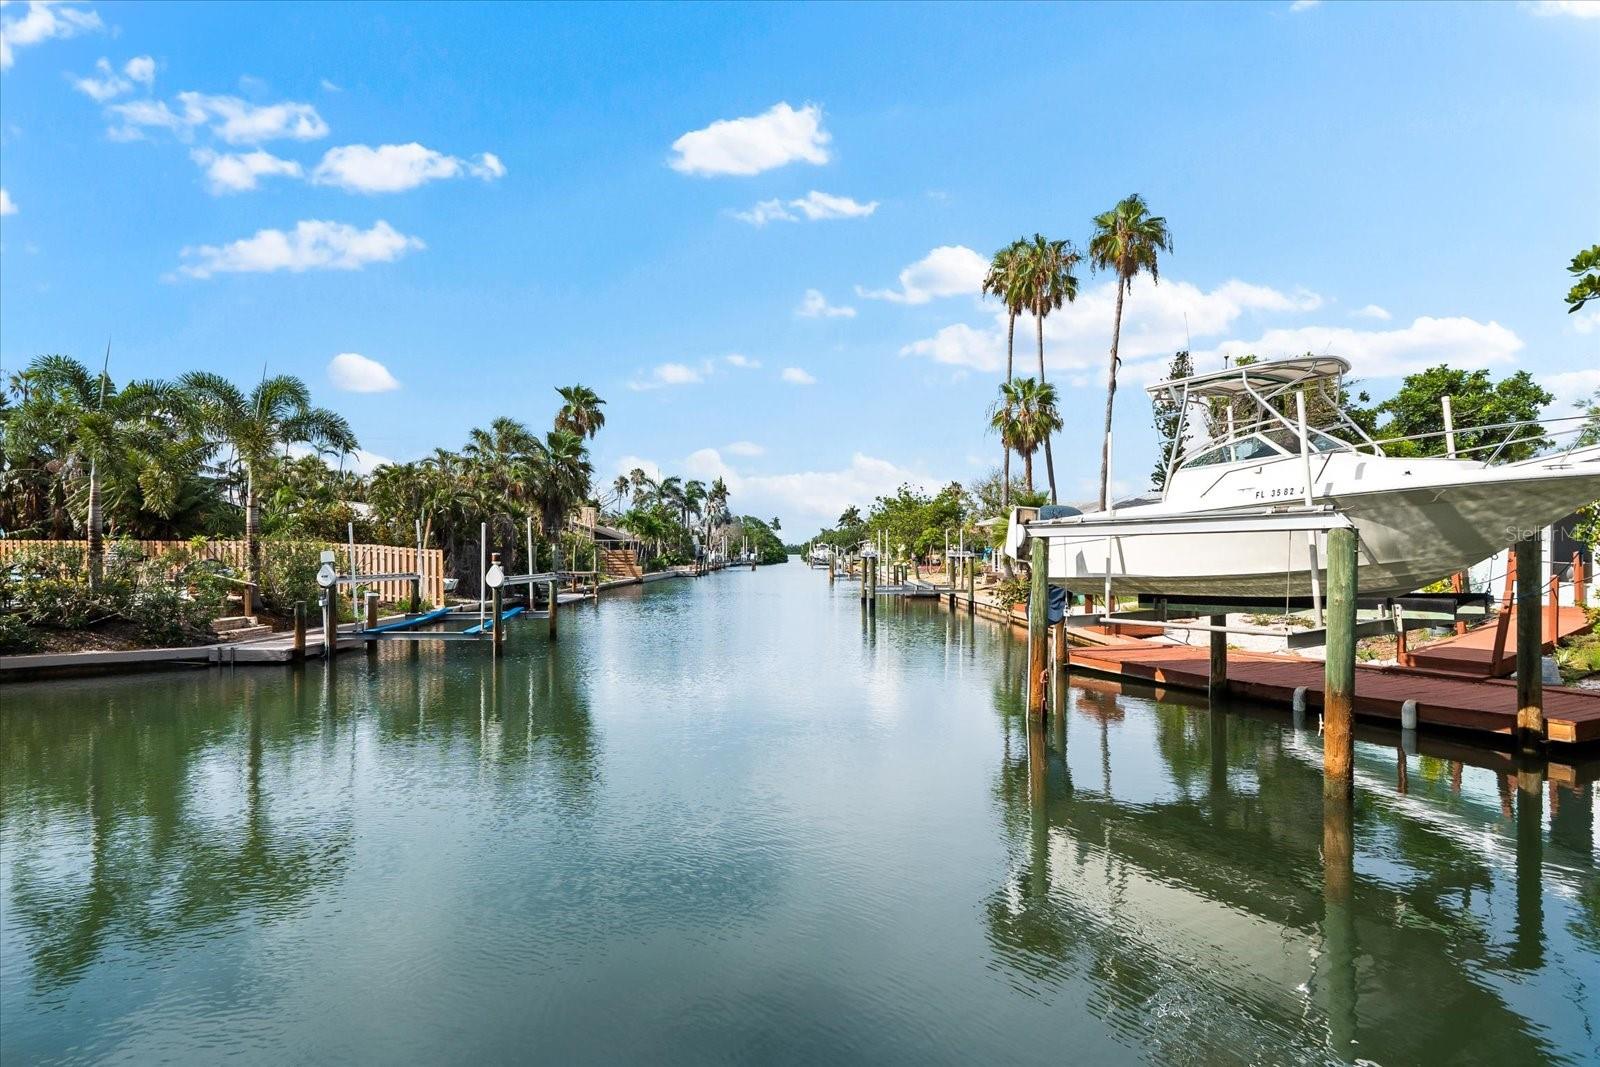
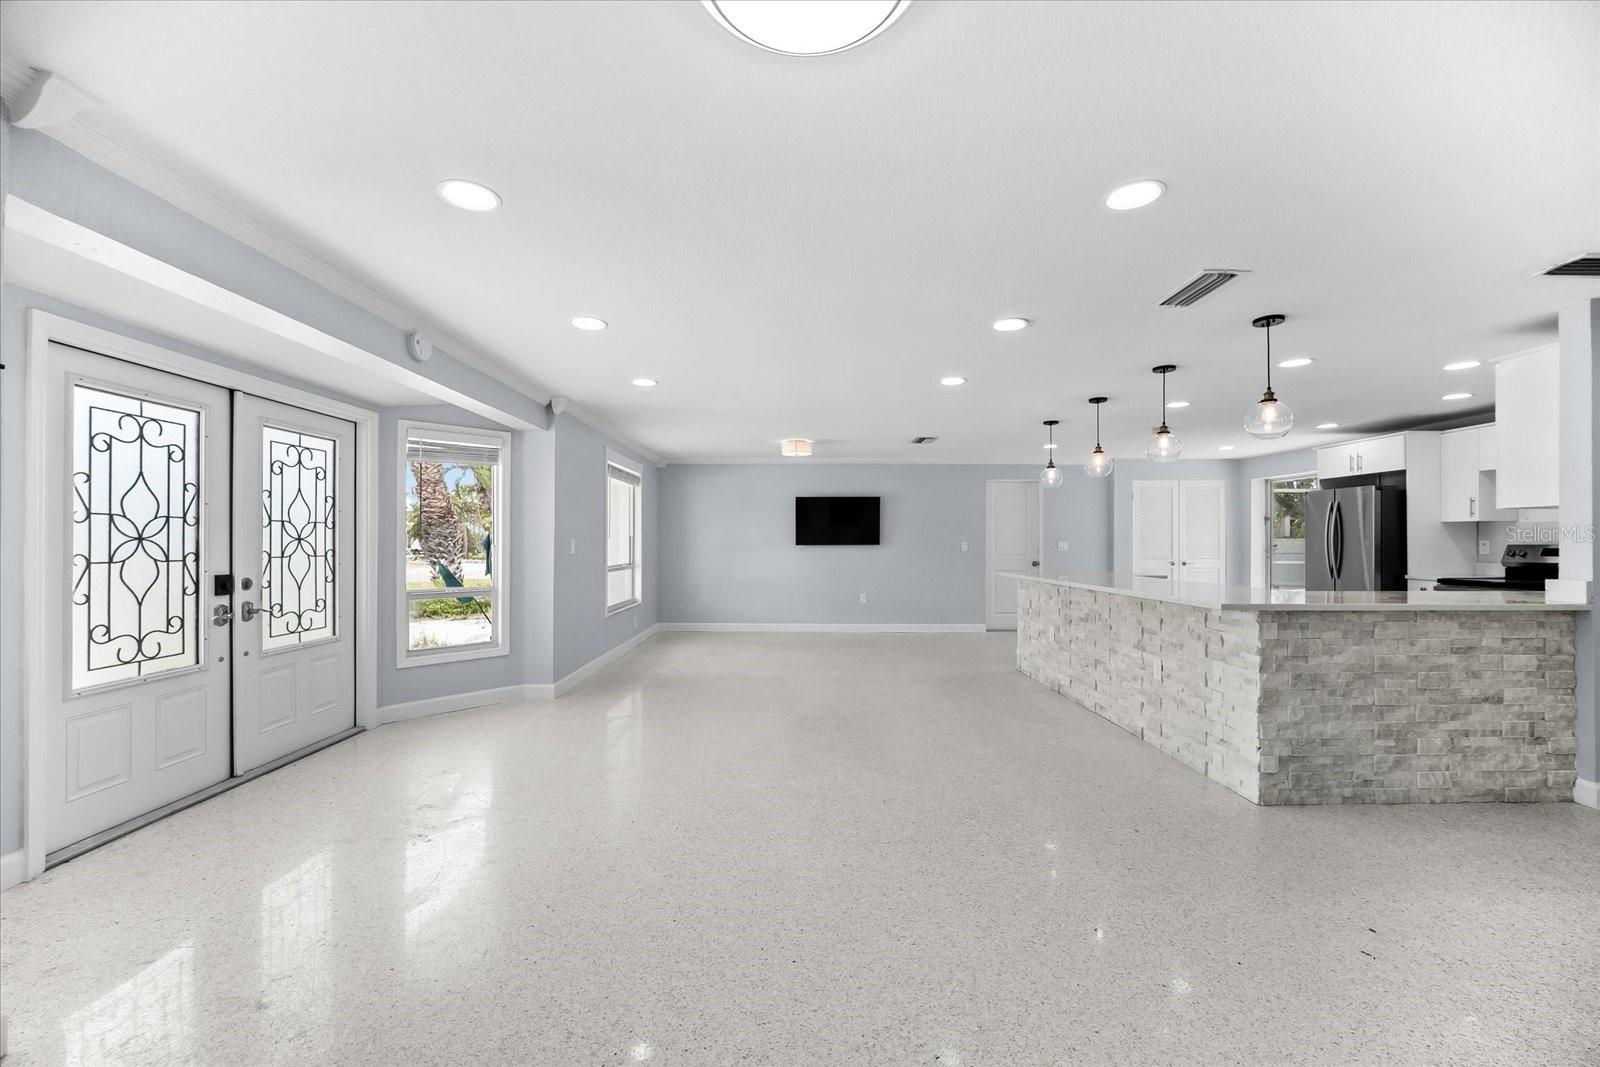
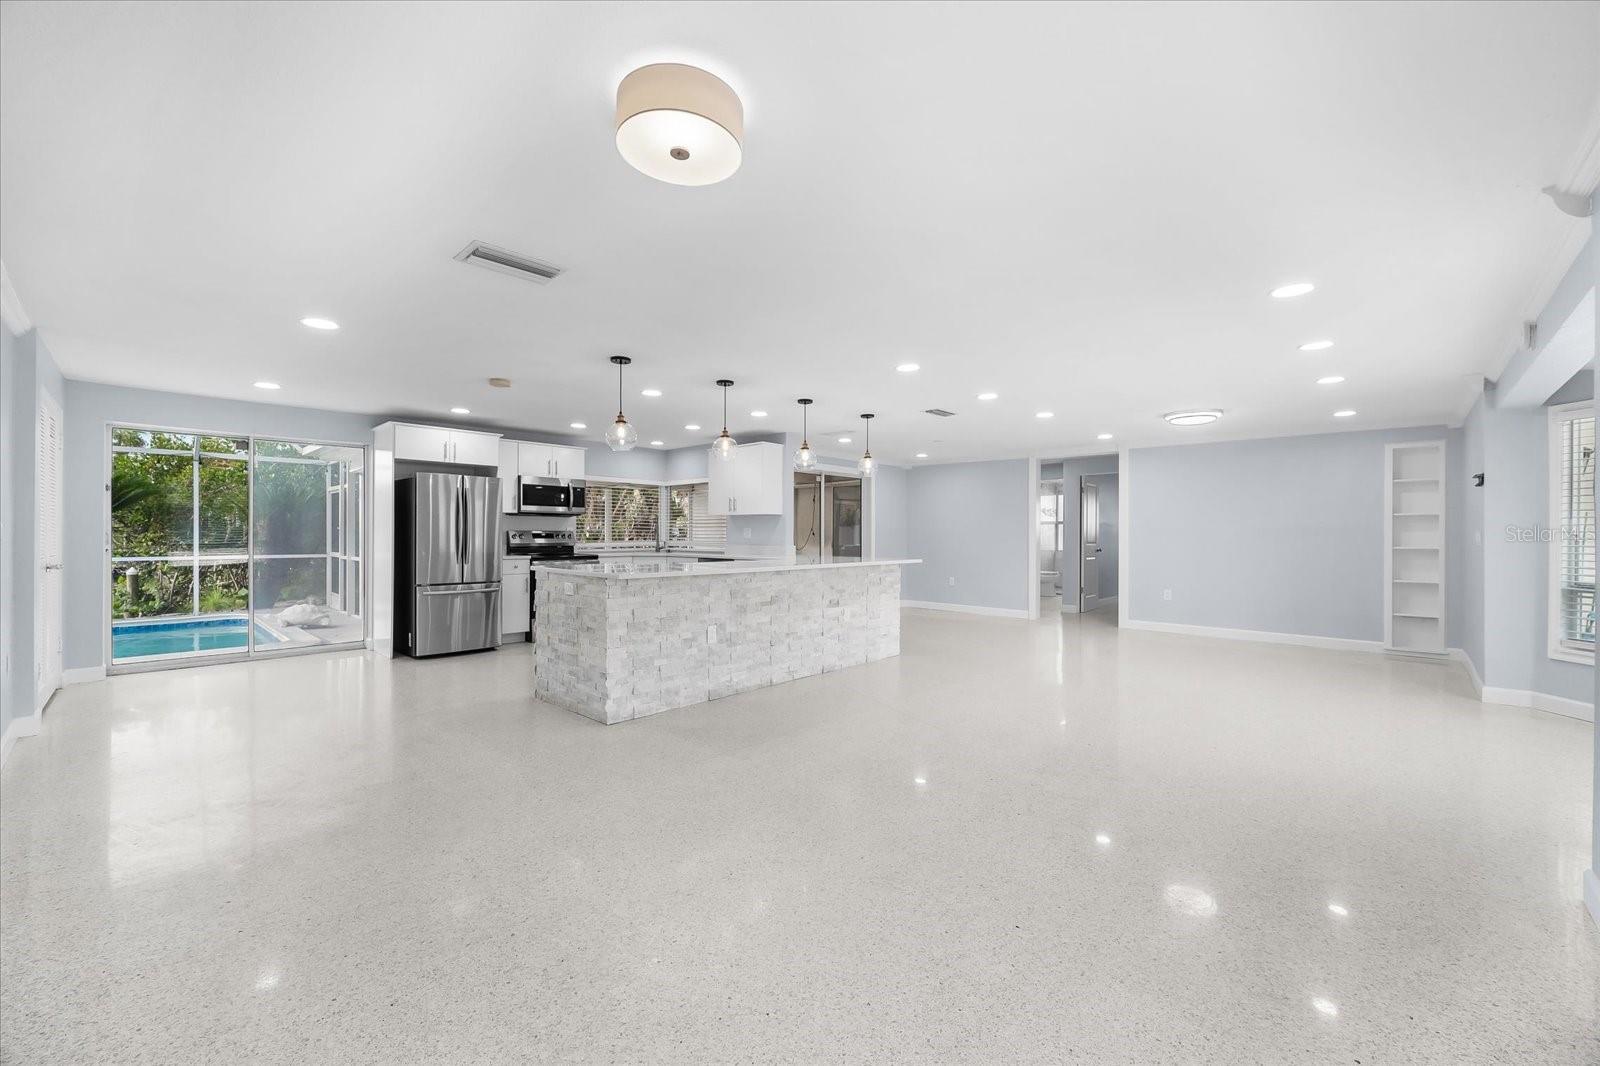
Some homes whisper. Others make a statement. 501 De Narvaez Drive commands attention—with bold architecture, elegant updates, and a prime waterfront location that elevates the Florida lifestyle into something exceptional. Nestled on a quiet corner lot in the coveted Sleepy Lagoon Park neighborhood, this home is your gateway to prestige, privacy, and the purest form of coastal living. Spanning 1,708 square feet of refined single-story living, this 3-bedroom, 2.5-bath residence is a masterclass in modern comfort and timeless materials. Designed with block construction and finished in stucco with a durable metal roof, the home is as solid as it is stylish. Inside, terrazzo flooring sweeps across the entire home, providing a sleek and enduring foundation underfoot. Enter into a light-drenched open floor plan, where the layout has been carefully crafted for entertaining, lounging, and effortless day-to-day living. The living room flows into a dining space and gourmet kitchen—outfitted with stone counters, solid surface tops, a spacious island, and stainless steel appliances including a convection oven and cooktop. Whether you’re entertaining guests or enjoying a peaceful morning coffee, every room connects you to the water and the outdoors. The primary suite is an owner’s haven, complete with a walk-in closet and full bath featuring a tub/shower combination. Two additional bedrooms—each with walk-in closets—offer comfort, functionality, and flexibility. A second full bath, half bath, and spacious laundry area provide all the elements of ease and convenience. But what truly defines this home is what lies beyond the doors. A private, heated pool, enclosed within a screened lanai, becomes your year-round sanctuary. The oversized covered deck is perfect for afternoon shade or sunset cocktails. And then there’s the water: with direct canal access to the Intracoastal Waterway, this home is a dream for boaters. The 2022 composite dock and concrete seawall are in pristine condition and ready for your vessel. No HOA means you can live your way, and with 1-month minimum leases allowed (rental license required), this property also offers incredible short- or long-term rental potential. Add in a two-car garage, central air, electric heat, public water/sewer, and fiber optic internet, and you have every modern amenity at your fingertips. This is more than just a home—it’s a statement of lifestyle. A bold, beautiful, and rare opportunity to own in one of Longboat Key’s most established and beloved communities, just moments from world-class beaches, golf, fine dining, and everything the Sarasota area has to offer. For the visionary buyer who seeks distinction, privacy, and water access—501 De Narvaez is where your story begins.
Build Your Team
Quickly find investor-friendly professionals who can help you succeed in real estate investing at any stage of the investing journey.


Agents
Match with investor-friendly agents who can help you find, analyze, and close your next deal


Lenders
Get the best funding…find investor-friendly lenders who specialize in your deal strategy


Property Managers
Transition to passive investing. Find a trusted property management partnership that lasts.


Tax Pros & Accountants
Taxes and financial reporting made easy—find experts to create tax savings strategies, file taxes, and more
Location
Property Details
Parking
- Description: Garage
- Details: Attached
- Garage Spaces: 2
- Spaces Total: 0
Bedroom Information
- # of Bedrooms: 3
Bathroom Information
- # of Baths (Full): 2
- # of Baths (Total): 3.0
Interior Features
- # of Rooms: 8
- # of Stories: 1
Exterior Features
- Exterior Walls Materials: Stucco
- Foundation: Slab
- Roof Type: Gable or Hip
- Roof Material: Metal
- Pool: Yes
Land Information
- Land Use: Residential
- Land Use Subtype: Single Family Residential
Lot Information
- Parcel ID: 78555.00000
- Lot Size: 10202 sqft
Property Information
- Property Type: Single Family Residence
- Year Built: 1972
Tax Information
- Annual Tax: $13,238
Utilities
- Water & Sewer: Public
- Heating: Central, Electric
- Cooling: Central Air
Location
- County: Manatee
Listing Details
Investment Summary
- Monthly Cash Flow
- -$4,913
- Cap Rate
- 1.6%
- Cash-on-Cash Return
- -20.0%
- Debt Coverage Ratio
- 0.25
- Internal Rate of Return (5 years)
- -15.3%
Cash Flow
Net Operating Income (NOI) minus mortgage payments.
Calculation:
NOI - Mortgage Payments
Cap Rate (Market Value)
Capitalization Rate is a rate of return that compares the yearly Net Operating Income (NOI) to the market value.
Calculation:
NOI / Market Value
Cash-on-Cash Return (CoC)
Annual Cash Flow / Cash Invested
Calculation:
Annual cash flow divided by initial cash invested.
Debt Coverage Ratio (DCR)
Net Operating Income (NOI) divided by total debt payments.
Calculation:
NOI / Total Debt Payments
Internal Rate of Return (IRR)
A metric for assessing profitability over time. IRR is the discount rate at which the net present value (NPV) of all future cash flows (positive and negative) from an investment equals zero — including both periodic cash flow (such as rent) and a projected sale at the end of the holding period. It represents the expected annualized return, accounting for income, expenses, and the recovery of capital through a future sale.
Purchase Details
Purchase PriceThe price paid for the property. Purchase price:
| $1,282,500 |
|---|---|
Amount FinancedThe amount of the purchase financed through a loan. Amount financed:
| -$1,026,000 |
Down paymentThe initial payment made towards the purchase. Down payment:
| $256,500 |
Closing CostsFees and expenses associated with purchasing a property, typically ranging from 2% to 5% of the home’s purchase price, paid at the end of a home purchase to cover services like lending, title transfer, and taxes. Closing costs:
| $38,475 |
Rehab CostsCosts incurred to repair or improve the property, including: roof, flooring, exterior siding, kitchen, exterior paint, bathrooms, etc. Rehab costs:
| $0 |
Initial Cash InvestedThe total initial cash invested in the property. Calculation:Down payment + Buying costs + Rehab costs Initial cash invested:
| $294,975 |
Square Feet (SQFT)The total square footage of the property. Square feet:
| 1,708 |
Cost Per Square FootCost per square foot of the property. Calculation:Purchase Price / Square Feet Cost per square foot:
| $751 |
Monthly Rent Per Square FootMonthly rent divided by the number of square feet. This ratio helps investors compare rental income efficiency across properties, markets, and unit sizes Calculation:Monthly Rent / Square Feet Monthly rent per square foot:
| $2.34 |
Financing Details
Loan AmountThe total sum of money borrowed from a lender to finance a property purchase. Calculation:Purchase Price - Down Payment
Loan amount:
| $1,026,000 |
|---|---|
Loan to Value Ratio (LTV)Loan amount divided by the market value of the property. Calculation:Loan Amount / Market Value
Loan to value ratio:
| 80.0% |
Loan TypeThe type of loan (e.g., fixed, adjustable).
Loan type:
| Amortizing |
TermThe loan repayment period in years.
Term:
| 30 years |
Interest RateThe percentage a lender charges on the borrowed amount of a loan, determining the cost of borrowing money.
Interest rate:
| 6.625% |
Principal & Interest (PI)The principal is the portion of the loan payment that reduces the loan balance. The interest is the lender's charge for borrowing money. Calculation:(P * r * (1 + r) ** n) / ((1 + r) ** n - 1) Where:
P = Loan amount (principal)
Principal & interest:
| $6,570 |
Property TaxesAnnual taxes levied by local governments on real estate properties. These taxes fund public services like schools, roads, and emergency services.
Property tax:
| $1,103 |
InsuranceThe costs for insurance coverage to protect against financial losses due to risks like fire, natural disasters, theft, liability, or tenant-related damages. Calculation:Assumes 7% of gross rental income, unless insurance rates are specified.
Insurance:
| $280 |
Private Mortgage Insurance (PMI)A fee that borrowers pay when they take out a conventional loan with a loan-to-value (LTV) ratio above 80%.
Private mortgage insurance (PMI):
| $0 |
Monthly PaymentThe fixed amount a borrower pays each month to repay a loan. It typically includes principal and interest (P&I) and may also cover property taxes, insurance, HOA fees, and PMI if escrowed. Monthly payment:
| $7,953 |
Operating Income
| % Rent | Monthly | Yearly | |
|---|---|---|---|
Gross RentThe total rental income received from tenants before deducting any expenses. Includes base rent, late fees, pet fees, parking fees, and other recurring charges.
Gross rent:
| $4,000 | $48,000 | |
Vacancy LossExpected loss of rent due to vacancies.
Vacancy loss:
(6%)
| 6% | -$240 | -$2,880 |
Operating IncomeGross rental income minus vacancy loss. Calculation:Gross rent - Vacancy loss
Operating income:
| $3,760 | $45,120 |
Operating Expenses
| % Rent | Monthly | Yearly | |
|---|---|---|---|
Property TaxesAnnual taxes levied by local governments on real estate properties. These taxes fund public services like schools, roads, and emergency services. | 28% | -$1,103 | -$13,238 |
InsuranceThe costs for insurance coverage to protect against financial losses due to risks like fire, natural disasters, theft, liability, or tenant-related damages. Calculation:Assumes 7% of gross rental income, unless insurance rates are specified. | 7% | -$280 | -$3,360 |
Property ManagementThe costs associated with hiring a property manager to handle the day-to-day operations of a rental property. Includes management fees, leasing fes, eviction fees, etc. Calculation:Assumes 8% of gross rental income. | 8% | -$320 | -$3,840 |
Repairs & MaintenanceOngoing costs for routine upkeep and minor fixes needed to keep a property in good working condition. Calculation:Assumes 5% of gross rental income. Varies by property age and condition. | 5% | -$200 | -$2,400 |
Capital ExpensesLarge, infrequent costs for major improvements or replacements, like a new roof, HVAC system, or appliances. Calculation:Assumes 5% of gross rental income. Varies by property age. | 5% | -$200 | -$2,400 |
HOA FeesRegular dues paid to a Homeowners Association for community maintenance, amenities, and management. Similar fees include: Condo Association Fees, Co-op Maintenance Fees, etc. | n/a | n/a | n/a |
Operating ExpensesRecurring costs required to maintain and manage a rental property, including property taxes, insurance, maintenance, repairs, utilities (if paid by the owner), property management fees, and other day-to-day expenses. Calculation:Insurance + Property Taxes + Property Management + Repairs & Maintenance + Capital Expenditures + HOA Fees | 53% | -$2,103 | -$25,238 |
Cash Flow
| Monthly | Yearly | |
|---|---|---|
Net Operating Income (NOI)The income generated from a property after deducting all operating expenses but before deducting mortgage payments, taxes, and capital expenditures. Calculation:Gross Operating Income - Operating Expenses
Net operating income:
| $1,657 | $19,884 |
Mortgage PaymentThe fixed amount a borrower pays each month to repay a loan. It typically includes principal and interest (P&I) and may also cover property taxes, insurance, HOA fees, and PMI if escrowed. | -$6,570 | -$78,840 |
Cash FlowNet Operating Income (NOI) minus mortgage payments. Calculation:NOI - Mortgage Payments | $4,913 | $58,956 |