$349,900
Investment Summary
- Monthly Cash Flow
- -$417
- Cap Rate
- 4.7%
- Cash-on-Cash Return
- -6.2%
- Debt Coverage Ratio
- 0.77
- Internal Rate of Return (5 years)
- -2.0%
Cash Flow
Net Operating Income (NOI) minus mortgage payments.
Calculation:
NOI - Mortgage Payments
Cap Rate (Market Value)
Capitalization Rate is a rate of return that compares the yearly Net Operating Income (NOI) to the market value.
Calculation:
NOI / Market Value
Cash-on-Cash Return (CoC)
Annual Cash Flow / Cash Invested
Calculation:
Annual cash flow divided by initial cash invested.
Debt Coverage Ratio (DCR)
Net Operating Income (NOI) divided by total debt payments.
Calculation:
NOI / Total Debt Payments
Internal Rate of Return (IRR)
A metric for assessing profitability over time. IRR is the discount rate at which the net present value (NPV) of all future cash flows (positive and negative) from an investment equals zero — including both periodic cash flow (such as rent) and a projected sale at the end of the holding period. It represents the expected annualized return, accounting for income, expenses, and the recovery of capital through a future sale.
Property Description
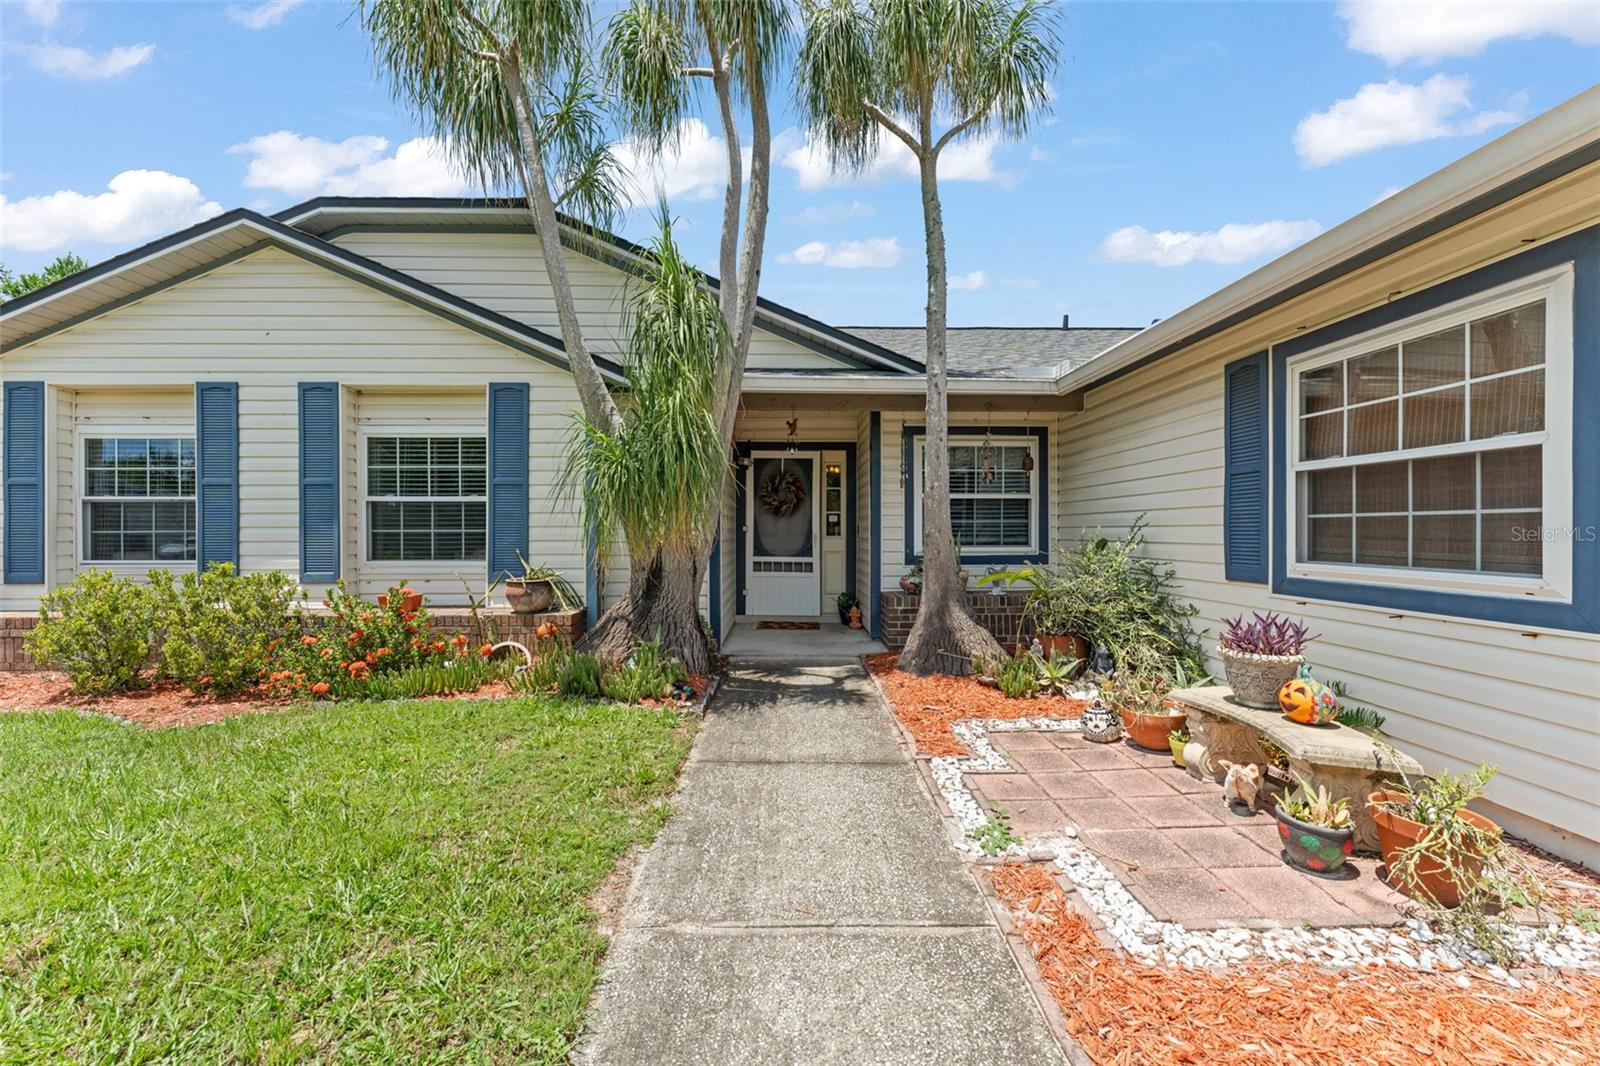
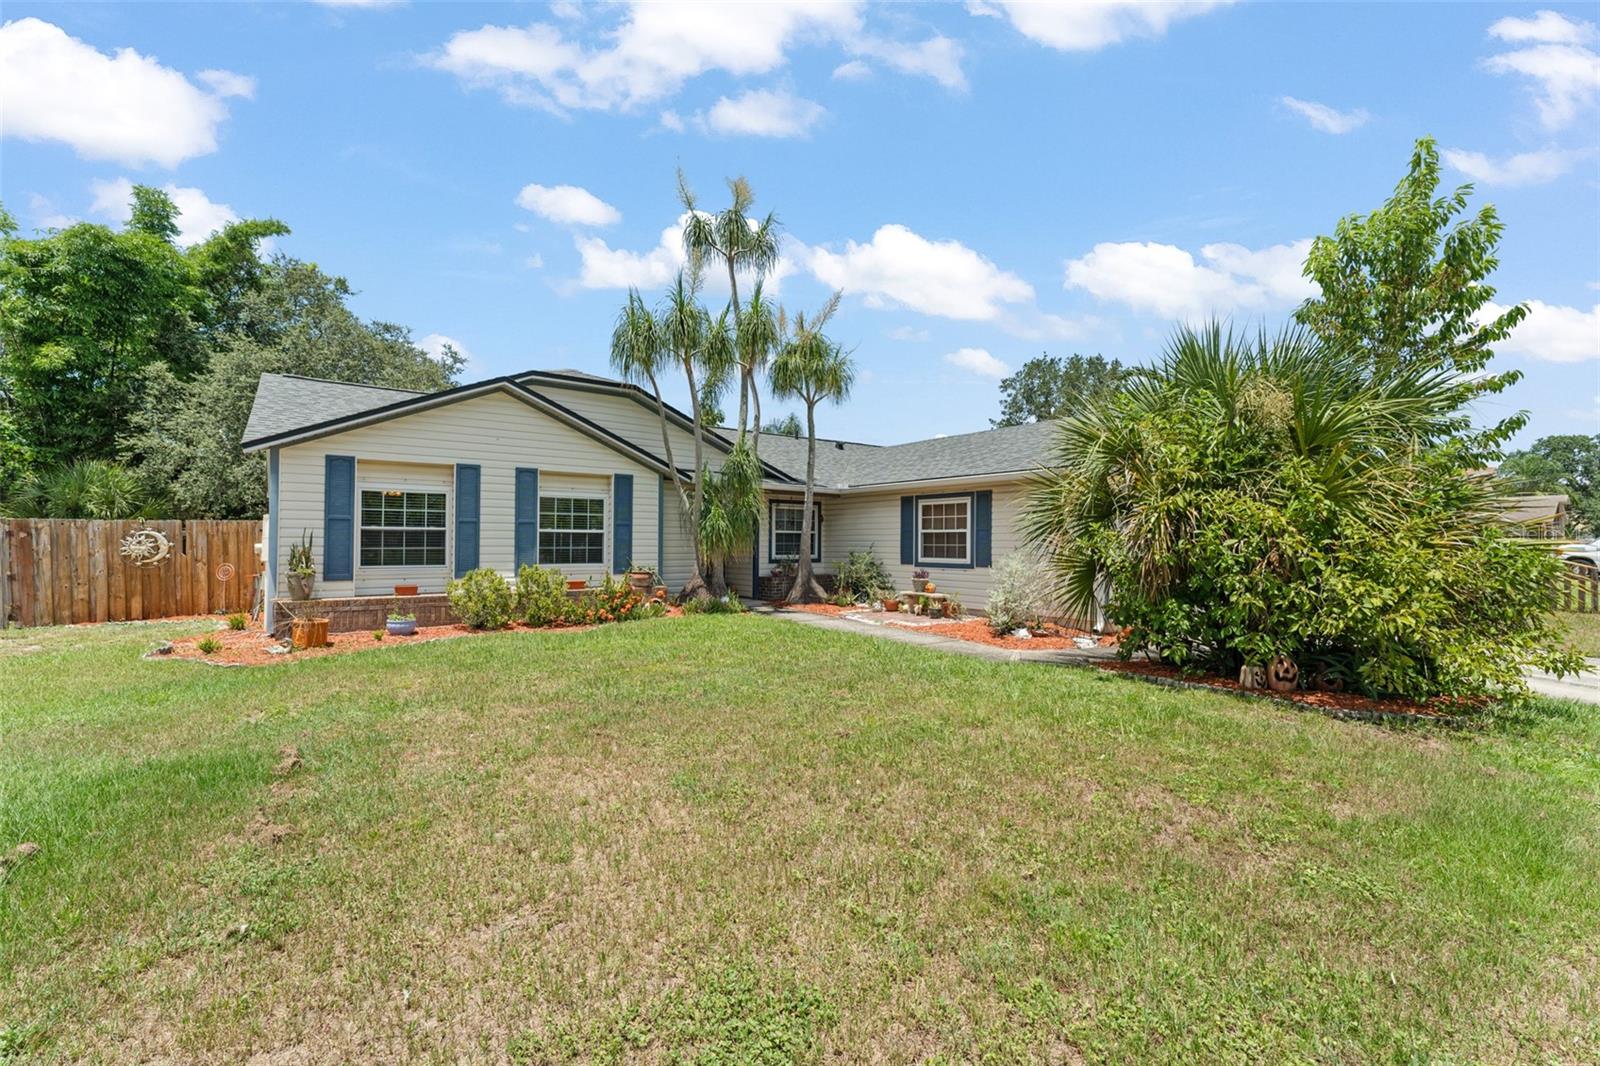
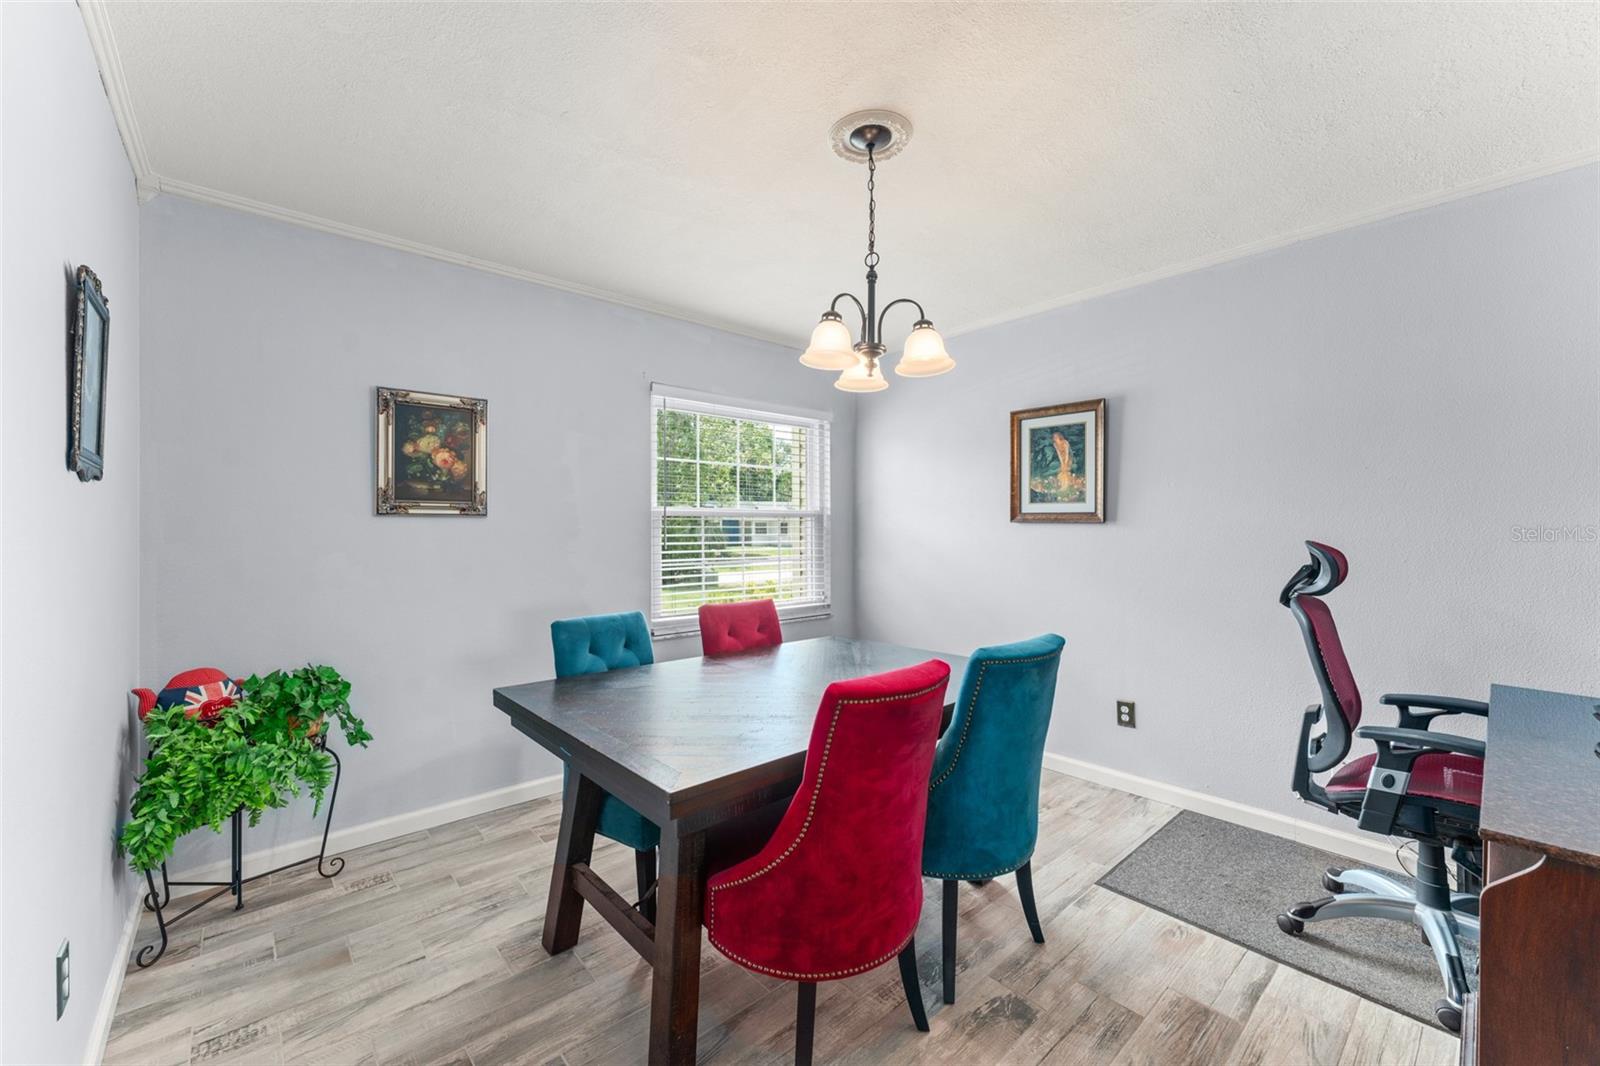
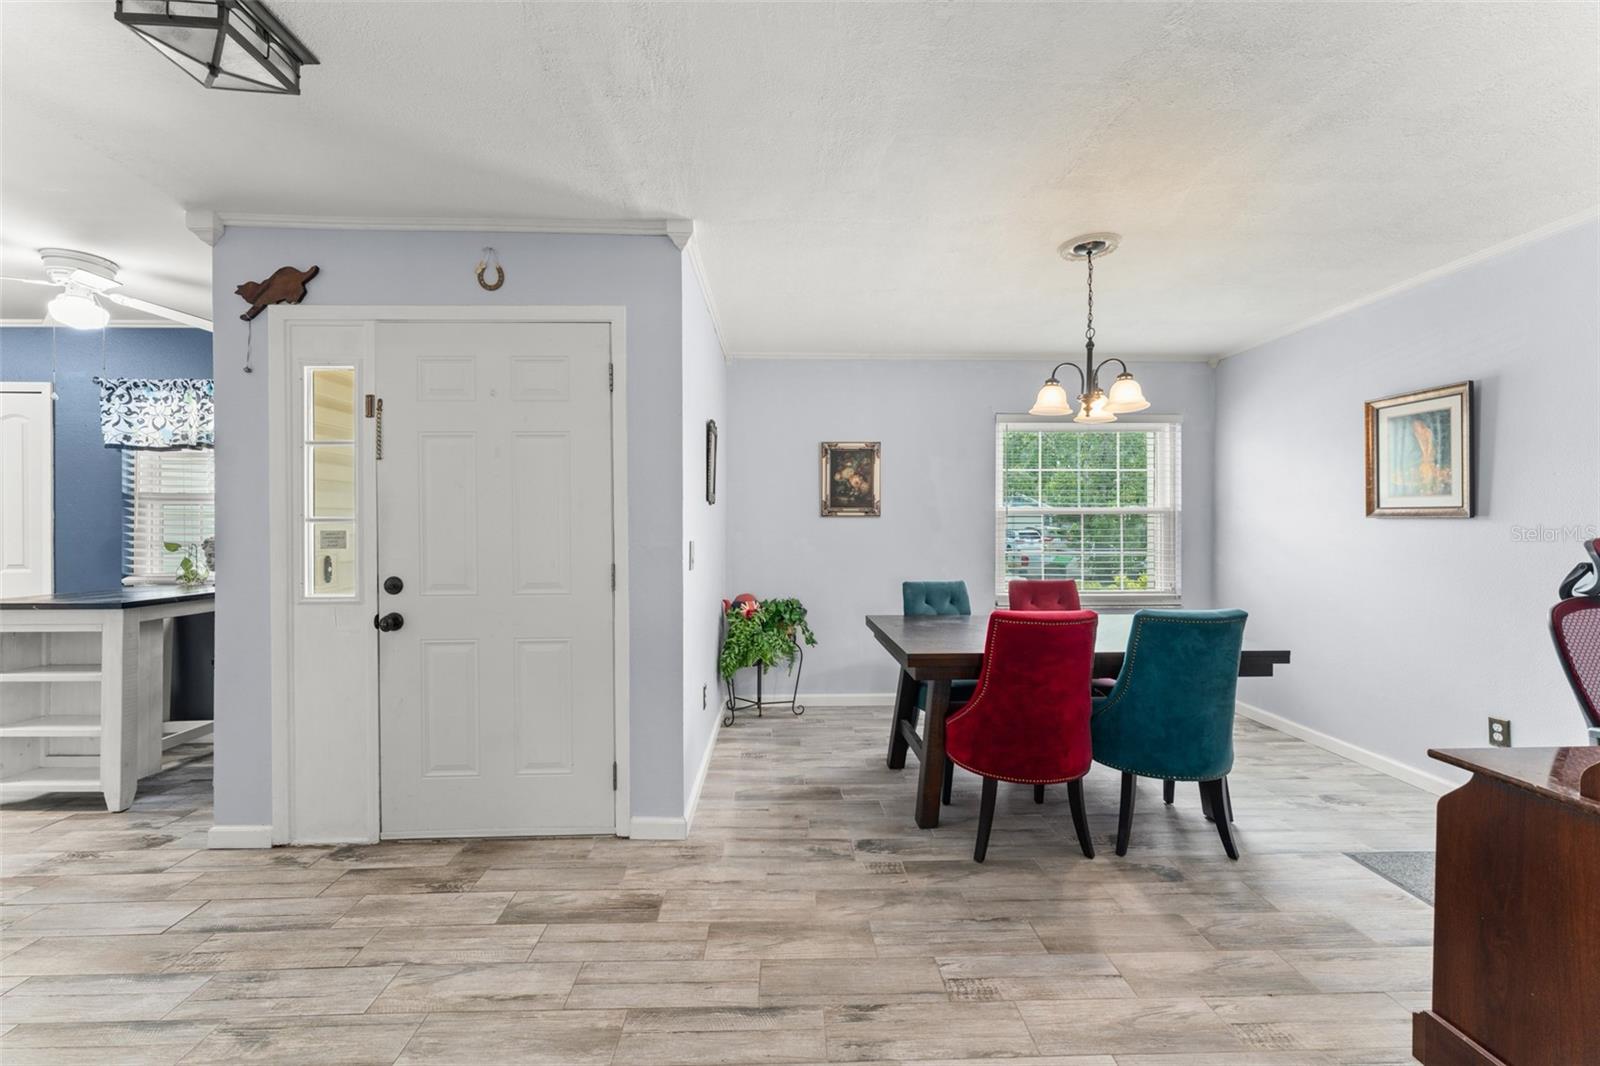
Under contract-accepting backup offers. **This house comes with a REDUCED RATE through the seller's preferred lender. This is a lender-paid rate buydown that reduces the buyer's interest rate and monthly payment.** This lovingly cared-for 3-bedroom, 2-bathroom single-family home offers nearly 1,400 sq ft of inviting living space, a 2-car garage, and a backyard that’s perfect for gathering, relaxing, and enjoying Florida living. From the moment you arrive, you're greeted by a beautifully manicured front yard with two welcoming trees flanking the walkway that leads you to the front door. Inside, the home opens up with a warm and bright layout—to your left, a formal dining room with a large front-facing window perfect for sharing meals and laughter. To your right, a bright and functional kitchen features white cabinetry, granite countertops, stainless steel appliances, and a serving window that connects seamlessly with the living room. There's also direct access to the garage—making unloading groceries a breeze. The home features tile flooring in the living areas and wood floors in the bedrooms, enhancing the clean, cohesive feel. Step into the cozy living room, where vaulted ceilings create a sense of space and openness. A glass sliding door invites you out to the screened-in porch and backyard, blending indoor and outdoor living beautifully. The split bedroom floor plan ensures privacy and comfort for everyone. The primary suite is your peaceful retreat, with a double-wide built-in closet and an ensuite bathroom featuring an oversized corner bathtub, a tub/shower combo, and an extra-long vanity with a quartz countertop. On the opposite side of the home, you'll find two additional bedrooms with built-in closets, and a full guest bathroom—tile-lined and equipped with a tub/shower combo—just steps away. Step outside to enjoy your own screened-in porch, complete with ceiling fan and ample space for relaxing or entertaining. Beyond lies a fully fenced backyard, perfect for play, pets, or peaceful mornings. Enjoy evenings around the built-in fire pit, host gatherings on the paved seating area, and take advantage of the shed (added in 2017) for extra storage. This home has seen thoughtful updates over the years to enhance comfort, efficiency, and style. Major upgrades include a new septic tank and drainfield (2012), complete kitchen renovation, new windows, AC system, and heating ducts (2014), master bathroom and water heater (2015), wood floors (2016), hall bathroom remodel, tile flooring, updated plumbing, custom closet organizers in all bedrooms, and a new roof with 25-year shingles (2018). This home isn't just a place to live—it’s a place to grow, gather, and create your next chapter. Tucked away in a quiet, established community, yet conveniently located near shopping, dining, and major roadways, 504 Hager Dr offers the perfect balance of peace and practicality. Come experience the warmth and charm for yourself—this is the kind of home that just feels right.
Build Your Team
Quickly find investor-friendly professionals who can help you succeed in real estate investing at any stage of the investing journey.


Agents
Match with investor-friendly agents who can help you find, analyze, and close your next deal


Lenders
Get the best funding…find investor-friendly lenders who specialize in your deal strategy


Property Managers
Transition to passive investing. Find a trusted property management partnership that lasts.


Tax Pros & Accountants
Taxes and financial reporting made easy—find experts to create tax savings strategies, file taxes, and more
Location
Property Details
Parking
- Description: Garage Door Opener
- Details: Attached
- Garage Spaces: 2
- Spaces Total: 0
Bedroom Information
- # of Bedrooms: 3
Bathroom Information
- # of Baths (Full): 2
- # of Baths (Total): 2.0
Interior Features
- # of Rooms: 3
- # of Stories: 1
Exterior Features
- Exterior Walls Materials: Siding (Alum/Vinyl)
- Foundation: Slab
- Roof Type: Gable or Hip
- Roof Material: Shingle
Land Information
- Land Use: Residential
- Land Use Subtype: Single Family Residential
Lot Information
- Parcel ID: 032228285200140
- Lot Size: 8963 sqft
Property Information
- Property Type: Single Family Residence
- Year Built: 1987
Tax Information
- Annual Tax: $1,711
Utilities
- Water & Sewer: Public
- Heating: Electric
- Cooling: Central Air
Location
- County: Orange
Listing Details
Investment Summary
- Monthly Cash Flow
- -$417
- Cap Rate
- 4.7%
- Cash-on-Cash Return
- -6.2%
- Debt Coverage Ratio
- 0.77
- Internal Rate of Return (5 years)
- -2.0%
Cash Flow
Net Operating Income (NOI) minus mortgage payments.
Calculation:
NOI - Mortgage Payments
Cap Rate (Market Value)
Capitalization Rate is a rate of return that compares the yearly Net Operating Income (NOI) to the market value.
Calculation:
NOI / Market Value
Cash-on-Cash Return (CoC)
Annual Cash Flow / Cash Invested
Calculation:
Annual cash flow divided by initial cash invested.
Debt Coverage Ratio (DCR)
Net Operating Income (NOI) divided by total debt payments.
Calculation:
NOI / Total Debt Payments
Internal Rate of Return (IRR)
A metric for assessing profitability over time. IRR is the discount rate at which the net present value (NPV) of all future cash flows (positive and negative) from an investment equals zero — including both periodic cash flow (such as rent) and a projected sale at the end of the holding period. It represents the expected annualized return, accounting for income, expenses, and the recovery of capital through a future sale.
Purchase Details
Purchase PriceThe price paid for the property. Purchase price:
| $349,900 |
|---|---|
Amount FinancedThe amount of the purchase financed through a loan. Amount financed:
| -$279,920 |
Down paymentThe initial payment made towards the purchase. Down payment:
| $69,980 |
Closing CostsFees and expenses associated with purchasing a property, typically ranging from 2% to 5% of the home’s purchase price, paid at the end of a home purchase to cover services like lending, title transfer, and taxes. Closing costs:
| $10,497 |
Rehab CostsCosts incurred to repair or improve the property, including: roof, flooring, exterior siding, kitchen, exterior paint, bathrooms, etc. Rehab costs:
| $0 |
Initial Cash InvestedThe total initial cash invested in the property. Calculation:Down payment + Buying costs + Rehab costs Initial cash invested:
| $80,477 |
Square Feet (SQFT)The total square footage of the property. Square feet:
| 1,371 |
Cost Per Square FootCost per square foot of the property. Calculation:Purchase Price / Square Feet Cost per square foot:
| $255 |
Monthly Rent Per Square FootMonthly rent divided by the number of square feet. This ratio helps investors compare rental income efficiency across properties, markets, and unit sizes Calculation:Monthly Rent / Square Feet Monthly rent per square foot:
| $1.60 |
Financing Details
Loan AmountThe total sum of money borrowed from a lender to finance a property purchase. Calculation:Purchase Price - Down Payment
Loan amount:
| $279,920 |
|---|---|
Loan to Value Ratio (LTV)Loan amount divided by the market value of the property. Calculation:Loan Amount / Market Value
Loan to value ratio:
| 80.0% |
Loan TypeThe type of loan (e.g., fixed, adjustable).
Loan type:
| Amortizing |
TermThe loan repayment period in years.
Term:
| 30 years |
Interest RateThe percentage a lender charges on the borrowed amount of a loan, determining the cost of borrowing money.
Interest rate:
| 6.625% |
Principal & Interest (PI)The principal is the portion of the loan payment that reduces the loan balance. The interest is the lender's charge for borrowing money. Calculation:(P * r * (1 + r) ** n) / ((1 + r) ** n - 1) Where:
P = Loan amount (principal)
Principal & interest:
| $1,792 |
Property TaxesAnnual taxes levied by local governments on real estate properties. These taxes fund public services like schools, roads, and emergency services.
Property tax:
| $143 |
InsuranceThe costs for insurance coverage to protect against financial losses due to risks like fire, natural disasters, theft, liability, or tenant-related damages. Calculation:Assumes 7% of gross rental income, unless insurance rates are specified.
Insurance:
| $154 |
Private Mortgage Insurance (PMI)A fee that borrowers pay when they take out a conventional loan with a loan-to-value (LTV) ratio above 80%.
Private mortgage insurance (PMI):
| $0 |
Monthly PaymentThe fixed amount a borrower pays each month to repay a loan. It typically includes principal and interest (P&I) and may also cover property taxes, insurance, HOA fees, and PMI if escrowed. Monthly payment:
| $2,089 |
Operating Income
| % Rent | Monthly | Yearly | |
|---|---|---|---|
Gross RentThe total rental income received from tenants before deducting any expenses. Includes base rent, late fees, pet fees, parking fees, and other recurring charges.
Gross rent:
| $2,200 | $26,400 | |
Vacancy LossExpected loss of rent due to vacancies.
Vacancy loss:
(6%)
| 6% | -$132 | -$1,584 |
Operating IncomeGross rental income minus vacancy loss. Calculation:Gross rent - Vacancy loss
Operating income:
| $2,068 | $24,816 |
Operating Expenses
| % Rent | Monthly | Yearly | |
|---|---|---|---|
Property TaxesAnnual taxes levied by local governments on real estate properties. These taxes fund public services like schools, roads, and emergency services. | 6% | -$143 | -$1,711 |
InsuranceThe costs for insurance coverage to protect against financial losses due to risks like fire, natural disasters, theft, liability, or tenant-related damages. Calculation:Assumes 7% of gross rental income, unless insurance rates are specified. | 7% | -$154 | -$1,848 |
Property ManagementThe costs associated with hiring a property manager to handle the day-to-day operations of a rental property. Includes management fees, leasing fes, eviction fees, etc. Calculation:Assumes 8% of gross rental income. | 8% | -$176 | -$2,112 |
Repairs & MaintenanceOngoing costs for routine upkeep and minor fixes needed to keep a property in good working condition. Calculation:Assumes 5% of gross rental income. Varies by property age and condition. | 5% | -$110 | -$1,320 |
Capital ExpensesLarge, infrequent costs for major improvements or replacements, like a new roof, HVAC system, or appliances. Calculation:Assumes 5% of gross rental income. Varies by property age. | 5% | -$110 | -$1,320 |
HOA FeesRegular dues paid to a Homeowners Association for community maintenance, amenities, and management. Similar fees include: Condo Association Fees, Co-op Maintenance Fees, etc. | n/a | n/a | n/a |
Operating ExpensesRecurring costs required to maintain and manage a rental property, including property taxes, insurance, maintenance, repairs, utilities (if paid by the owner), property management fees, and other day-to-day expenses. Calculation:Insurance + Property Taxes + Property Management + Repairs & Maintenance + Capital Expenditures + HOA Fees | 31% | -$693 | -$8,311 |
Cash Flow
| Monthly | Yearly | |
|---|---|---|
Net Operating Income (NOI)The income generated from a property after deducting all operating expenses but before deducting mortgage payments, taxes, and capital expenditures. Calculation:Gross Operating Income - Operating Expenses
Net operating income:
| $1,375 | $16,500 |
Mortgage PaymentThe fixed amount a borrower pays each month to repay a loan. It typically includes principal and interest (P&I) and may also cover property taxes, insurance, HOA fees, and PMI if escrowed. | -$1,792 | -$21,504 |
Cash FlowNet Operating Income (NOI) minus mortgage payments. Calculation:NOI - Mortgage Payments | $417 | $5,004 |