$1,725,000
Investment Summary
- Monthly Cash Flow
- -$6,416
- Cap Rate
- 1.7%
- Cash-on-Cash Return
- -19.4%
- Debt Coverage Ratio
- 0.27
- Internal Rate of Return (5 years)
- -14.7%
Cash Flow
Net Operating Income (NOI) minus mortgage payments.
Calculation:
NOI - Mortgage Payments
Cap Rate (Market Value)
Capitalization Rate is a rate of return that compares the yearly Net Operating Income (NOI) to the market value.
Calculation:
NOI / Market Value
Cash-on-Cash Return (CoC)
Annual Cash Flow / Cash Invested
Calculation:
Annual cash flow divided by initial cash invested.
Debt Coverage Ratio (DCR)
Net Operating Income (NOI) divided by total debt payments.
Calculation:
NOI / Total Debt Payments
Internal Rate of Return (IRR)
A metric for assessing profitability over time. IRR is the discount rate at which the net present value (NPV) of all future cash flows (positive and negative) from an investment equals zero — including both periodic cash flow (such as rent) and a projected sale at the end of the holding period. It represents the expected annualized return, accounting for income, expenses, and the recovery of capital through a future sale.
Property Description
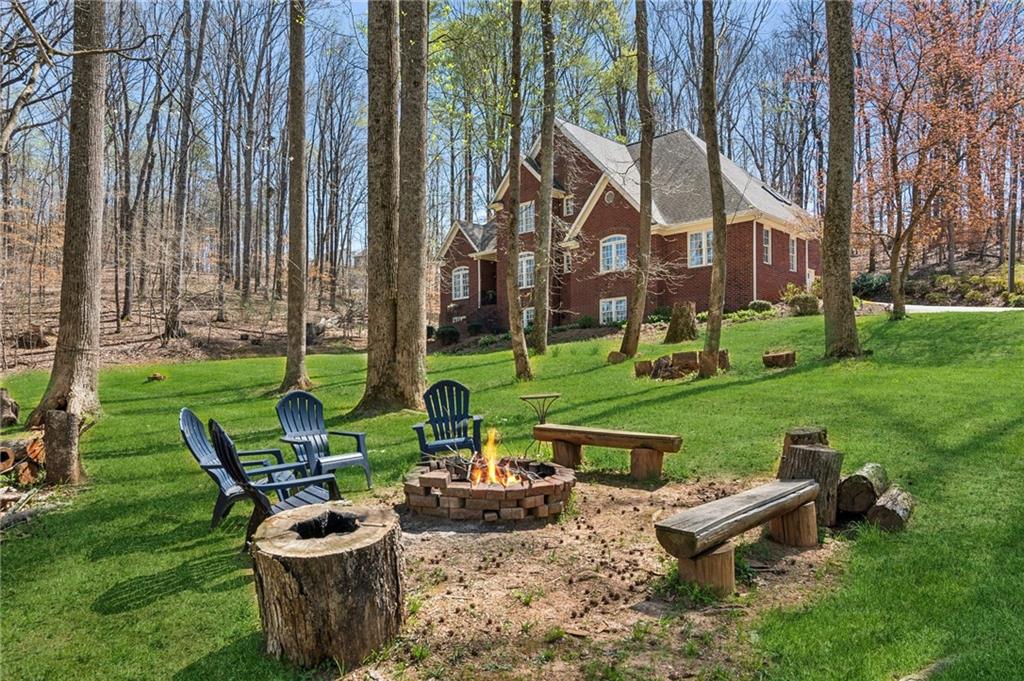
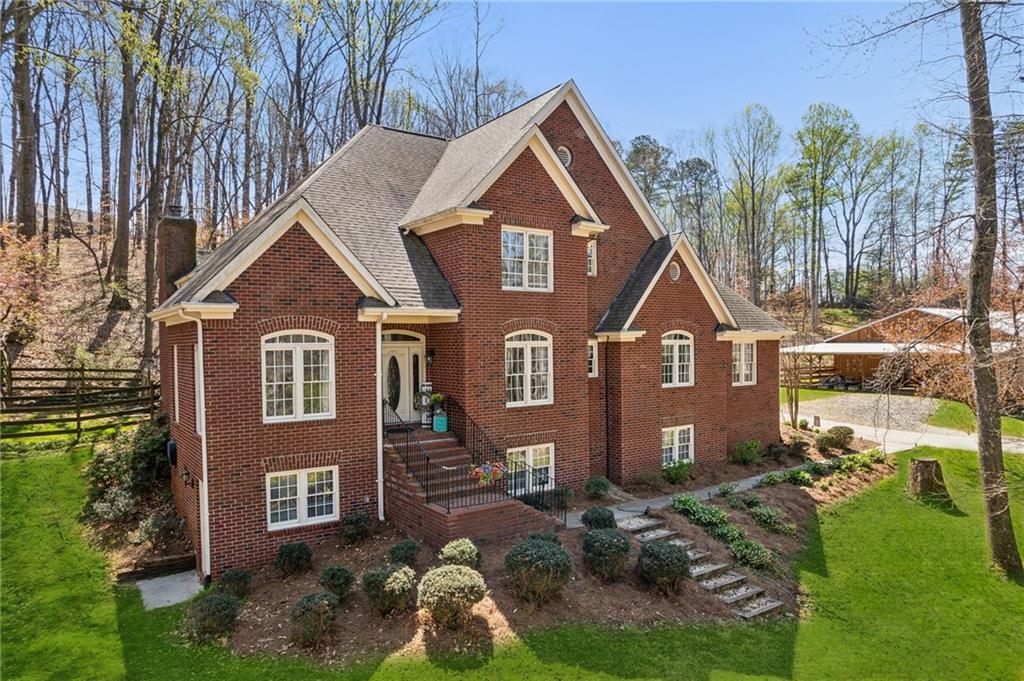
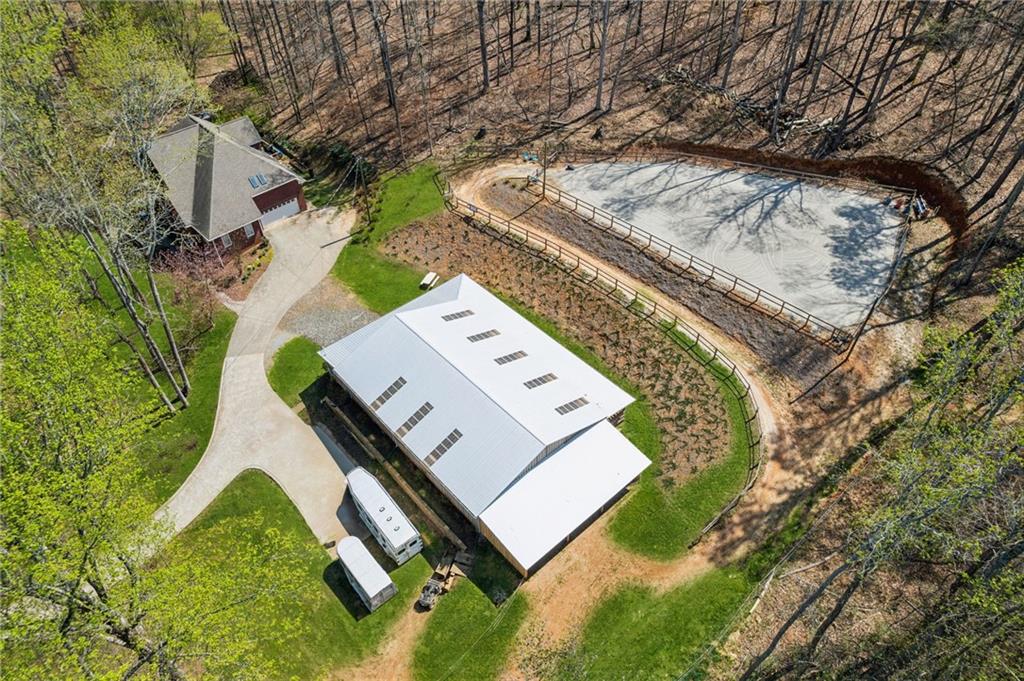
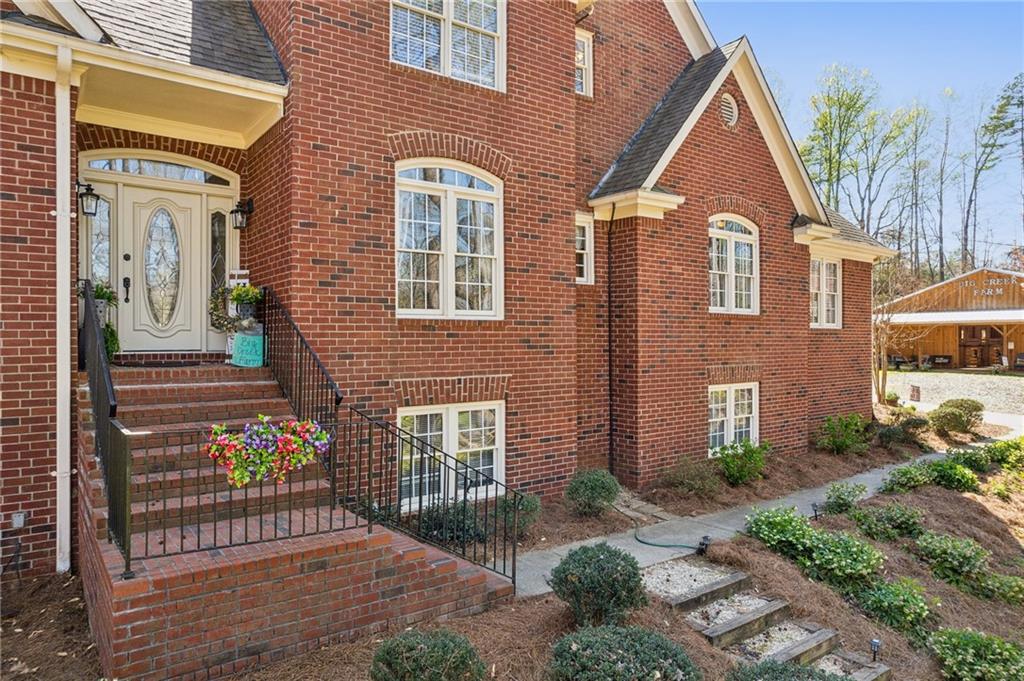
Tucked away in the heart of Hall County with a coveted Buford City address, this private 13 acre equestrian retreat offers the perfect blend of serene country living and urban convenience. Just minutes from the Mall of Georgia, a short drive to Lake Lanier for watersports, and within easy reach of the North Georgia mountains, this property provides an ideal balance of recreation, relaxation, and accessibility. Located within the award-winning Buford City School District, the 4 sided brick 4-bedroom, 3.5-bath home features a main-level master suite and is designed for both personal enjoyment and income potential, whether as a private farm or a boarding facility. Spanning five fenced and cross-fenced pastures, the property is well equipped with horse wire and electric rope fencing, including a large run-in shed with feeding access windows in Field 3. The arena, situated on the hill above the main barn, boasts M10 footing, lights, excellent drainage, and natural shade throughout the day. Enjoy scenic horseback riding, ATV, and biking trails winding through the landscape, as well as access to a creek with swimming holes, perfect for both horses and riders. Additional features include two chicken coops with runs and perimeter fencing, a shaded, fenced backyard off the deck ideal for children and pets, a trailer parking pad, and a separate gravel driveway leading to the main barn. A fenced driveway with an underground doorbell connects directly to the farmhouse, ensuring security and privacy. The main barn (88x52) is thoughtfully designed with eight stalls featuring M10 drainage, mats, fans, and 12x12 runs with windows, allowing for natural light through overhead skylights and metal stall caps providing easy cleaning and protection. This barn also includes an extra-large foaling stall run connected to the first stall, a wash rack with drainage, a sealed tack room, a separate feed room, and a hay/equipment shed. Security is paramount, with cameras installed throughout. The entire barn is fully wired with lights and outlets, all GFCI protected, with metal-clad wiring to guard against rodent damage and metal outlets and switch housings for enhanced durability. The lower barn (34x48) offers an additional six stalls, all benefiting from overhead skylights for natural light, along with hay storage and an enclosed tack room. With its limitless potential, this exceptional equestrian estate is a rare find in Buford, offering a unique opportunity for a family farm, boarding business, or personal retreat. Don’t miss the chance to make this versatile and beautifully maintained property your own!
Build Your Team
Quickly find investor-friendly professionals who can help you succeed in real estate investing at any stage of the investing journey.


Agents
Match with investor-friendly agents who can help you find, analyze, and close your next deal


Lenders
Get the best funding…find investor-friendly lenders who specialize in your deal strategy


Property Managers
Transition to passive investing. Find a trusted property management partnership that lasts.


Tax Pros & Accountants
Taxes and financial reporting made easy—find experts to create tax savings strategies, file taxes, and more
Location
Property Details
Parking
- Description: Attached, Garage, Garage Door Opener, Garage Faces Side
- Details: Garage
- Garage Spaces: 2
- Spaces Total: 0
Bedroom Information
- # of Bedrooms: 4
Bathroom Information
- # of Baths (Full): 3
- # of Baths (Partial): 1
- # of Baths (Total): 4.0
Interior Features
- # of Rooms: 8
- # of Stories: 2
- Basement: Yes
- Basement Description: Bath/Stubbed, Daylight, Exterior Entry, Full, Interior Entry, Unfinished
- Fireplace: Yes
Exterior Features
- Exterior Walls Materials: Brick
- Foundation: Concrete Perimeter, Slab
- Roof Type: Gable or Hip
- Roof Material: Composition
Land Information
- Land Use: Residential
- Land Use Subtype: Single Family Residential
Lot Information
- Parcel ID: 08151002005
- Lot Size: 0 sqft
Property Information
- Property Type: Single Family Residence
- Style: Farmhouse, Traditional
- Year Built: 1996
Tax Information
- Annual Tax: $4,904
Utilities
- Water & Sewer: Private, Public, Well
- Heating: Natural Gas
- Cooling: Ceiling Fan(s), Central Air
Location
- County: Hall
Listing Details
Investment Summary
- Monthly Cash Flow
- -$6,416
- Cap Rate
- 1.7%
- Cash-on-Cash Return
- -19.4%
- Debt Coverage Ratio
- 0.27
- Internal Rate of Return (5 years)
- -14.7%
Cash Flow
Net Operating Income (NOI) minus mortgage payments.
Calculation:
NOI - Mortgage Payments
Cap Rate (Market Value)
Capitalization Rate is a rate of return that compares the yearly Net Operating Income (NOI) to the market value.
Calculation:
NOI / Market Value
Cash-on-Cash Return (CoC)
Annual Cash Flow / Cash Invested
Calculation:
Annual cash flow divided by initial cash invested.
Debt Coverage Ratio (DCR)
Net Operating Income (NOI) divided by total debt payments.
Calculation:
NOI / Total Debt Payments
Internal Rate of Return (IRR)
A metric for assessing profitability over time. IRR is the discount rate at which the net present value (NPV) of all future cash flows (positive and negative) from an investment equals zero — including both periodic cash flow (such as rent) and a projected sale at the end of the holding period. It represents the expected annualized return, accounting for income, expenses, and the recovery of capital through a future sale.
Purchase Details
Purchase PriceThe price paid for the property. Purchase price:
| $1,725,000 |
|---|---|
Amount FinancedThe amount of the purchase financed through a loan. Amount financed:
| -$1,380,000 |
Down paymentThe initial payment made towards the purchase. Down payment:
| $345,000 |
Closing CostsFees and expenses associated with purchasing a property, typically ranging from 2% to 5% of the home’s purchase price, paid at the end of a home purchase to cover services like lending, title transfer, and taxes. Closing costs:
| $51,750 |
Rehab CostsCosts incurred to repair or improve the property, including: roof, flooring, exterior siding, kitchen, exterior paint, bathrooms, etc. Rehab costs:
| $0 |
Initial Cash InvestedThe total initial cash invested in the property. Calculation:Down payment + Buying costs + Rehab costs Initial cash invested:
| $396,750 |
Square Feet (SQFT)The total square footage of the property. Square feet:
| 3,450 |
Cost Per Square FootCost per square foot of the property. Calculation:Purchase Price / Square Feet Cost per square foot:
| $500 |
Monthly Rent Per Square FootMonthly rent divided by the number of square feet. This ratio helps investors compare rental income efficiency across properties, markets, and unit sizes Calculation:Monthly Rent / Square Feet Monthly rent per square foot:
| $1.19 |
Financing Details
Loan AmountThe total sum of money borrowed from a lender to finance a property purchase. Calculation:Purchase Price - Down Payment
Loan amount:
| $1,380,000 |
|---|---|
Loan to Value Ratio (LTV)Loan amount divided by the market value of the property. Calculation:Loan Amount / Market Value
Loan to value ratio:
| 80.0% |
Loan TypeThe type of loan (e.g., fixed, adjustable).
Loan type:
| Amortizing |
TermThe loan repayment period in years.
Term:
| 30 years |
Interest RateThe percentage a lender charges on the borrowed amount of a loan, determining the cost of borrowing money.
Interest rate:
| 6.625% |
Principal & Interest (PI)The principal is the portion of the loan payment that reduces the loan balance. The interest is the lender's charge for borrowing money. Calculation:(P * r * (1 + r) ** n) / ((1 + r) ** n - 1) Where:
P = Loan amount (principal)
Principal & interest:
| $8,836 |
Property TaxesAnnual taxes levied by local governments on real estate properties. These taxes fund public services like schools, roads, and emergency services.
Property tax:
| $409 |
InsuranceThe costs for insurance coverage to protect against financial losses due to risks like fire, natural disasters, theft, liability, or tenant-related damages. Calculation:Assumes 7% of gross rental income, unless insurance rates are specified.
Insurance:
| $287 |
Private Mortgage Insurance (PMI)A fee that borrowers pay when they take out a conventional loan with a loan-to-value (LTV) ratio above 80%.
Private mortgage insurance (PMI):
| $0 |
Monthly PaymentThe fixed amount a borrower pays each month to repay a loan. It typically includes principal and interest (P&I) and may also cover property taxes, insurance, HOA fees, and PMI if escrowed. Monthly payment:
| $9,532 |
Operating Income
| % Rent | Monthly | Yearly | |
|---|---|---|---|
Gross RentThe total rental income received from tenants before deducting any expenses. Includes base rent, late fees, pet fees, parking fees, and other recurring charges.
Gross rent:
| $4,100 | $49,200 | |
Vacancy LossExpected loss of rent due to vacancies.
Vacancy loss:
(6%)
| 6% | -$246 | -$2,952 |
Operating IncomeGross rental income minus vacancy loss. Calculation:Gross rent - Vacancy loss
Operating income:
| $3,854 | $46,248 |
Operating Expenses
| % Rent | Monthly | Yearly | |
|---|---|---|---|
Property TaxesAnnual taxes levied by local governments on real estate properties. These taxes fund public services like schools, roads, and emergency services. | 10% | -$409 | -$4,904 |
InsuranceThe costs for insurance coverage to protect against financial losses due to risks like fire, natural disasters, theft, liability, or tenant-related damages. Calculation:Assumes 7% of gross rental income, unless insurance rates are specified. | 7% | -$287 | -$3,444 |
Property ManagementThe costs associated with hiring a property manager to handle the day-to-day operations of a rental property. Includes management fees, leasing fes, eviction fees, etc. Calculation:Assumes 8% of gross rental income. | 8% | -$328 | -$3,936 |
Repairs & MaintenanceOngoing costs for routine upkeep and minor fixes needed to keep a property in good working condition. Calculation:Assumes 5% of gross rental income. Varies by property age and condition. | 5% | -$205 | -$2,460 |
Capital ExpensesLarge, infrequent costs for major improvements or replacements, like a new roof, HVAC system, or appliances. Calculation:Assumes 5% of gross rental income. Varies by property age. | 5% | -$205 | -$2,460 |
HOA FeesRegular dues paid to a Homeowners Association for community maintenance, amenities, and management. Similar fees include: Condo Association Fees, Co-op Maintenance Fees, etc. | n/a | n/a | n/a |
Operating ExpensesRecurring costs required to maintain and manage a rental property, including property taxes, insurance, maintenance, repairs, utilities (if paid by the owner), property management fees, and other day-to-day expenses. Calculation:Insurance + Property Taxes + Property Management + Repairs & Maintenance + Capital Expenditures + HOA Fees | 35% | -$1,434 | -$17,204 |
Cash Flow
| Monthly | Yearly | |
|---|---|---|
Net Operating Income (NOI)The income generated from a property after deducting all operating expenses but before deducting mortgage payments, taxes, and capital expenditures. Calculation:Gross Operating Income - Operating Expenses
Net operating income:
| $2,420 | $29,040 |
Mortgage PaymentThe fixed amount a borrower pays each month to repay a loan. It typically includes principal and interest (P&I) and may also cover property taxes, insurance, HOA fees, and PMI if escrowed. | -$8,836 | -$106,032 |
Cash FlowNet Operating Income (NOI) minus mortgage payments. Calculation:NOI - Mortgage Payments | -$6,416 | -$76,992 |