
$785,000
Investment Summary
- Monthly Cash Flow
- -$1,469
- Cap Rate
- 3.9%
- Cash-on-Cash Return
- -9.8%
- Debt Coverage Ratio
- 0.63
- Internal Rate of Return (5 years)
- -5.5%
Cash Flow
Net Operating Income (NOI) minus mortgage payments.
Calculation:
NOI - Mortgage Payments
Cap Rate (Market Value)
Capitalization Rate is a rate of return that compares the yearly Net Operating Income (NOI) to the market value.
Calculation:
NOI / Market Value
Cash-on-Cash Return (CoC)
Annual Cash Flow / Cash Invested
Calculation:
Annual cash flow divided by initial cash invested.
Debt Coverage Ratio (DCR)
Net Operating Income (NOI) divided by total debt payments.
Calculation:
NOI / Total Debt Payments
Internal Rate of Return (IRR)
A metric for assessing profitability over time. IRR is the discount rate at which the net present value (NPV) of all future cash flows (positive and negative) from an investment equals zero — including both periodic cash flow (such as rent) and a projected sale at the end of the holding period. It represents the expected annualized return, accounting for income, expenses, and the recovery of capital through a future sale.
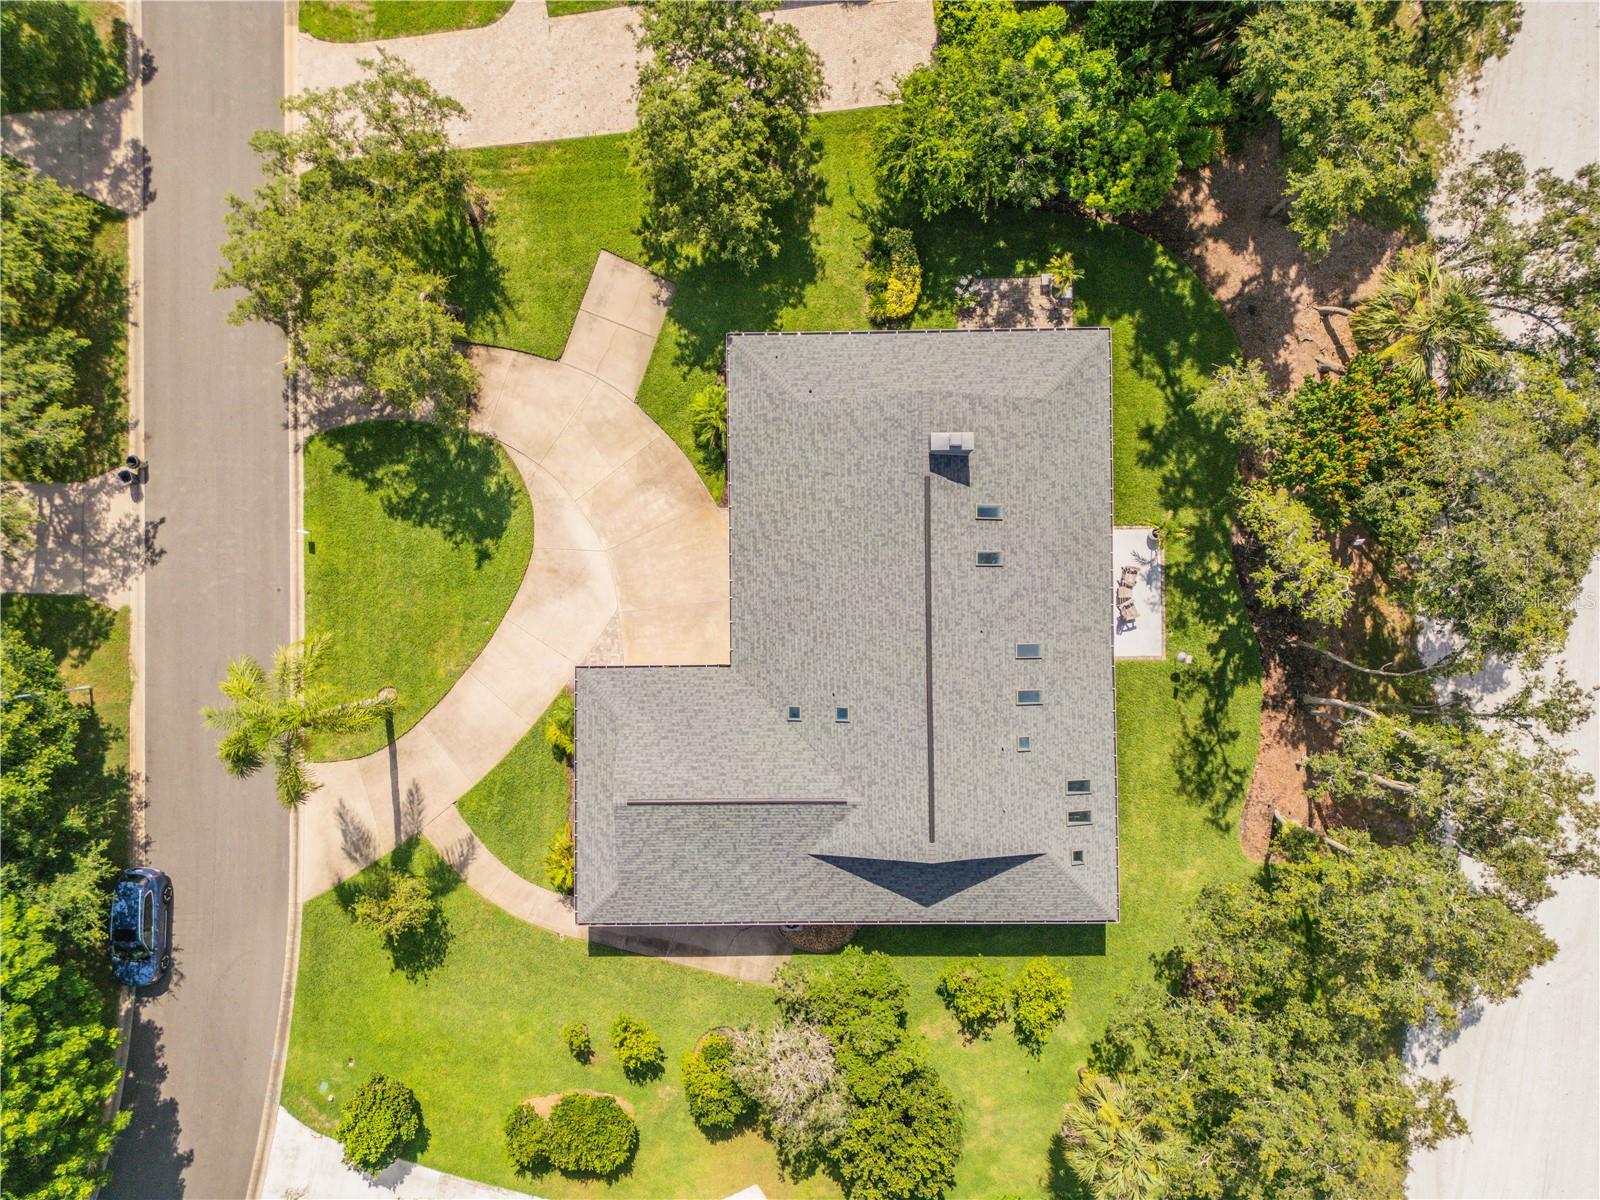
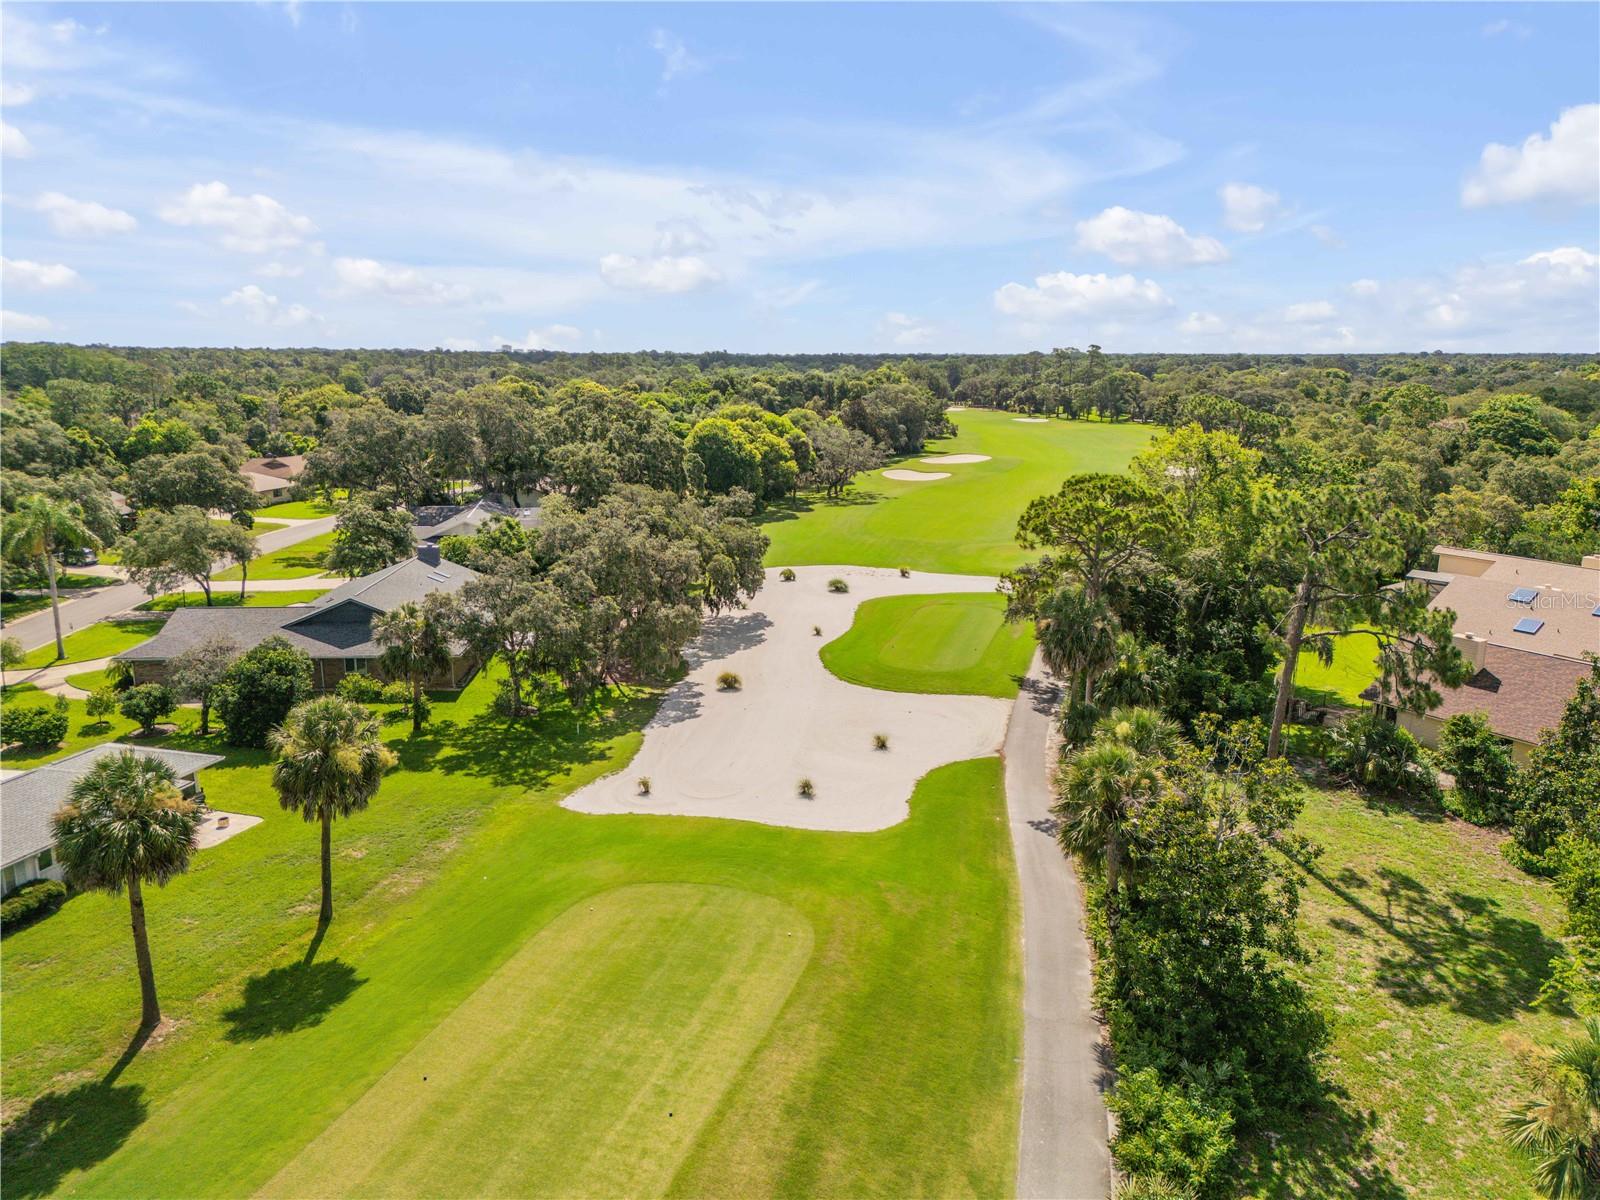
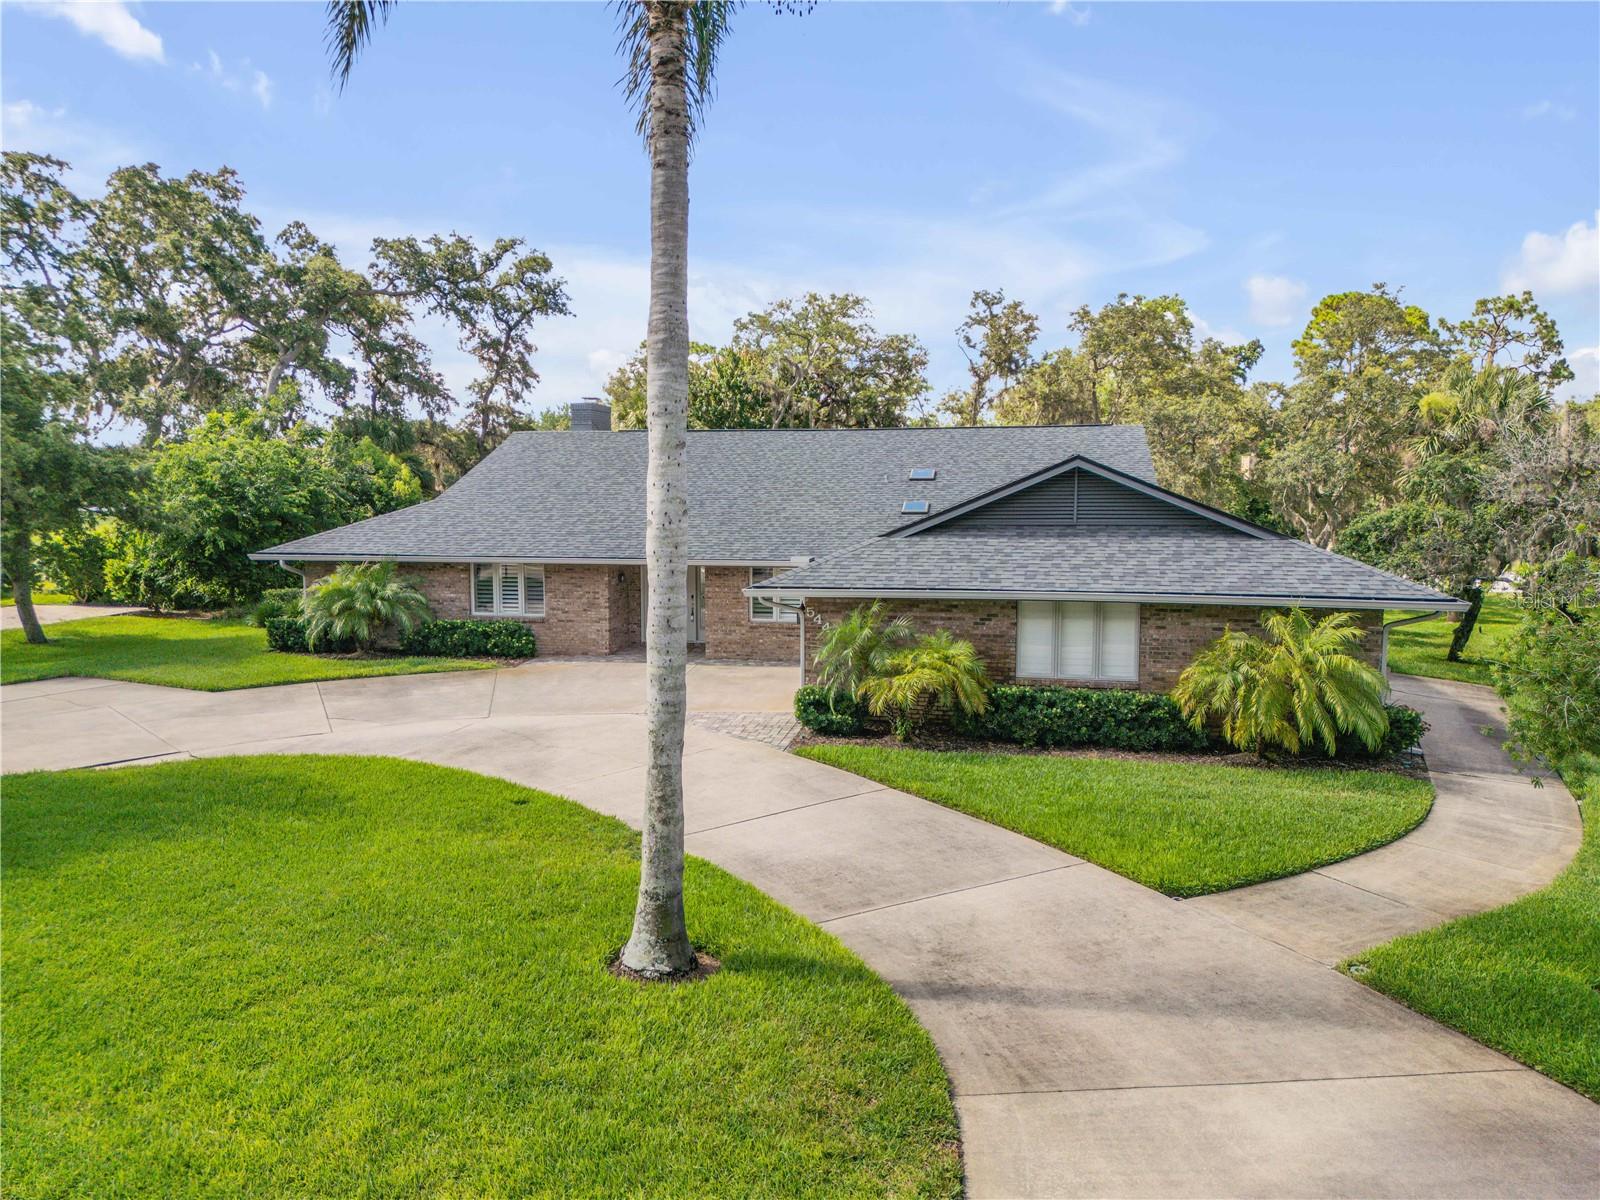
Property Description
This fully remodeled home in Sugar Mill Country Club offers all the comforts imaginable, abundant space, and sweeping golf course views, all beautifully situated near the tee box of Hole #6 on the Red Course. Renovated from top to bottom in 2020, the home features a new roof with 10 brand-new skylights, infusing the interiors with natural light. The open-concept layout is ideal for entertaining and daily living, with porcelain tile flooring, neutral tones, and plantation shutters throughout. The gourmet kitchen is a showstopper, featuring quartz countertops, stainless steel appliances, a large center island, eat-in nook, and a walk-in pantry. Thoughtfully designed hidden storage is found in the kitchen cabinetry, pantry, hallway closets, and even in the spacious, floored attic for all your extras. WARNING.....there is TONS and TONS of storage in this home. The living room showcases a gas fireplace with a brick accent wall and opens through a 4-panel sliding door to a screened-in lanai with panoramic golf course views. Outside, enjoy a wood-look tiled patio with ceiling fans, plus an additional pavered patio equipped with a natural gas hookup for grilling. Front and rear landscape lighting, including uplighting on the backyard oak trees, provides a resort-style feel in the evening. The Primary Suite is oversized and designed for relaxation, with direct patio access and a spa-like bath featuring dual vanities, dual shower heads, double skylights, and a window for open-air ambiance. A generous walk-in closet completes the retreat. Both guest bedrooms are exceptionally large, each accommodating a California King bed, with one offering private patio access. The guest bath features a walk-in shower, double vanity, and extra storage including a linen closet and deep hallway closet for climate-sensitive items. The home also includes a versatile bonus room, which is ideal as a home office, den, or media room, paired with a nearby half bath. The adjacent laundry room, tucked behind a frosted barn door, offers a wash sink, hanging space, storage closet, and natural skylight. The oversized 2-car garage includes golf cart parking, and the attic above is fully floored for even more storage. A wide circular drive offers generous guest parking. As an added bonus, the tastefully curated furnishings have been thoughtfully laid out to complement the home's flow and design, and may be negotiable with the right offer, allowing for a seamless, move-in-ready transition. Sugar Mill Country Club is a premier private community featuring 27 championship holes designed by Joe Lee, with optional membership tiers that include golf, tennis, pickleball, dining, fitness, and pool. Major updates include: • NEW Roof & 10 Skylights (2022) • NEW A/C (2022) • Gas Water Heater (2020) • Full Home Remodel (2020)
Build Your Team
Quickly find investor-friendly professionals who can help you succeed in real estate investing at any stage of the investing journey.


Agents
Match with investor-friendly agents who can help you find, analyze, and close your next deal


Lenders
Get the best funding…find investor-friendly lenders who specialize in your deal strategy


Property Managers
Transition to passive investing. Find a trusted property management partnership that lasts.


Tax Pros & Accountants
Taxes and financial reporting made easy—find experts to create tax savings strategies, file taxes, and more
Location
Property Details
Parking
- Description: Circular Driveway, Driveway, Garage Door Opener, Garage Faces Side, Golf Cart Garage, Golf Cart Parking, Off Street, Parking Pad, Workshop in Garage
- Details: Circular Driveway, Driveway, Garage Door Opener, Garage Faces Side, Golf Cart Garage, Off Street, Attached
- Garage Spaces: 2
- Spaces Total: 0
Bedroom Information
- # of Bedrooms: 3
Bathroom Information
- # of Baths (Full): 2
- # of Baths (Partial): 1
- # of Baths (Total): 3.0
Interior Features
- # of Rooms: 11
- # of Stories: 1
- Fireplace: Yes
Exterior Features
- Exterior Walls Materials: Brick
- Foundation: Slab
- Roof Type: Hip
- Roof Material: Shingle
HOA
- Has HOA: Yes
- Association: Karla Baumann
- HOA Fee: $591/annually
Land Information
- Land Use: Residential
- Land Use Subtype: Single Family Residential
Lot Information
- Parcel ID: 734209000040
- Lot Size: 16120 sqft
Property Information
- Property Type: Single Family Residence
- Year Built: 1987
Tax Information
- Annual Tax: $5,215
Utilities
- Water & Sewer: Public
- Heating: Central, Electric, Natural Gas
- Cooling: Central Air
Location
- County: Volusia
Listing Details
Investment Summary
- Monthly Cash Flow
- -$1,469
- Cap Rate
- 3.9%
- Cash-on-Cash Return
- -9.8%
- Debt Coverage Ratio
- 0.63
- Internal Rate of Return (5 years)
- -5.5%
Cash Flow
Net Operating Income (NOI) minus mortgage payments.
Calculation:
NOI - Mortgage Payments
Cap Rate (Market Value)
Capitalization Rate is a rate of return that compares the yearly Net Operating Income (NOI) to the market value.
Calculation:
NOI / Market Value
Cash-on-Cash Return (CoC)
Annual Cash Flow / Cash Invested
Calculation:
Annual cash flow divided by initial cash invested.
Debt Coverage Ratio (DCR)
Net Operating Income (NOI) divided by total debt payments.
Calculation:
NOI / Total Debt Payments
Internal Rate of Return (IRR)
A metric for assessing profitability over time. IRR is the discount rate at which the net present value (NPV) of all future cash flows (positive and negative) from an investment equals zero — including both periodic cash flow (such as rent) and a projected sale at the end of the holding period. It represents the expected annualized return, accounting for income, expenses, and the recovery of capital through a future sale.
Purchase Details
Purchase PriceThe price paid for the property. Purchase price:
| $785,000 |
|---|---|
Amount FinancedThe amount of the purchase financed through a loan. Amount financed:
| -$628,000 |
Down paymentThe initial payment made towards the purchase. Down payment:
| $157,000 |
Closing CostsFees and expenses associated with purchasing a property, typically ranging from 2% to 5% of the home’s purchase price, paid at the end of a home purchase to cover services like lending, title transfer, and taxes. Closing costs:
| $23,550 |
Rehab CostsCosts incurred to repair or improve the property, including: roof, flooring, exterior siding, kitchen, exterior paint, bathrooms, etc. Rehab costs:
| $0 |
Initial Cash InvestedThe total initial cash invested in the property. Calculation:Down payment + Buying costs + Rehab costs Initial cash invested:
| $180,550 |
Square Feet (SQFT)The total square footage of the property. Square feet:
| 2,731 |
Cost Per Square FootCost per square foot of the property. Calculation:Purchase Price / Square Feet Cost per square foot:
| $287 |
Monthly Rent Per Square FootMonthly rent divided by the number of square feet. This ratio helps investors compare rental income efficiency across properties, markets, and unit sizes Calculation:Monthly Rent / Square Feet Monthly rent per square foot:
| $1.61 |
Financing Details
Loan AmountThe total sum of money borrowed from a lender to finance a property purchase. Calculation:Purchase Price - Down Payment
Loan amount:
| $628,000 |
|---|---|
Loan to Value Ratio (LTV)Loan amount divided by the market value of the property. Calculation:Loan Amount / Market Value
Loan to value ratio:
| 80.0% |
Loan TypeThe type of loan (e.g., fixed, adjustable).
Loan type:
| Amortizing |
TermThe loan repayment period in years.
Term:
| 30 years |
Interest RateThe percentage a lender charges on the borrowed amount of a loan, determining the cost of borrowing money.
Interest rate:
| 6.625% |
Principal & Interest (PI)The principal is the portion of the loan payment that reduces the loan balance. The interest is the lender's charge for borrowing money. Calculation:(P * r * (1 + r) ** n) / ((1 + r) ** n - 1) Where:
P = Loan amount (principal)
Principal & interest:
| $4,021 |
Property TaxesAnnual taxes levied by local governments on real estate properties. These taxes fund public services like schools, roads, and emergency services.
Property tax:
| $435 |
InsuranceThe costs for insurance coverage to protect against financial losses due to risks like fire, natural disasters, theft, liability, or tenant-related damages. Calculation:Assumes 7% of gross rental income, unless insurance rates are specified.
Insurance:
| $308 |
Private Mortgage Insurance (PMI)A fee that borrowers pay when they take out a conventional loan with a loan-to-value (LTV) ratio above 80%.
Private mortgage insurance (PMI):
| $0 |
Monthly PaymentThe fixed amount a borrower pays each month to repay a loan. It typically includes principal and interest (P&I) and may also cover property taxes, insurance, HOA fees, and PMI if escrowed. Monthly payment:
| $4,764 |
Operating Income
| % Rent | Monthly | Yearly | |
|---|---|---|---|
Gross RentThe total rental income received from tenants before deducting any expenses. Includes base rent, late fees, pet fees, parking fees, and other recurring charges.
Gross rent:
| $4,400 | $52,800 | |
Vacancy LossExpected loss of rent due to vacancies.
Vacancy loss:
(6%)
| 6% | -$264 | -$3,168 |
Operating IncomeGross rental income minus vacancy loss. Calculation:Gross rent - Vacancy loss
Operating income:
| $4,136 | $49,632 |
Operating Expenses
| % Rent | Monthly | Yearly | |
|---|---|---|---|
Property TaxesAnnual taxes levied by local governments on real estate properties. These taxes fund public services like schools, roads, and emergency services. | 10% | -$435 | -$5,215 |
InsuranceThe costs for insurance coverage to protect against financial losses due to risks like fire, natural disasters, theft, liability, or tenant-related damages. Calculation:Assumes 7% of gross rental income, unless insurance rates are specified. | 7% | -$308 | -$3,696 |
Property ManagementThe costs associated with hiring a property manager to handle the day-to-day operations of a rental property. Includes management fees, leasing fes, eviction fees, etc. Calculation:Assumes 8% of gross rental income. | 8% | -$352 | -$4,224 |
Repairs & MaintenanceOngoing costs for routine upkeep and minor fixes needed to keep a property in good working condition. Calculation:Assumes 5% of gross rental income. Varies by property age and condition. | 5% | -$220 | -$2,640 |
Capital ExpensesLarge, infrequent costs for major improvements or replacements, like a new roof, HVAC system, or appliances. Calculation:Assumes 5% of gross rental income. Varies by property age. | 5% | -$220 | -$2,640 |
HOA FeesRegular dues paid to a Homeowners Association for community maintenance, amenities, and management. Similar fees include: Condo Association Fees, Co-op Maintenance Fees, etc. | 1% | -$49 | -$588 |
Operating ExpensesRecurring costs required to maintain and manage a rental property, including property taxes, insurance, maintenance, repairs, utilities (if paid by the owner), property management fees, and other day-to-day expenses. Calculation:Insurance + Property Taxes + Property Management + Repairs & Maintenance + Capital Expenditures + HOA Fees | 36% | -$1,584 | -$19,003 |
Cash Flow
| Monthly | Yearly | |
|---|---|---|
Net Operating Income (NOI)The income generated from a property after deducting all operating expenses but before deducting mortgage payments, taxes, and capital expenditures. Calculation:Gross Operating Income - Operating Expenses
Net operating income:
| $2,552 | $30,624 |
Mortgage PaymentThe fixed amount a borrower pays each month to repay a loan. It typically includes principal and interest (P&I) and may also cover property taxes, insurance, HOA fees, and PMI if escrowed. | -$4,021 | -$48,252 |
Cash FlowNet Operating Income (NOI) minus mortgage payments. Calculation:NOI - Mortgage Payments | $1,469 | $17,628 |