$1,490,000
Investment Summary
- Monthly Cash Flow
- -$5,018
- Cap Rate
- 2.1%
- Cash-on-Cash Return
- -17.6%
- Debt Coverage Ratio
- 0.34
- Internal Rate of Return (5 years)
- -13.0%
Cash Flow
Net Operating Income (NOI) minus mortgage payments.
Calculation:
NOI - Mortgage Payments
Cap Rate (Market Value)
Capitalization Rate is a rate of return that compares the yearly Net Operating Income (NOI) to the market value.
Calculation:
NOI / Market Value
Cash-on-Cash Return (CoC)
Annual Cash Flow / Cash Invested
Calculation:
Annual cash flow divided by initial cash invested.
Debt Coverage Ratio (DCR)
Net Operating Income (NOI) divided by total debt payments.
Calculation:
NOI / Total Debt Payments
Internal Rate of Return (IRR)
A metric for assessing profitability over time. IRR is the discount rate at which the net present value (NPV) of all future cash flows (positive and negative) from an investment equals zero — including both periodic cash flow (such as rent) and a projected sale at the end of the holding period. It represents the expected annualized return, accounting for income, expenses, and the recovery of capital through a future sale.
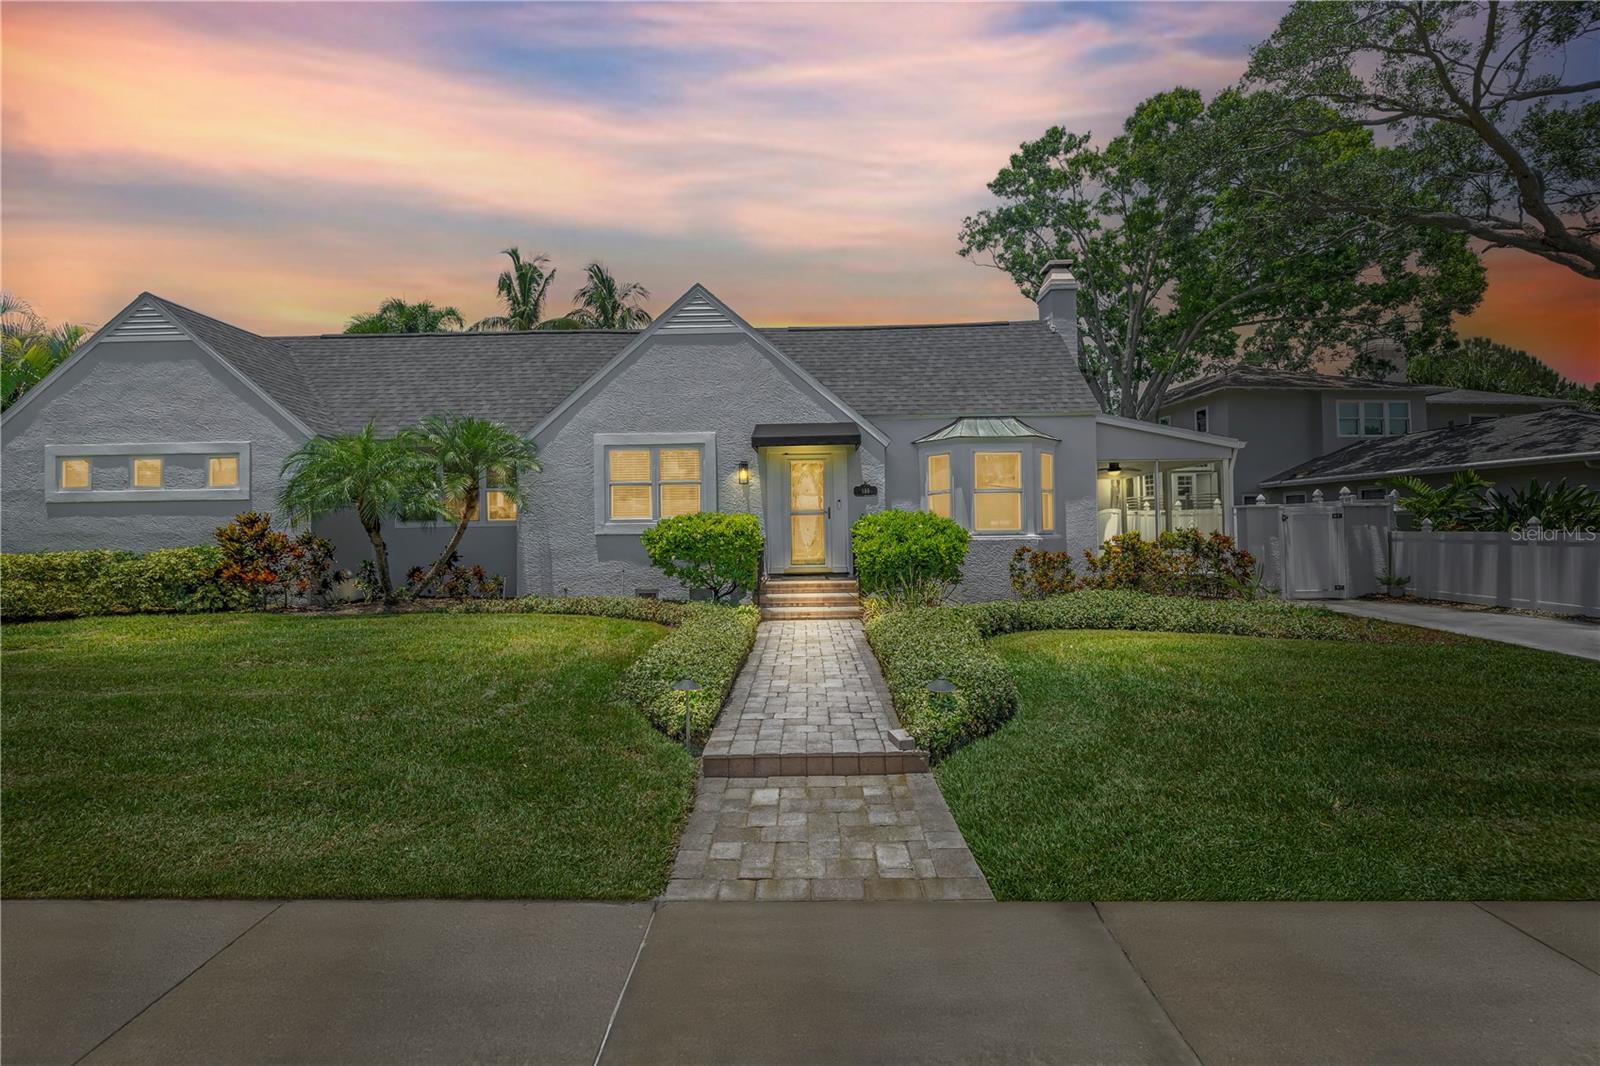
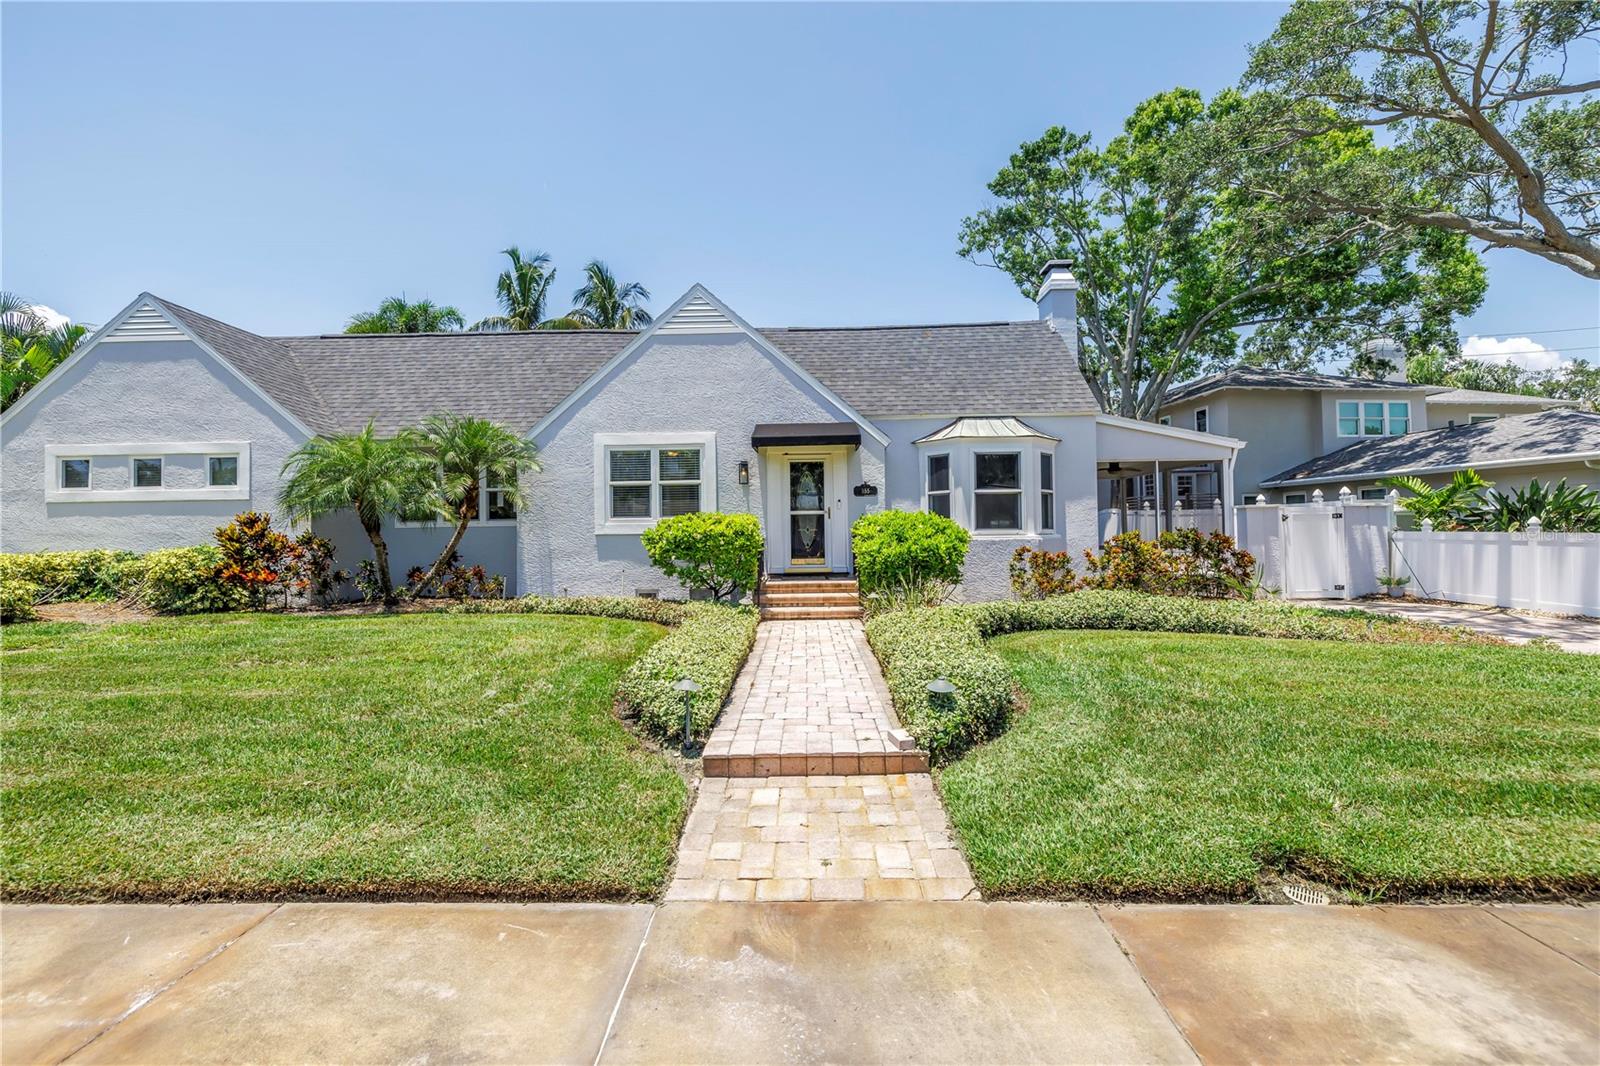
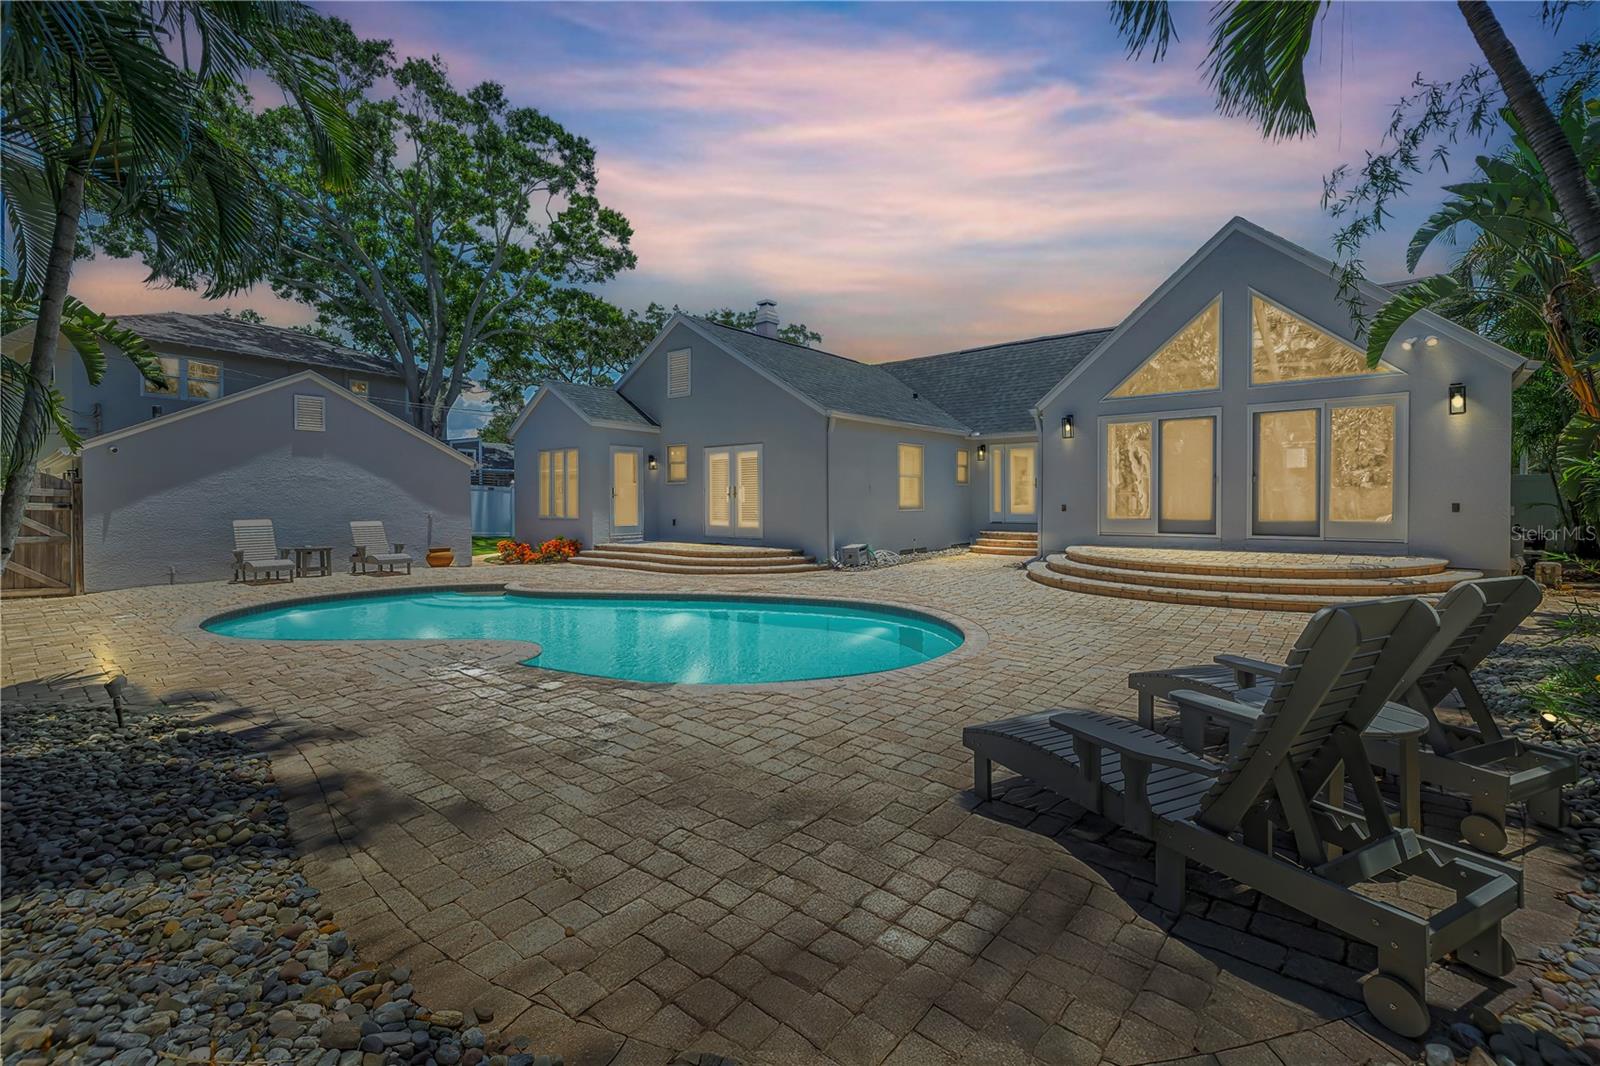
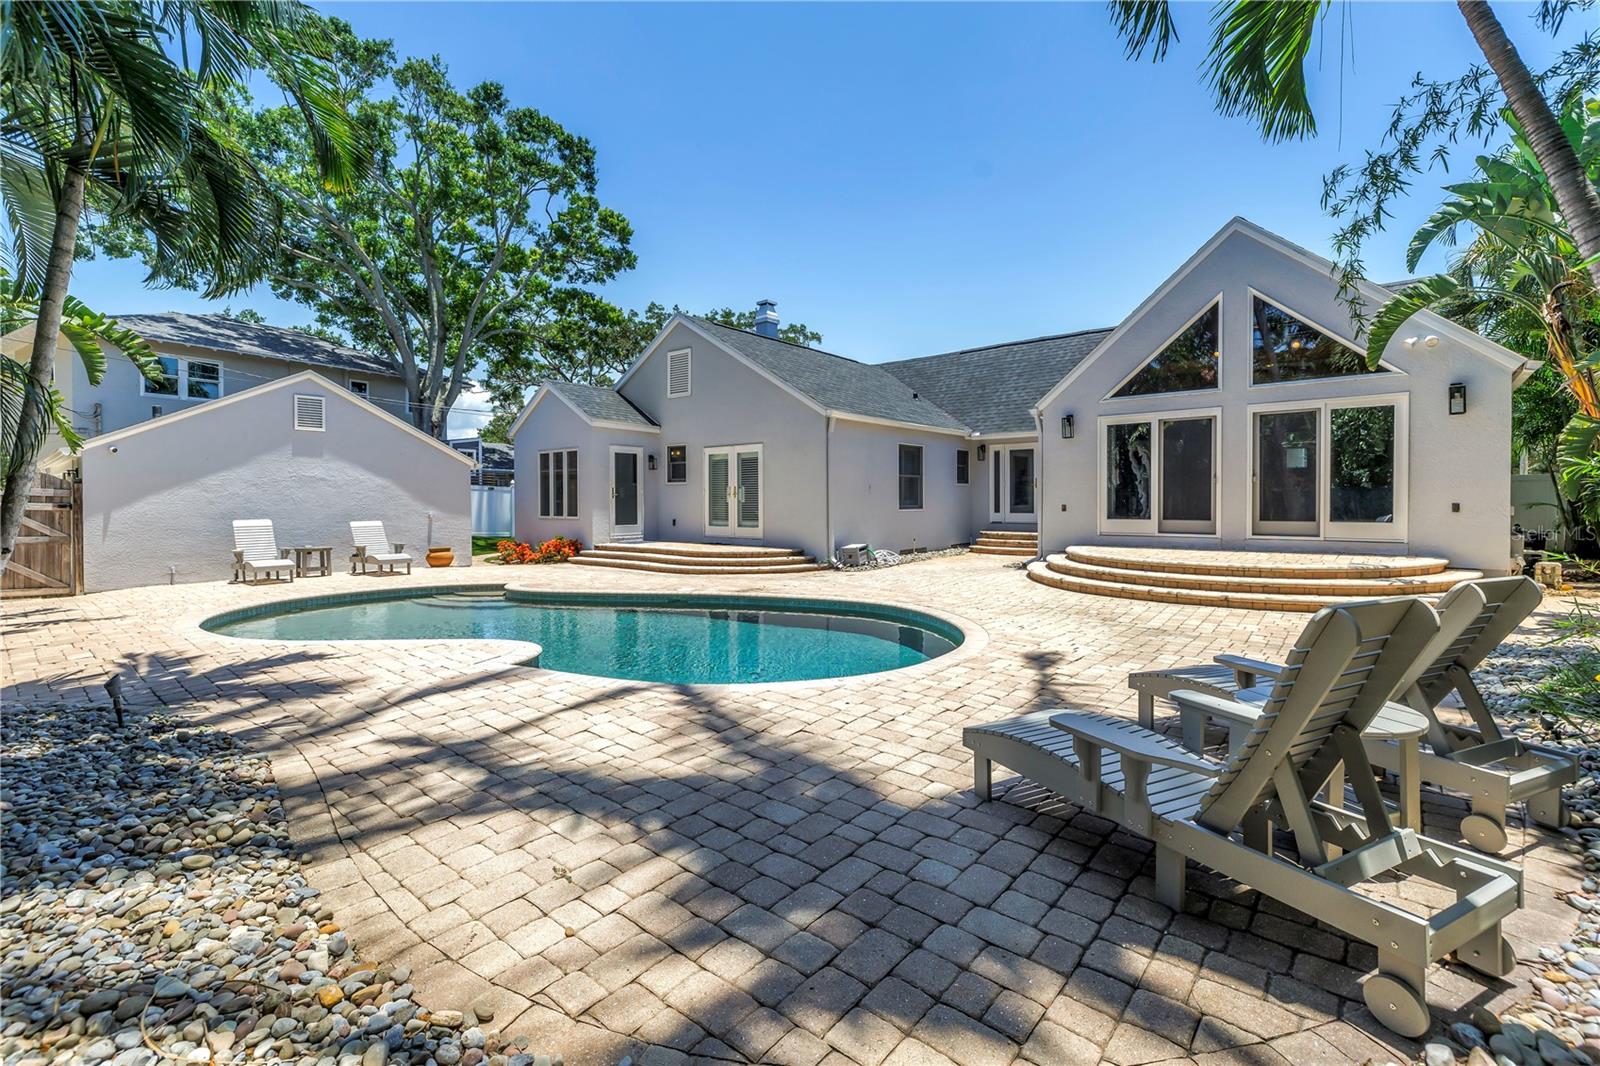
Property Description
One or more photo(s) has been virtually staged. NO Flooding or Damage here from last year’s storms, a brand new 2024 roof and other infrastructure upgrades offer peace of mind in one of St. Pete’s most cherished areas! Welcome to your slice of mid-century modern paradise nestled in one of St. Petersburg’s most iconic neighborhoods — the cobblestone-lined, palm-draped streets of Historic Old Northeast. Just one block from the shimmering waters of Coffee Pot Bayou, this home offers not only timeless architecture, but a front-row seat to Florida’s vibrant coastal lifestyle. Step inside and immediately feel the warmth of rich wood floors and thoughtful design. The living room flows effortlessly into a cozy sunroom — perfect for morning coffee or a quiet reading nook. Beyond the dining area, you’ll find a charming den that adds another layer of flexibility to the home. At the heart of the home, the kitchen is both spacious and stylish, featuring granite countertops, warm wood cabinetry, newer stainless steel appliances, and a breakfast bar. Whether you’re entertaining or enjoying a quiet meal, the kitchen's openness to the dining area and access to the pool makes it a true hub for connection. The private office, just before entering the primary suite, offers the ideal work-from-home setup with French doors leading directly to the pool — an inspiring view to keep you motivated. The oversized primary suite is a retreat in itself, with soaring vaulted ceilings, a walk-in closet (plus an additional one with laundry), and a beautifully appointed bathroom with dual vanities. And when you're ready to unwind, just step through either set of double doors and take a dip in your backyard oasis. Two more spacious bedrooms complete the home — one with its own ensuite bath and pool access, perfect for guests or a second primary. A third full bathroom is conveniently located off the hall. Step outside and you’re transported to your own tropical resort. The backyard is expansive and newly landscaped with low-maintenance turf, includes a new pool pump/filtration, lush greenery, and a sparkling pool at its center — ideal for sunny afternoons or moonlit swims. A detached two-car garage with alley access provides extra storage and functionality, while the front driveway offers additional off-street parking. And the location? Unbeatable. Just minutes by foot to Vinoy Park, North Shore Beach, and outdoor gyms, volleyball courts, and kayak launches. Dolphins and manatees are your new neighbors. Take a leisurely stroll or bike ride downtown to enjoy some of Florida’s best restaurants, arts, and nightlife. This is more than just a beautiful home — it’s your chance to be part of one of St. Pete’s most vibrant, walkable, and scenic communities. From morning sunrise strolls along the bay to evenings in your private pool, every day here feels effortless
Build Your Team
Quickly find investor-friendly professionals who can help you succeed in real estate investing at any stage of the investing journey.


Agents
Match with investor-friendly agents who can help you find, analyze, and close your next deal


Lenders
Get the best funding…find investor-friendly lenders who specialize in your deal strategy


Property Managers
Transition to passive investing. Find a trusted property management partnership that lasts.


Tax Pros & Accountants
Taxes and financial reporting made easy—find experts to create tax savings strategies, file taxes, and more
Location
Property Details
Parking
- Description: Garage
- Details: Driveway, Garage Door Opener, Garage Faces Rear, Off Street, On Street
- Garage Spaces: 2
- Spaces Total: 0
Bedroom Information
- # of Bedrooms: 3
Bathroom Information
- # of Baths (Full): 3
- # of Baths (Total): 3.0
Interior Features
- # of Rooms: 9
- # of Stories: 1
- Basement Description: Crawl Space
- Fireplace: Yes
Exterior Features
- Exterior Walls Materials: Stucco
- Roof Type: Gable
- Roof Material: Shingle
- Pool: Yes
HOA
- Association: none
Land Information
- Land Use: Residential
- Land Use Subtype: Single Family Residential
Lot Information
- Parcel ID: 173117832240370160
- Lot Size: 9997 sqft
Property Information
- Property Type: Single Family Residence
- Style: Traditional
- Year Built: 1940
Tax Information
- Annual Tax: $27,402
Utilities
- Water & Sewer: Public
- Heating: Central
- Cooling: Central Air, Attic Fan
Location
- County: Pinellas
Listing Details
Investment Summary
- Monthly Cash Flow
- -$5,018
- Cap Rate
- 2.1%
- Cash-on-Cash Return
- -17.6%
- Debt Coverage Ratio
- 0.34
- Internal Rate of Return (5 years)
- -13.0%
Cash Flow
Net Operating Income (NOI) minus mortgage payments.
Calculation:
NOI - Mortgage Payments
Cap Rate (Market Value)
Capitalization Rate is a rate of return that compares the yearly Net Operating Income (NOI) to the market value.
Calculation:
NOI / Market Value
Cash-on-Cash Return (CoC)
Annual Cash Flow / Cash Invested
Calculation:
Annual cash flow divided by initial cash invested.
Debt Coverage Ratio (DCR)
Net Operating Income (NOI) divided by total debt payments.
Calculation:
NOI / Total Debt Payments
Internal Rate of Return (IRR)
A metric for assessing profitability over time. IRR is the discount rate at which the net present value (NPV) of all future cash flows (positive and negative) from an investment equals zero — including both periodic cash flow (such as rent) and a projected sale at the end of the holding period. It represents the expected annualized return, accounting for income, expenses, and the recovery of capital through a future sale.
Purchase Details
Purchase PriceThe price paid for the property. Purchase price:
| $1,490,000 |
|---|---|
Amount FinancedThe amount of the purchase financed through a loan. Amount financed:
| -$1,192,000 |
Down paymentThe initial payment made towards the purchase. Down payment:
| $298,000 |
Closing CostsFees and expenses associated with purchasing a property, typically ranging from 2% to 5% of the home’s purchase price, paid at the end of a home purchase to cover services like lending, title transfer, and taxes. Closing costs:
| $44,700 |
Rehab CostsCosts incurred to repair or improve the property, including: roof, flooring, exterior siding, kitchen, exterior paint, bathrooms, etc. Rehab costs:
| $0 |
Initial Cash InvestedThe total initial cash invested in the property. Calculation:Down payment + Buying costs + Rehab costs Initial cash invested:
| $342,700 |
Square Feet (SQFT)The total square footage of the property. Square feet:
| 2,212 |
Cost Per Square FootCost per square foot of the property. Calculation:Purchase Price / Square Feet Cost per square foot:
| $674 |
Monthly Rent Per Square FootMonthly rent divided by the number of square feet. This ratio helps investors compare rental income efficiency across properties, markets, and unit sizes Calculation:Monthly Rent / Square Feet Monthly rent per square foot:
| $3.21 |
Financing Details
Loan AmountThe total sum of money borrowed from a lender to finance a property purchase. Calculation:Purchase Price - Down Payment
Loan amount:
| $1,192,000 |
|---|---|
Loan to Value Ratio (LTV)Loan amount divided by the market value of the property. Calculation:Loan Amount / Market Value
Loan to value ratio:
| 80.0% |
Loan TypeThe type of loan (e.g., fixed, adjustable).
Loan type:
| Amortizing |
TermThe loan repayment period in years.
Term:
| 30 years |
Interest RateThe percentage a lender charges on the borrowed amount of a loan, determining the cost of borrowing money.
Interest rate:
| 6.625% |
Principal & Interest (PI)The principal is the portion of the loan payment that reduces the loan balance. The interest is the lender's charge for borrowing money. Calculation:(P * r * (1 + r) ** n) / ((1 + r) ** n - 1) Where:
P = Loan amount (principal)
Principal & interest:
| $7,633 |
Property TaxesAnnual taxes levied by local governments on real estate properties. These taxes fund public services like schools, roads, and emergency services.
Property tax:
| $2,284 |
InsuranceThe costs for insurance coverage to protect against financial losses due to risks like fire, natural disasters, theft, liability, or tenant-related damages. Calculation:Assumes 7% of gross rental income, unless insurance rates are specified.
Insurance:
| $497 |
Private Mortgage Insurance (PMI)A fee that borrowers pay when they take out a conventional loan with a loan-to-value (LTV) ratio above 80%.
Private mortgage insurance (PMI):
| $0 |
Monthly PaymentThe fixed amount a borrower pays each month to repay a loan. It typically includes principal and interest (P&I) and may also cover property taxes, insurance, HOA fees, and PMI if escrowed. Monthly payment:
| $10,414 |
Operating Income
| % Rent | Monthly | Yearly | |
|---|---|---|---|
Gross RentThe total rental income received from tenants before deducting any expenses. Includes base rent, late fees, pet fees, parking fees, and other recurring charges.
Gross rent:
| $7,100 | $85,200 | |
Vacancy LossExpected loss of rent due to vacancies.
Vacancy loss:
(6%)
| 6% | -$426 | -$5,112 |
Operating IncomeGross rental income minus vacancy loss. Calculation:Gross rent - Vacancy loss
Operating income:
| $6,674 | $80,088 |
Operating Expenses
| % Rent | Monthly | Yearly | |
|---|---|---|---|
Property TaxesAnnual taxes levied by local governments on real estate properties. These taxes fund public services like schools, roads, and emergency services. | 32% | -$2,284 | -$27,402 |
InsuranceThe costs for insurance coverage to protect against financial losses due to risks like fire, natural disasters, theft, liability, or tenant-related damages. Calculation:Assumes 7% of gross rental income, unless insurance rates are specified. | 7% | -$497 | -$5,964 |
Property ManagementThe costs associated with hiring a property manager to handle the day-to-day operations of a rental property. Includes management fees, leasing fes, eviction fees, etc. Calculation:Assumes 8% of gross rental income. | 8% | -$568 | -$6,816 |
Repairs & MaintenanceOngoing costs for routine upkeep and minor fixes needed to keep a property in good working condition. Calculation:Assumes 5% of gross rental income. Varies by property age and condition. | 5% | -$355 | -$4,260 |
Capital ExpensesLarge, infrequent costs for major improvements or replacements, like a new roof, HVAC system, or appliances. Calculation:Assumes 5% of gross rental income. Varies by property age. | 5% | -$355 | -$4,260 |
HOA FeesRegular dues paid to a Homeowners Association for community maintenance, amenities, and management. Similar fees include: Condo Association Fees, Co-op Maintenance Fees, etc. | n/a | n/a | n/a |
Operating ExpensesRecurring costs required to maintain and manage a rental property, including property taxes, insurance, maintenance, repairs, utilities (if paid by the owner), property management fees, and other day-to-day expenses. Calculation:Insurance + Property Taxes + Property Management + Repairs & Maintenance + Capital Expenditures + HOA Fees | 57% | -$4,059 | -$48,702 |
Cash Flow
| Monthly | Yearly | |
|---|---|---|
Net Operating Income (NOI)The income generated from a property after deducting all operating expenses but before deducting mortgage payments, taxes, and capital expenditures. Calculation:Gross Operating Income - Operating Expenses
Net operating income:
| $2,615 | $31,380 |
Mortgage PaymentThe fixed amount a borrower pays each month to repay a loan. It typically includes principal and interest (P&I) and may also cover property taxes, insurance, HOA fees, and PMI if escrowed. | -$7,633 | -$91,596 |
Cash FlowNet Operating Income (NOI) minus mortgage payments. Calculation:NOI - Mortgage Payments | -$5,018 | -$60,216 |