$650,000
Investment Summary
- Monthly Cash Flow
- -$1,055
- Cap Rate
- 4.2%
- Cash-on-Cash Return
- -8.5%
- Debt Coverage Ratio
- 0.68
- Internal Rate of Return (5 years)
- -4.2%
Cash Flow
Net Operating Income (NOI) minus mortgage payments.
Calculation:
NOI - Mortgage Payments
Cap Rate (Market Value)
Capitalization Rate is a rate of return that compares the yearly Net Operating Income (NOI) to the market value.
Calculation:
NOI / Market Value
Cash-on-Cash Return (CoC)
Annual Cash Flow / Cash Invested
Calculation:
Annual cash flow divided by initial cash invested.
Debt Coverage Ratio (DCR)
Net Operating Income (NOI) divided by total debt payments.
Calculation:
NOI / Total Debt Payments
Internal Rate of Return (IRR)
A metric for assessing profitability over time. IRR is the discount rate at which the net present value (NPV) of all future cash flows (positive and negative) from an investment equals zero — including both periodic cash flow (such as rent) and a projected sale at the end of the holding period. It represents the expected annualized return, accounting for income, expenses, and the recovery of capital through a future sale.
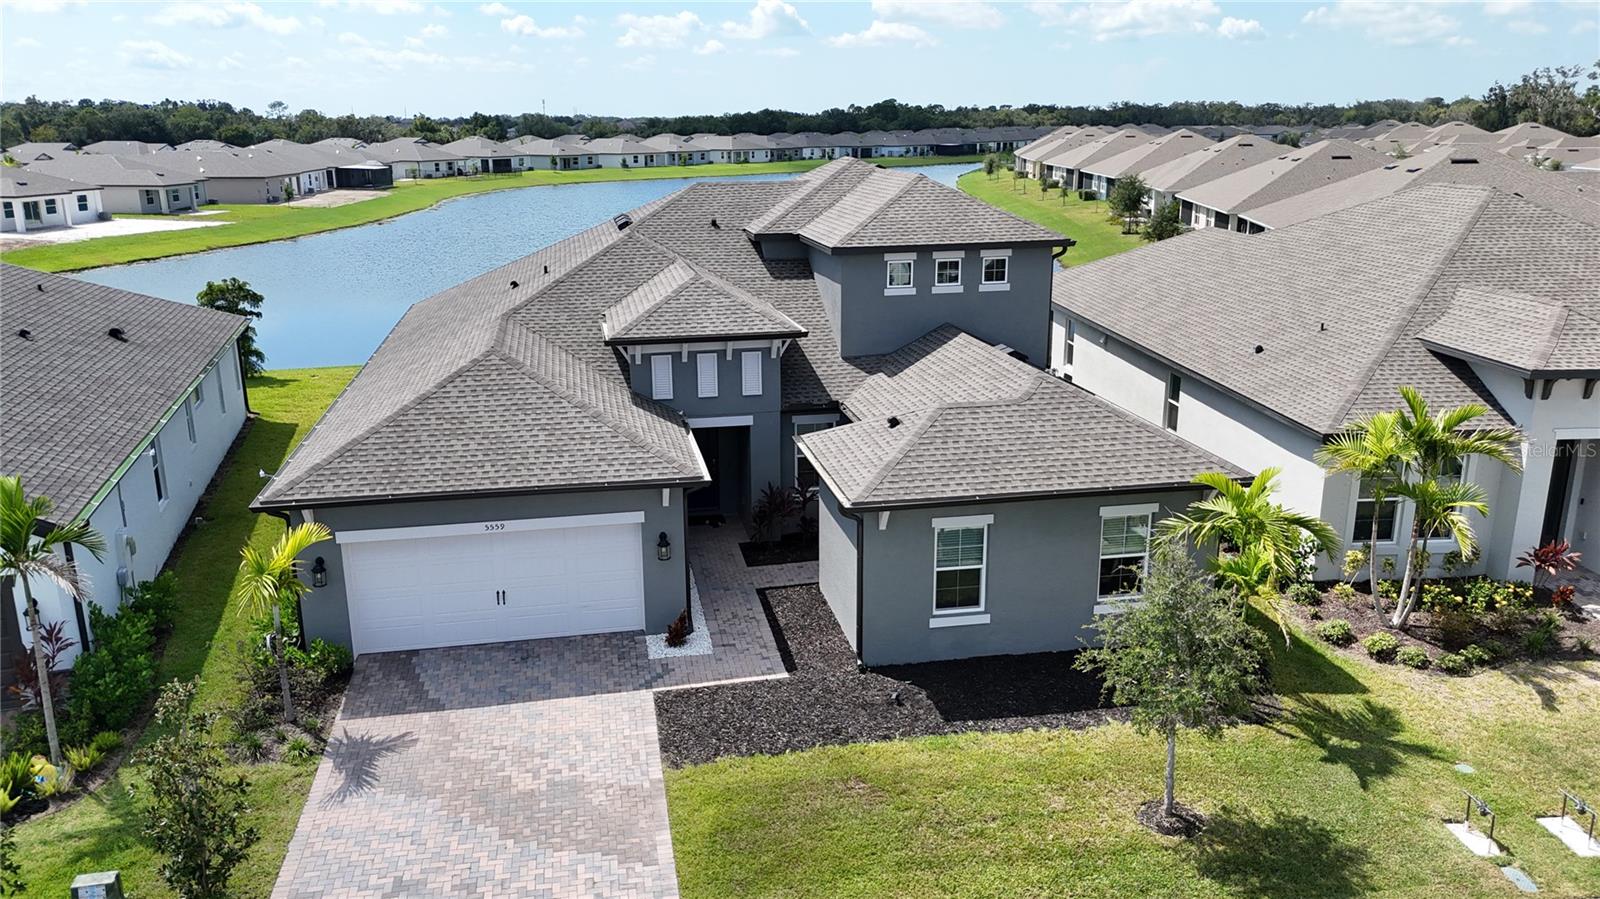
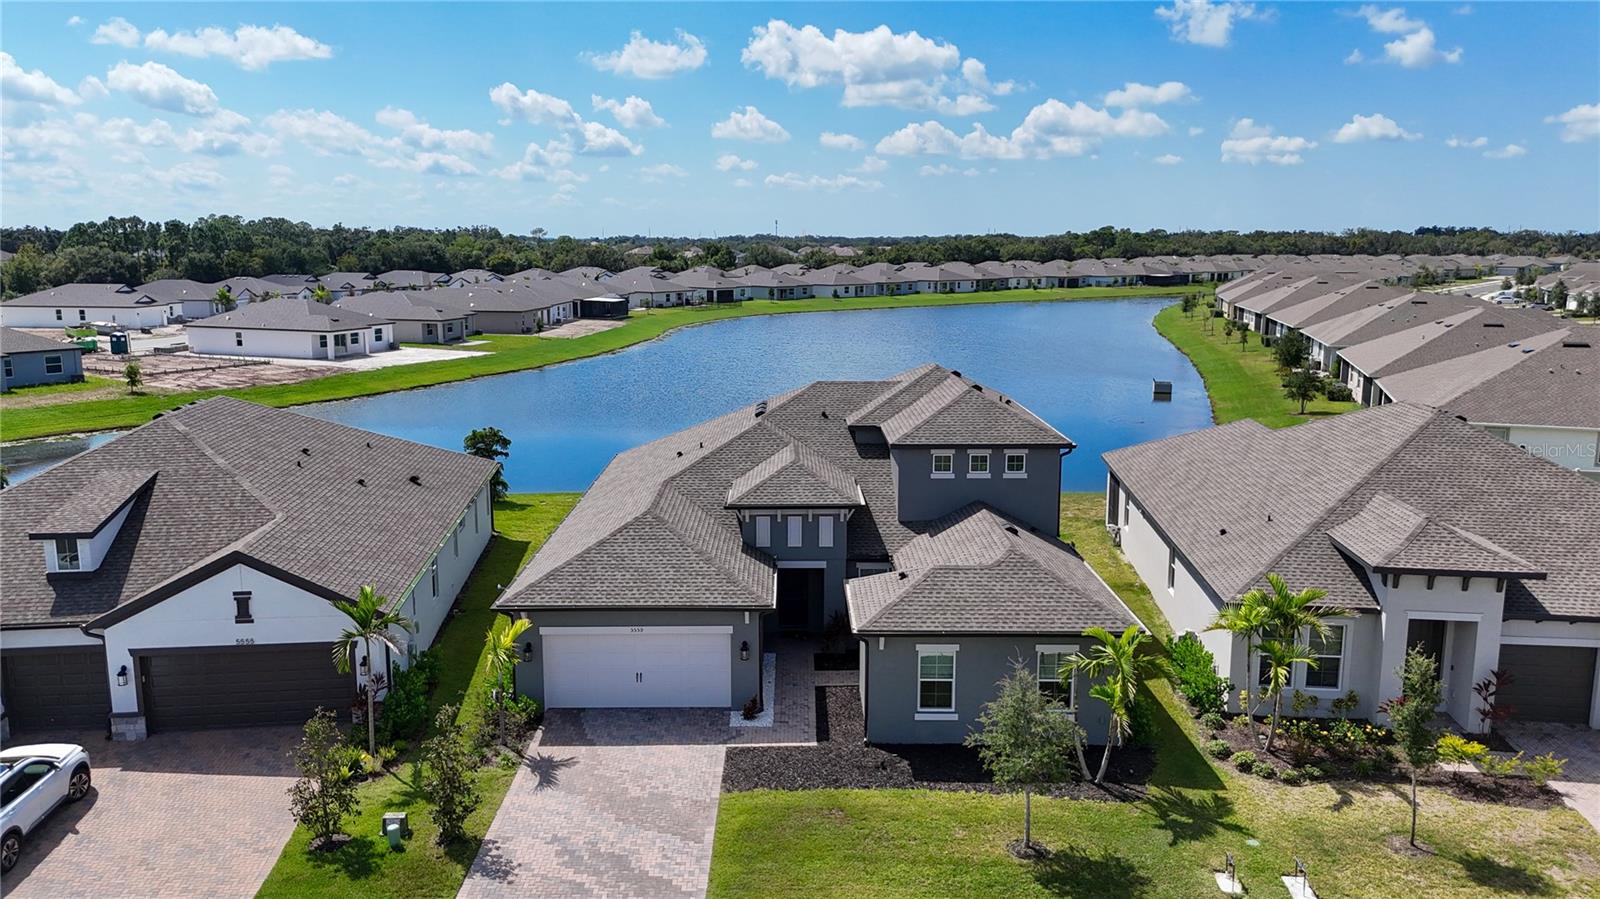
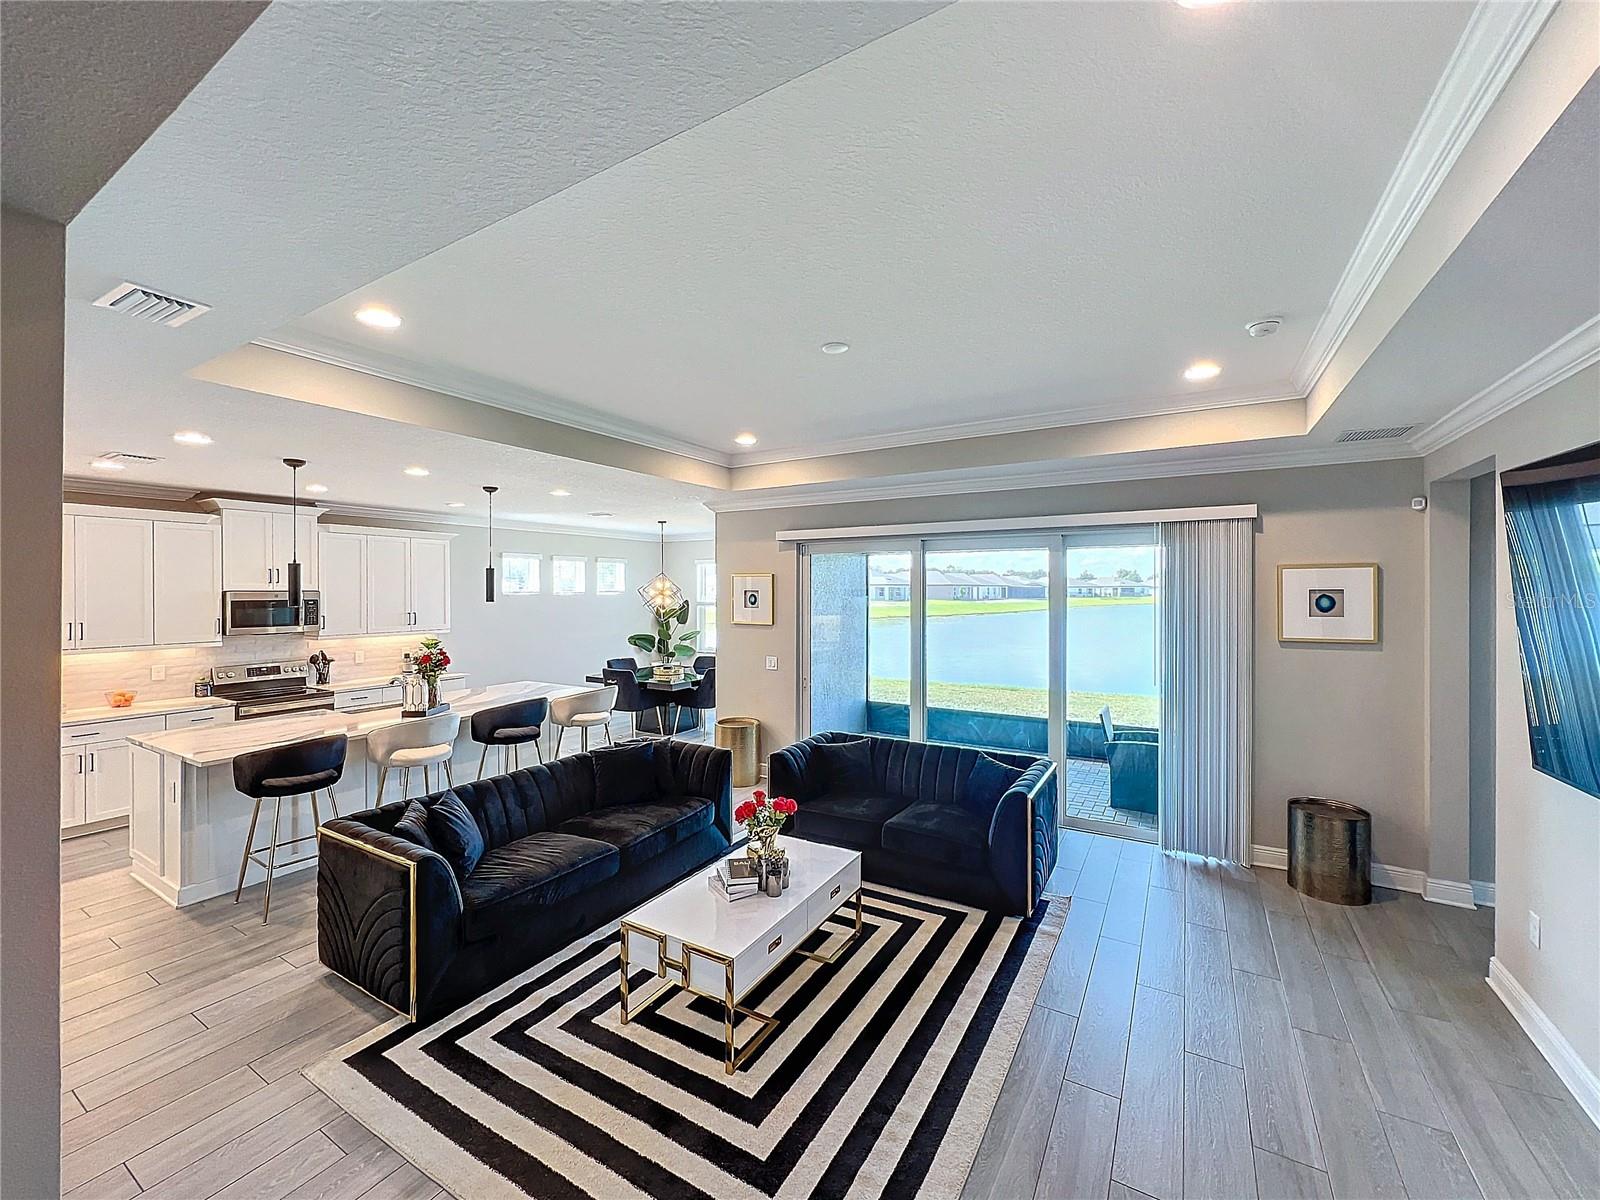
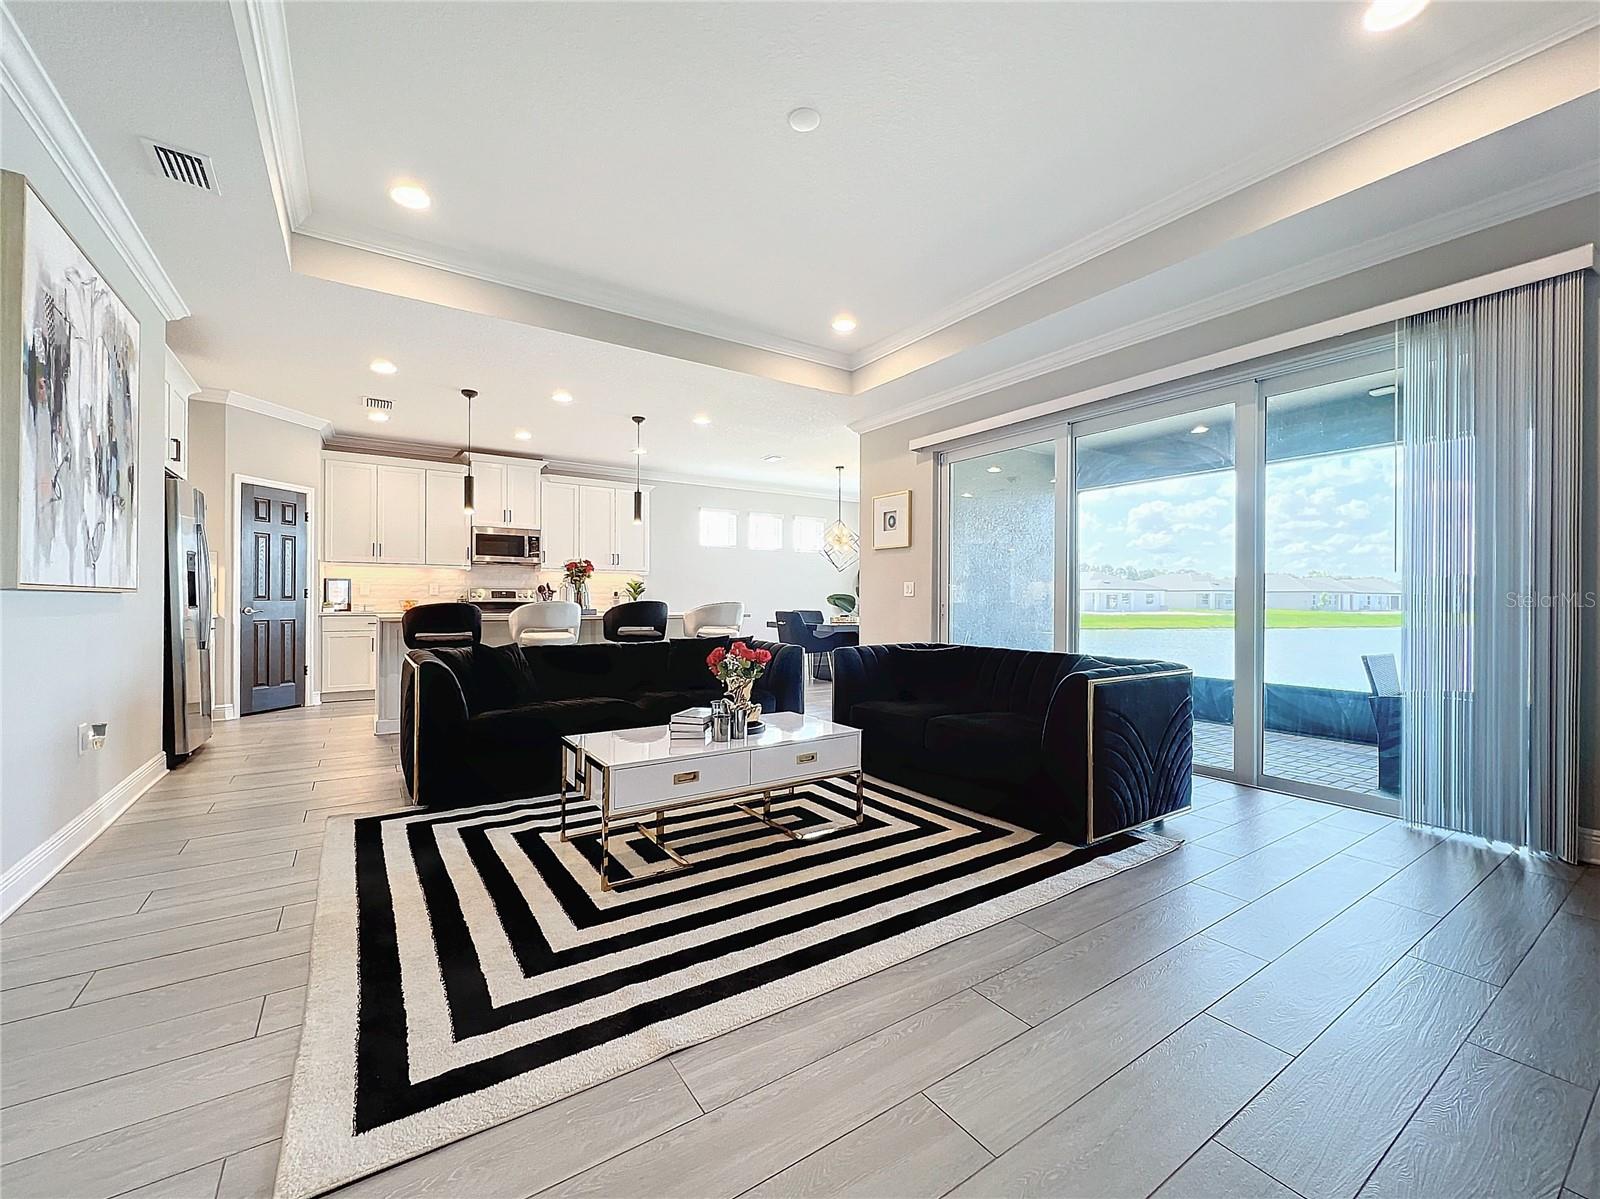
Property Description
Welcome to your dream home, a luxurious 5-bedroom home with stunning water views! This exquisite 5-bedroom, 5-bathroom home offers a perfect blend of elegance and comfort, situated in a serene neighborhood with breathtaking water views. As you step through the front door, you are greeted by an open and inviting foyer that leads to a spacious living area, where panoramic views of the shimmering water instantly capture your attention. The large windows flood the space with natural light, creating a warm and welcoming ambiance. GOURMET KITCHEN: The stunning kitchen is a culinary enthusiast’s delight, featuring top-of-the-line appliances, ample counter space, and a stylish island perfect for entertaining. LUXURIOUS BEDROOMS: The home boasts five generously-sized bedrooms, including a spacious upstairs loft that offers both privacy and versatility. This loft includes its own bedroom and bathroom, making it ideal for guests or a private retreat. PRIVATE IN-LAW SUITE: In addition, the home features a beautifully designed in-law suite with a private entrance, its own bedroom, bathroom and kitchenette, perfect for in-laws or visiting family members. This space offers comfort and independence while remaining close to the main living areas. OUTDOOR OASIS: Step outside to your own outdoor oasis, where you can relax and unwind on your screened-in lanai while enjoying the captivating water views. The backyard is perfect for gatherings or quiet evenings under the stars. This luxurious home is designed for both relaxation and entertainment, offering a lifestyle of comfort in an unparalleled setting. Don’t miss your chance to make this exceptional home your own! Schedule a tour today and experience the beauty and luxury for yourself! ABOUT THE COMMUNITY: Trevesta is a beautiful new community in desirable Palmetto, Florida. Nestled between Tampa and Sarasota in the heart of Manatee County, this community is close to Ellenton, Bradenton, and Parrish, and just a quick drive over the Skyway Bridge to St. Pete. Enjoy access to an amenity center with a clubhouse and 24-hour fitness center, a zero-entry, resort-style pool, a splash pad, a playground, and a dedicated lifestyle director who keeps the calendar full with fun programs and activities. Living in Trevesta puts you in close proximity to everything you will love throughout Manatee County. Terra Ceia Preserve and the sandy white beaches of Anna Maria Island are both quick drives from home. Spend the day in Downtown Bradenton, where you'll find several museums, aquariums, and highly-rated restaurants like Oak and Stone, Pier 22, and Orange Blossom Cafe. Buffalo Creek Golf Club, designed by an internationally acclaimed architect to provide a fun challenge for golfers, is close by. The Ellenton Premium Outlet Mall, located six miles away, is the ideal place to shop, with more than 130 designer and brand outlet stores onsite. There are unlimited opportunities to explore and enjoy nearby!
Build Your Team
Quickly find investor-friendly professionals who can help you succeed in real estate investing at any stage of the investing journey.


Agents
Match with investor-friendly agents who can help you find, analyze, and close your next deal


Lenders
Get the best funding…find investor-friendly lenders who specialize in your deal strategy


Property Managers
Transition to passive investing. Find a trusted property management partnership that lasts.


Tax Pros & Accountants
Taxes and financial reporting made easy—find experts to create tax savings strategies, file taxes, and more
Location
Property Details
Parking
- Description: Garage
- Details: Attached
- Garage Spaces: 2
- Spaces Total: 0
Bedroom Information
- # of Bedrooms: 5
Bathroom Information
- # of Baths (Full): 5
- # of Baths (Total): 5.0
Interior Features
- # of Rooms: 15
- # of Stories: 1
Exterior Features
- Exterior Walls Materials: Stucco
- Foundation: Slab
- Roof Type: Gable or Hip
- Roof Material: Shingle
HOA
- Has HOA: Yes
- Association: Tiffany Decker
- HOA Fee: $593/quarterly
Land Information
- Land Use: Residential
- Land Use Subtype: Single Family Residential
Lot Information
- Parcel ID: 7180.35559
- Lot Size: 7732 sqft
Property Information
- Property Type: Single Family Residence
- Year Built: 2023
Tax Information
- Annual Tax: $3,446
Utilities
- Water & Sewer: Public
- Heating: Central
- Cooling: Central Air
Location
- County: Manatee
Listing Details
Investment Summary
- Monthly Cash Flow
- -$1,055
- Cap Rate
- 4.2%
- Cash-on-Cash Return
- -8.5%
- Debt Coverage Ratio
- 0.68
- Internal Rate of Return (5 years)
- -4.2%
Cash Flow
Net Operating Income (NOI) minus mortgage payments.
Calculation:
NOI - Mortgage Payments
Cap Rate (Market Value)
Capitalization Rate is a rate of return that compares the yearly Net Operating Income (NOI) to the market value.
Calculation:
NOI / Market Value
Cash-on-Cash Return (CoC)
Annual Cash Flow / Cash Invested
Calculation:
Annual cash flow divided by initial cash invested.
Debt Coverage Ratio (DCR)
Net Operating Income (NOI) divided by total debt payments.
Calculation:
NOI / Total Debt Payments
Internal Rate of Return (IRR)
A metric for assessing profitability over time. IRR is the discount rate at which the net present value (NPV) of all future cash flows (positive and negative) from an investment equals zero — including both periodic cash flow (such as rent) and a projected sale at the end of the holding period. It represents the expected annualized return, accounting for income, expenses, and the recovery of capital through a future sale.
Purchase Details
Purchase PriceThe price paid for the property. Purchase price:
| $650,000 |
|---|---|
Amount FinancedThe amount of the purchase financed through a loan. Amount financed:
| -$520,000 |
Down paymentThe initial payment made towards the purchase. Down payment:
| $130,000 |
Closing CostsFees and expenses associated with purchasing a property, typically ranging from 2% to 5% of the home’s purchase price, paid at the end of a home purchase to cover services like lending, title transfer, and taxes. Closing costs:
| $19,500 |
Rehab CostsCosts incurred to repair or improve the property, including: roof, flooring, exterior siding, kitchen, exterior paint, bathrooms, etc. Rehab costs:
| $0 |
Initial Cash InvestedThe total initial cash invested in the property. Calculation:Down payment + Buying costs + Rehab costs Initial cash invested:
| $149,500 |
Square Feet (SQFT)The total square footage of the property. Square feet:
| 3,196 |
Cost Per Square FootCost per square foot of the property. Calculation:Purchase Price / Square Feet Cost per square foot:
| $203 |
Monthly Rent Per Square FootMonthly rent divided by the number of square feet. This ratio helps investors compare rental income efficiency across properties, markets, and unit sizes Calculation:Monthly Rent / Square Feet Monthly rent per square foot:
| $1.25 |
Financing Details
Loan AmountThe total sum of money borrowed from a lender to finance a property purchase. Calculation:Purchase Price - Down Payment
Loan amount:
| $520,000 |
|---|---|
Loan to Value Ratio (LTV)Loan amount divided by the market value of the property. Calculation:Loan Amount / Market Value
Loan to value ratio:
| 80.0% |
Loan TypeThe type of loan (e.g., fixed, adjustable).
Loan type:
| Amortizing |
TermThe loan repayment period in years.
Term:
| 30 years |
Interest RateThe percentage a lender charges on the borrowed amount of a loan, determining the cost of borrowing money.
Interest rate:
| 6.625% |
Principal & Interest (PI)The principal is the portion of the loan payment that reduces the loan balance. The interest is the lender's charge for borrowing money. Calculation:(P * r * (1 + r) ** n) / ((1 + r) ** n - 1) Where:
P = Loan amount (principal)
Principal & interest:
| $3,330 |
Property TaxesAnnual taxes levied by local governments on real estate properties. These taxes fund public services like schools, roads, and emergency services.
Property tax:
| $287 |
InsuranceThe costs for insurance coverage to protect against financial losses due to risks like fire, natural disasters, theft, liability, or tenant-related damages. Calculation:Assumes 7% of gross rental income, unless insurance rates are specified.
Insurance:
| $280 |
Private Mortgage Insurance (PMI)A fee that borrowers pay when they take out a conventional loan with a loan-to-value (LTV) ratio above 80%.
Private mortgage insurance (PMI):
| $0 |
Monthly PaymentThe fixed amount a borrower pays each month to repay a loan. It typically includes principal and interest (P&I) and may also cover property taxes, insurance, HOA fees, and PMI if escrowed. Monthly payment:
| $3,897 |
Operating Income
| % Rent | Monthly | Yearly | |
|---|---|---|---|
Gross RentThe total rental income received from tenants before deducting any expenses. Includes base rent, late fees, pet fees, parking fees, and other recurring charges.
Gross rent:
| $4,000 | $48,000 | |
Vacancy LossExpected loss of rent due to vacancies.
Vacancy loss:
(6%)
| 6% | -$240 | -$2,880 |
Operating IncomeGross rental income minus vacancy loss. Calculation:Gross rent - Vacancy loss
Operating income:
| $3,760 | $45,120 |
Operating Expenses
| % Rent | Monthly | Yearly | |
|---|---|---|---|
Property TaxesAnnual taxes levied by local governments on real estate properties. These taxes fund public services like schools, roads, and emergency services. | 7% | -$287 | -$3,446 |
InsuranceThe costs for insurance coverage to protect against financial losses due to risks like fire, natural disasters, theft, liability, or tenant-related damages. Calculation:Assumes 7% of gross rental income, unless insurance rates are specified. | 7% | -$280 | -$3,360 |
Property ManagementThe costs associated with hiring a property manager to handle the day-to-day operations of a rental property. Includes management fees, leasing fes, eviction fees, etc. Calculation:Assumes 8% of gross rental income. | 8% | -$320 | -$3,840 |
Repairs & MaintenanceOngoing costs for routine upkeep and minor fixes needed to keep a property in good working condition. Calculation:Assumes 5% of gross rental income. Varies by property age and condition. | 5% | -$200 | -$2,400 |
Capital ExpensesLarge, infrequent costs for major improvements or replacements, like a new roof, HVAC system, or appliances. Calculation:Assumes 5% of gross rental income. Varies by property age. | 5% | -$200 | -$2,400 |
HOA FeesRegular dues paid to a Homeowners Association for community maintenance, amenities, and management. Similar fees include: Condo Association Fees, Co-op Maintenance Fees, etc. | 5% | -$198 | -$2,376 |
Operating ExpensesRecurring costs required to maintain and manage a rental property, including property taxes, insurance, maintenance, repairs, utilities (if paid by the owner), property management fees, and other day-to-day expenses. Calculation:Insurance + Property Taxes + Property Management + Repairs & Maintenance + Capital Expenditures + HOA Fees | 37% | -$1,485 | -$17,822 |
Cash Flow
| Monthly | Yearly | |
|---|---|---|
Net Operating Income (NOI)The income generated from a property after deducting all operating expenses but before deducting mortgage payments, taxes, and capital expenditures. Calculation:Gross Operating Income - Operating Expenses
Net operating income:
| $2,275 | $27,300 |
Mortgage PaymentThe fixed amount a borrower pays each month to repay a loan. It typically includes principal and interest (P&I) and may also cover property taxes, insurance, HOA fees, and PMI if escrowed. | -$3,330 | -$39,960 |
Cash FlowNet Operating Income (NOI) minus mortgage payments. Calculation:NOI - Mortgage Payments | -$1,055 | -$12,660 |