
$589,000
Investment Summary
- Monthly Cash Flow
- -$1,329
- Cap Rate
- 3.4%
- Cash-on-Cash Return
- -11.8%
- Debt Coverage Ratio
- 0.56
- Internal Rate of Return (5 years)
- -7.4%
Cash Flow
Net Operating Income (NOI) minus mortgage payments.
Calculation:
NOI - Mortgage Payments
Cap Rate (Market Value)
Capitalization Rate is a rate of return that compares the yearly Net Operating Income (NOI) to the market value.
Calculation:
NOI / Market Value
Cash-on-Cash Return (CoC)
Annual Cash Flow / Cash Invested
Calculation:
Annual cash flow divided by initial cash invested.
Debt Coverage Ratio (DCR)
Net Operating Income (NOI) divided by total debt payments.
Calculation:
NOI / Total Debt Payments
Internal Rate of Return (IRR)
A metric for assessing profitability over time. IRR is the discount rate at which the net present value (NPV) of all future cash flows (positive and negative) from an investment equals zero — including both periodic cash flow (such as rent) and a projected sale at the end of the holding period. It represents the expected annualized return, accounting for income, expenses, and the recovery of capital through a future sale.
Property Description
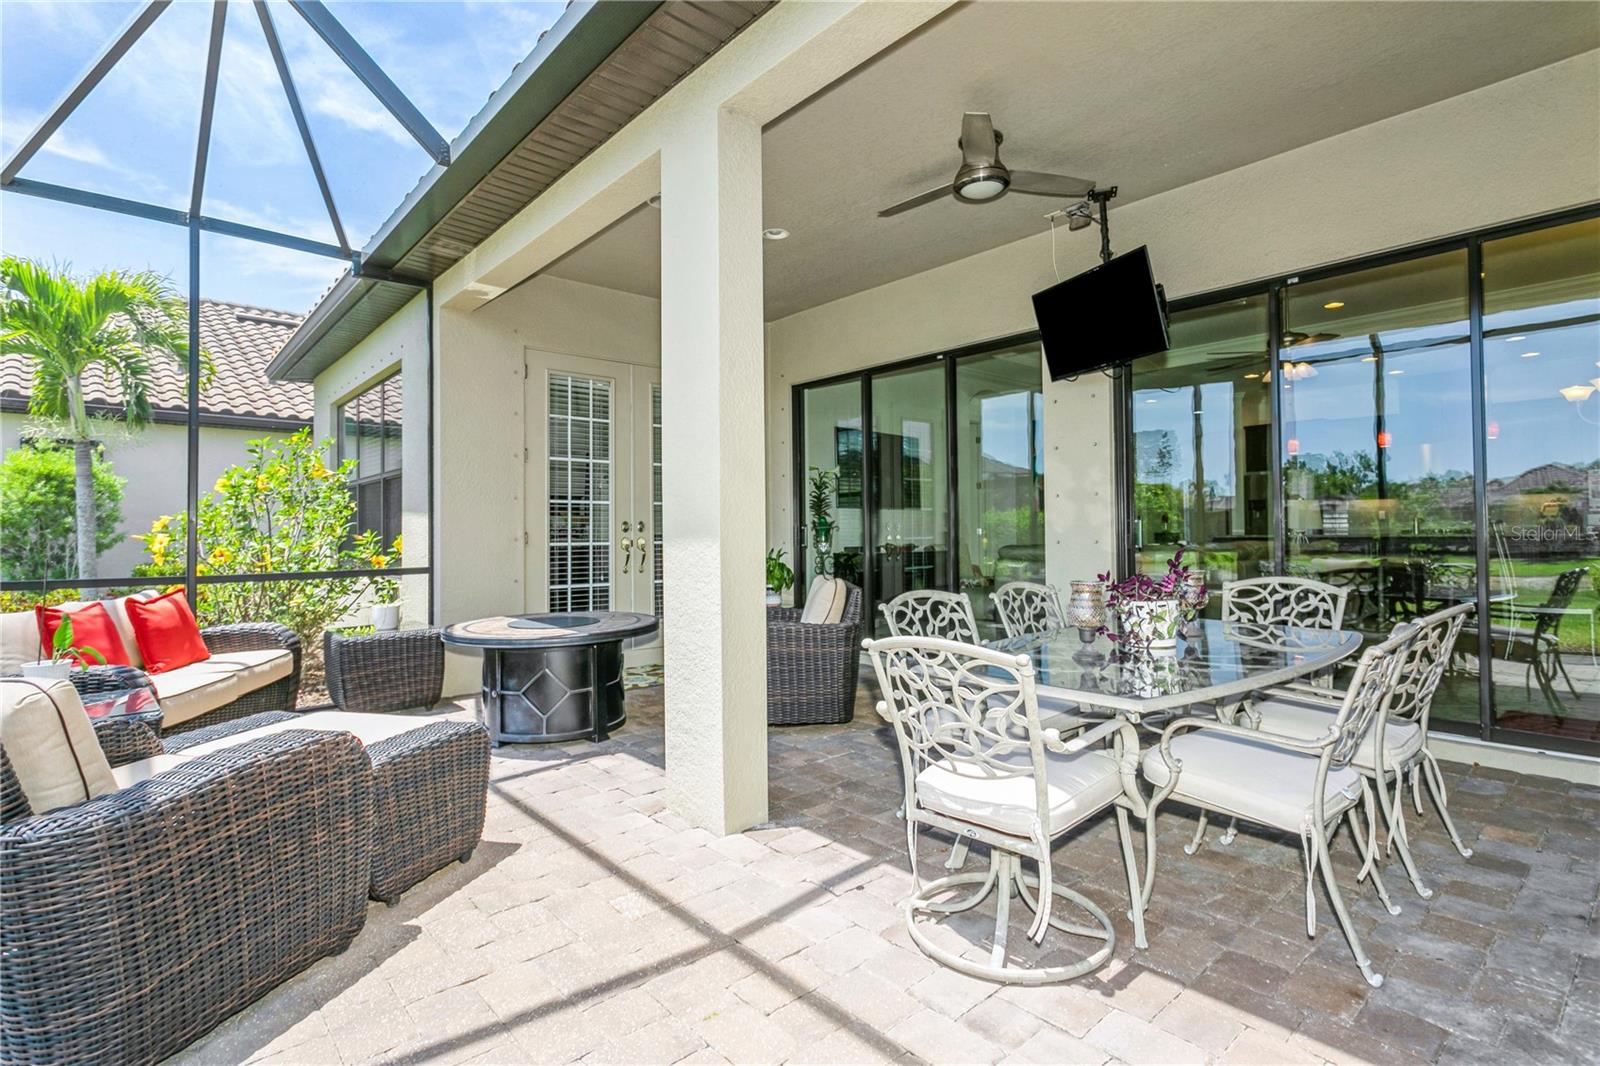
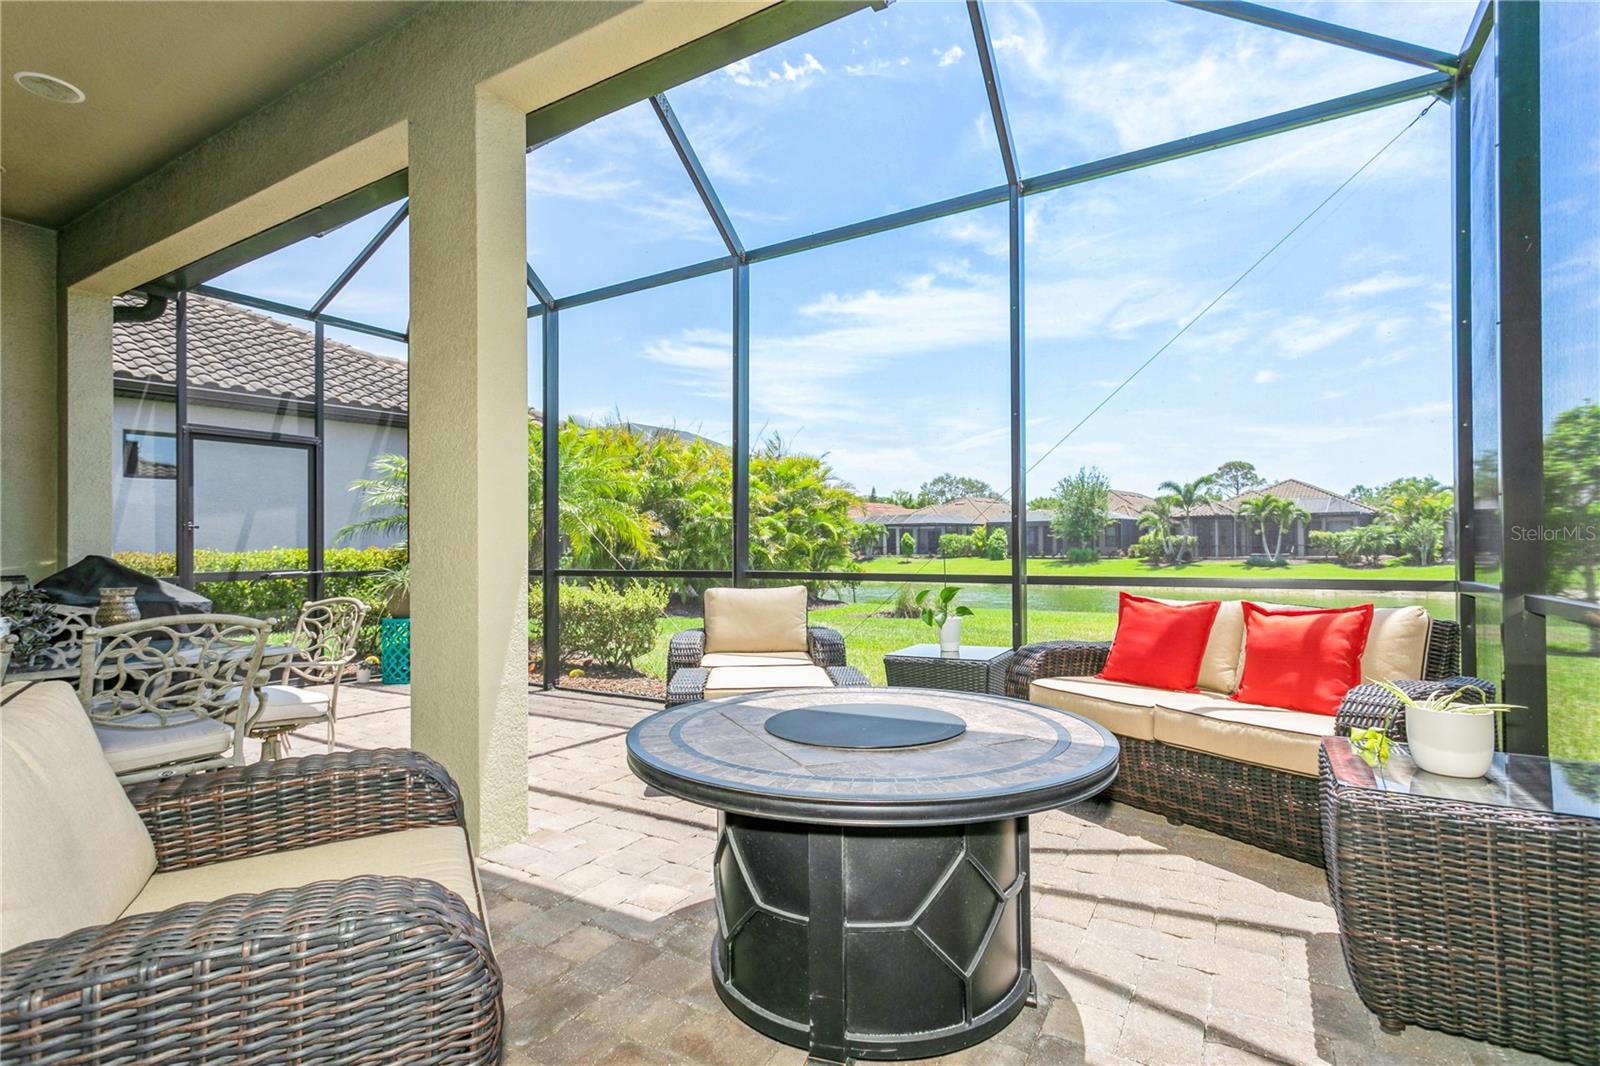
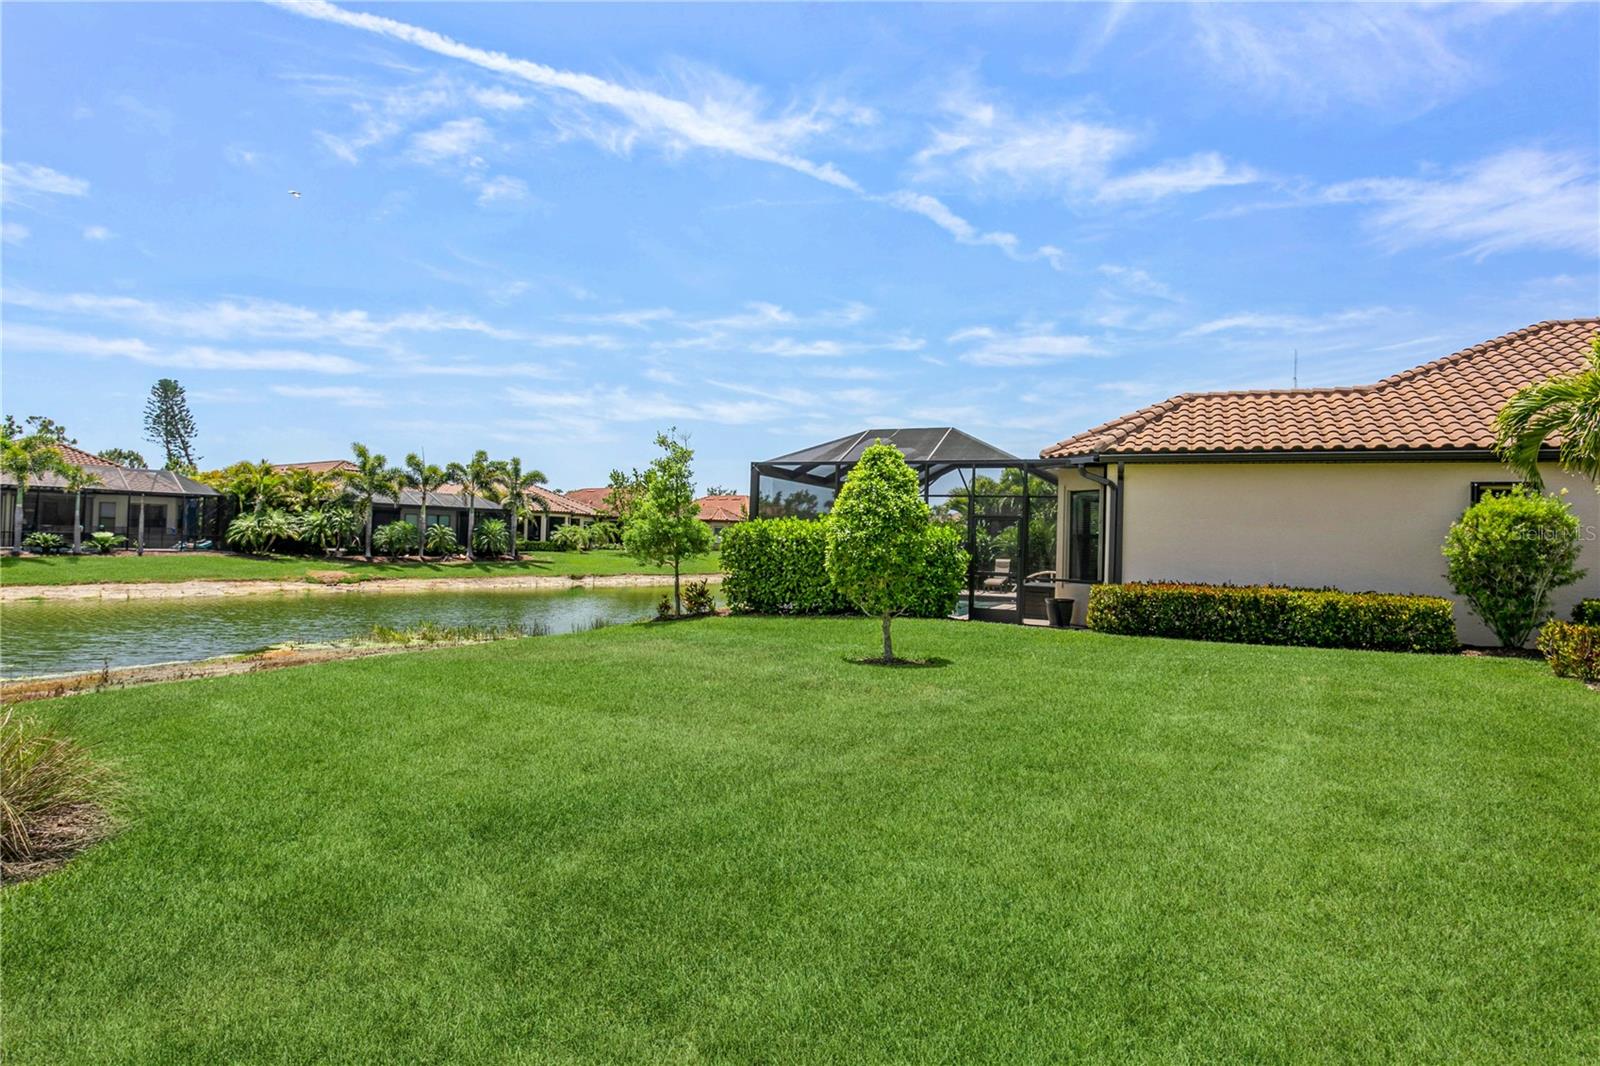
Welcome to this beautifully appointed Taylor Morrison Piceno model, offering 2 bedrooms, 2 bathrooms, a spacious den, and 1,831 sq. ft. of thoughtfully designed living space. Situated on a picturesque POND-VIEW lot, this home perfectly blends comfort, style, and Florida living. From the moment you arrive, you’ll notice a striking HURRICANE IMPACT glass-inlaid front door with dual side panels, creating an elegant entryway. Step into a large foyer that leads into an open, inviting layout featuring ceramic tile flooring in the main living areas and plush carpet in the bedrooms and den. The gourmet kitchen is a true centerpiece, boasting a large center island with built-in storage, a spacious pantry, and beautifully upgraded cabinetry. The open-concept kitchen, living, and dining area is ideal for entertaining, enhanced by tray ceilings with crown molding and two sets of triple sliding glass doors that flood the space with natural light and showcase the pond view and expansive grassy backyard. Retreat to the tranquil master suite, which features lanai access, serene water views, and an ensuite bathroom with separate vanities, a walk-in shower, and two spacious walk-in closets. Bedroom #2 is located at the front of the home and features a stunning HURRICANE IMPACT double windows for abundant natural light. A full bathroom is conveniently located just outside the bedroom in the adjacent hallway—perfect for guests or family. The home also includes a versatile den with pocket doors, ideal for a home office, guest room, or hobby space. Stepping in from the double garage, the entryway leads into the laundry room that boasts a washer and dryer (Whirlpool washer bought in March 2025) ample cabinetry and shelving for added storage. Step outside to enjoy the oversized lanai with a fully equipped OUTDOOR KITCHEN, ideal for relaxing or hosting gatherings while enjoying peaceful pond views. This home is move-in ready and full of thoughtful upgrades, designed for easy, elegant living in one of the area’s most desirable communities. Living in the Bellacina by Casey Key community offers more than just a beautiful home. Enjoy resort-style amenities including a sparkling, resort-style heated swimming pool with cabanas, a state-of-the-art clubhouse with a chef’s kitchen, pool table, a 24-hour fitness center and showers, outdoor spa, bocce ball courts, corn hole and grill area, and cozy gas fire pits. There is a private community entrance onto the famous Sarasota Legacy Trail, 4 lighted pickleball courts, a Har Tru tennis court, a playground, and 2 dog parks. A full calendar of events is organized by the on-sight Activities Director ensuring there’s always something to do and the full-time HOA Manager is on-site M-F as well. Location is key! Bellacina is only a 2.5 mi. golf-cart ride from Nokomis Beach, 5 miles from historic downtown Venice, 20 minutes to the world-renowned Siesta Key, and 30 minutes to downtown Sarasota and SRQ International Airport. This home is not just a gorgeous residence....it's a lifestyle!!
Build Your Team
Quickly find investor-friendly professionals who can help you succeed in real estate investing at any stage of the investing journey.


Agents
Match with investor-friendly agents who can help you find, analyze, and close your next deal


Lenders
Get the best funding…find investor-friendly lenders who specialize in your deal strategy


Property Managers
Transition to passive investing. Find a trusted property management partnership that lasts.


Tax Pros & Accountants
Taxes and financial reporting made easy—find experts to create tax savings strategies, file taxes, and more
Location
Property Details
Parking
- Description: Garage Door Opener
- Details: Attached
- Garage Spaces: 2
- Spaces Total: 0
Bedroom Information
- # of Bedrooms: 2
Bathroom Information
- # of Baths (Full): 2
- # of Baths (Total): 2.0
Interior Features
- # of Rooms: 7
- # of Stories: 1
Exterior Features
- Exterior Walls Materials: Stucco
- Foundation: Slab
- Roof Type: Hip
- Roof Material: Tile
HOA
- Has HOA: Yes
- Association: Courtney Silverstine
- HOA Fee: $1,184/quarterly
Land Information
- Land Use: Residential
- Land Use Subtype: Single Family Residential
Lot Information
- Parcel ID: 0164020079
- Lot Size: 8301 sqft
Property Information
- Property Type: Single Family Residence
- Year Built: 2018
Tax Information
- Annual Tax: $3,982
Utilities
- Water & Sewer: Public
- Heating: Electric
- Cooling: Central Air
Location
- County: Sarasota
Listing Details
Investment Summary
- Monthly Cash Flow
- -$1,329
- Cap Rate
- 3.4%
- Cash-on-Cash Return
- -11.8%
- Debt Coverage Ratio
- 0.56
- Internal Rate of Return (5 years)
- -7.4%
Cash Flow
Net Operating Income (NOI) minus mortgage payments.
Calculation:
NOI - Mortgage Payments
Cap Rate (Market Value)
Capitalization Rate is a rate of return that compares the yearly Net Operating Income (NOI) to the market value.
Calculation:
NOI / Market Value
Cash-on-Cash Return (CoC)
Annual Cash Flow / Cash Invested
Calculation:
Annual cash flow divided by initial cash invested.
Debt Coverage Ratio (DCR)
Net Operating Income (NOI) divided by total debt payments.
Calculation:
NOI / Total Debt Payments
Internal Rate of Return (IRR)
A metric for assessing profitability over time. IRR is the discount rate at which the net present value (NPV) of all future cash flows (positive and negative) from an investment equals zero — including both periodic cash flow (such as rent) and a projected sale at the end of the holding period. It represents the expected annualized return, accounting for income, expenses, and the recovery of capital through a future sale.
Purchase Details
Purchase PriceThe price paid for the property. Purchase price:
| $589,000 |
|---|---|
Amount FinancedThe amount of the purchase financed through a loan. Amount financed:
| -$471,200 |
Down paymentThe initial payment made towards the purchase. Down payment:
| $117,800 |
Closing CostsFees and expenses associated with purchasing a property, typically ranging from 2% to 5% of the home’s purchase price, paid at the end of a home purchase to cover services like lending, title transfer, and taxes. Closing costs:
| $17,670 |
Rehab CostsCosts incurred to repair or improve the property, including: roof, flooring, exterior siding, kitchen, exterior paint, bathrooms, etc. Rehab costs:
| $0 |
Initial Cash InvestedThe total initial cash invested in the property. Calculation:Down payment + Buying costs + Rehab costs Initial cash invested:
| $135,470 |
Square Feet (SQFT)The total square footage of the property. Square feet:
| 1,831 |
Cost Per Square FootCost per square foot of the property. Calculation:Purchase Price / Square Feet Cost per square foot:
| $322 |
Monthly Rent Per Square FootMonthly rent divided by the number of square feet. This ratio helps investors compare rental income efficiency across properties, markets, and unit sizes Calculation:Monthly Rent / Square Feet Monthly rent per square foot:
| $1.91 |
Financing Details
Loan AmountThe total sum of money borrowed from a lender to finance a property purchase. Calculation:Purchase Price - Down Payment
Loan amount:
| $471,200 |
|---|---|
Loan to Value Ratio (LTV)Loan amount divided by the market value of the property. Calculation:Loan Amount / Market Value
Loan to value ratio:
| 80.0% |
Loan TypeThe type of loan (e.g., fixed, adjustable).
Loan type:
| Amortizing |
TermThe loan repayment period in years.
Term:
| 30 years |
Interest RateThe percentage a lender charges on the borrowed amount of a loan, determining the cost of borrowing money.
Interest rate:
| 6.625% |
Principal & Interest (PI)The principal is the portion of the loan payment that reduces the loan balance. The interest is the lender's charge for borrowing money. Calculation:(P * r * (1 + r) ** n) / ((1 + r) ** n - 1) Where:
P = Loan amount (principal)
Principal & interest:
| $3,017 |
Property TaxesAnnual taxes levied by local governments on real estate properties. These taxes fund public services like schools, roads, and emergency services.
Property tax:
| $332 |
InsuranceThe costs for insurance coverage to protect against financial losses due to risks like fire, natural disasters, theft, liability, or tenant-related damages. Calculation:Assumes 7% of gross rental income, unless insurance rates are specified.
Insurance:
| $245 |
Private Mortgage Insurance (PMI)A fee that borrowers pay when they take out a conventional loan with a loan-to-value (LTV) ratio above 80%.
Private mortgage insurance (PMI):
| $0 |
Monthly PaymentThe fixed amount a borrower pays each month to repay a loan. It typically includes principal and interest (P&I) and may also cover property taxes, insurance, HOA fees, and PMI if escrowed. Monthly payment:
| $3,594 |
Operating Income
| % Rent | Monthly | Yearly | |
|---|---|---|---|
Gross RentThe total rental income received from tenants before deducting any expenses. Includes base rent, late fees, pet fees, parking fees, and other recurring charges.
Gross rent:
| $3,500 | $42,000 | |
Vacancy LossExpected loss of rent due to vacancies.
Vacancy loss:
(6%)
| 6% | -$210 | -$2,520 |
Operating IncomeGross rental income minus vacancy loss. Calculation:Gross rent - Vacancy loss
Operating income:
| $3,290 | $39,480 |
Operating Expenses
| % Rent | Monthly | Yearly | |
|---|---|---|---|
Property TaxesAnnual taxes levied by local governments on real estate properties. These taxes fund public services like schools, roads, and emergency services. | 9% | -$332 | -$3,983 |
InsuranceThe costs for insurance coverage to protect against financial losses due to risks like fire, natural disasters, theft, liability, or tenant-related damages. Calculation:Assumes 7% of gross rental income, unless insurance rates are specified. | 7% | -$245 | -$2,940 |
Property ManagementThe costs associated with hiring a property manager to handle the day-to-day operations of a rental property. Includes management fees, leasing fes, eviction fees, etc. Calculation:Assumes 8% of gross rental income. | 8% | -$280 | -$3,360 |
Repairs & MaintenanceOngoing costs for routine upkeep and minor fixes needed to keep a property in good working condition. Calculation:Assumes 5% of gross rental income. Varies by property age and condition. | 5% | -$175 | -$2,100 |
Capital ExpensesLarge, infrequent costs for major improvements or replacements, like a new roof, HVAC system, or appliances. Calculation:Assumes 5% of gross rental income. Varies by property age. | 5% | -$175 | -$2,100 |
HOA FeesRegular dues paid to a Homeowners Association for community maintenance, amenities, and management. Similar fees include: Condo Association Fees, Co-op Maintenance Fees, etc. | 11% | -$395 | -$4,740 |
Operating ExpensesRecurring costs required to maintain and manage a rental property, including property taxes, insurance, maintenance, repairs, utilities (if paid by the owner), property management fees, and other day-to-day expenses. Calculation:Insurance + Property Taxes + Property Management + Repairs & Maintenance + Capital Expenditures + HOA Fees | 46% | -$1,602 | -$19,223 |
Cash Flow
| Monthly | Yearly | |
|---|---|---|
Net Operating Income (NOI)The income generated from a property after deducting all operating expenses but before deducting mortgage payments, taxes, and capital expenditures. Calculation:Gross Operating Income - Operating Expenses
Net operating income:
| $1,688 | $20,256 |
Mortgage PaymentThe fixed amount a borrower pays each month to repay a loan. It typically includes principal and interest (P&I) and may also cover property taxes, insurance, HOA fees, and PMI if escrowed. | -$3,017 | -$36,204 |
Cash FlowNet Operating Income (NOI) minus mortgage payments. Calculation:NOI - Mortgage Payments | -$1,329 | -$15,948 |