$4,185,000
Investment Summary
- Monthly Cash Flow
- -$19,800
- Cap Rate
- 0.5%
- Cash-on-Cash Return
- -24.7%
- Debt Coverage Ratio
- 0.08
- Internal Rate of Return (5 years)
- -19.8%
Cash Flow
Net Operating Income (NOI) minus mortgage payments.
Calculation:
NOI - Mortgage Payments
Cap Rate (Market Value)
Capitalization Rate is a rate of return that compares the yearly Net Operating Income (NOI) to the market value.
Calculation:
NOI / Market Value
Cash-on-Cash Return (CoC)
Annual Cash Flow / Cash Invested
Calculation:
Annual cash flow divided by initial cash invested.
Debt Coverage Ratio (DCR)
Net Operating Income (NOI) divided by total debt payments.
Calculation:
NOI / Total Debt Payments
Internal Rate of Return (IRR)
A metric for assessing profitability over time. IRR is the discount rate at which the net present value (NPV) of all future cash flows (positive and negative) from an investment equals zero — including both periodic cash flow (such as rent) and a projected sale at the end of the holding period. It represents the expected annualized return, accounting for income, expenses, and the recovery of capital through a future sale.
Property Description
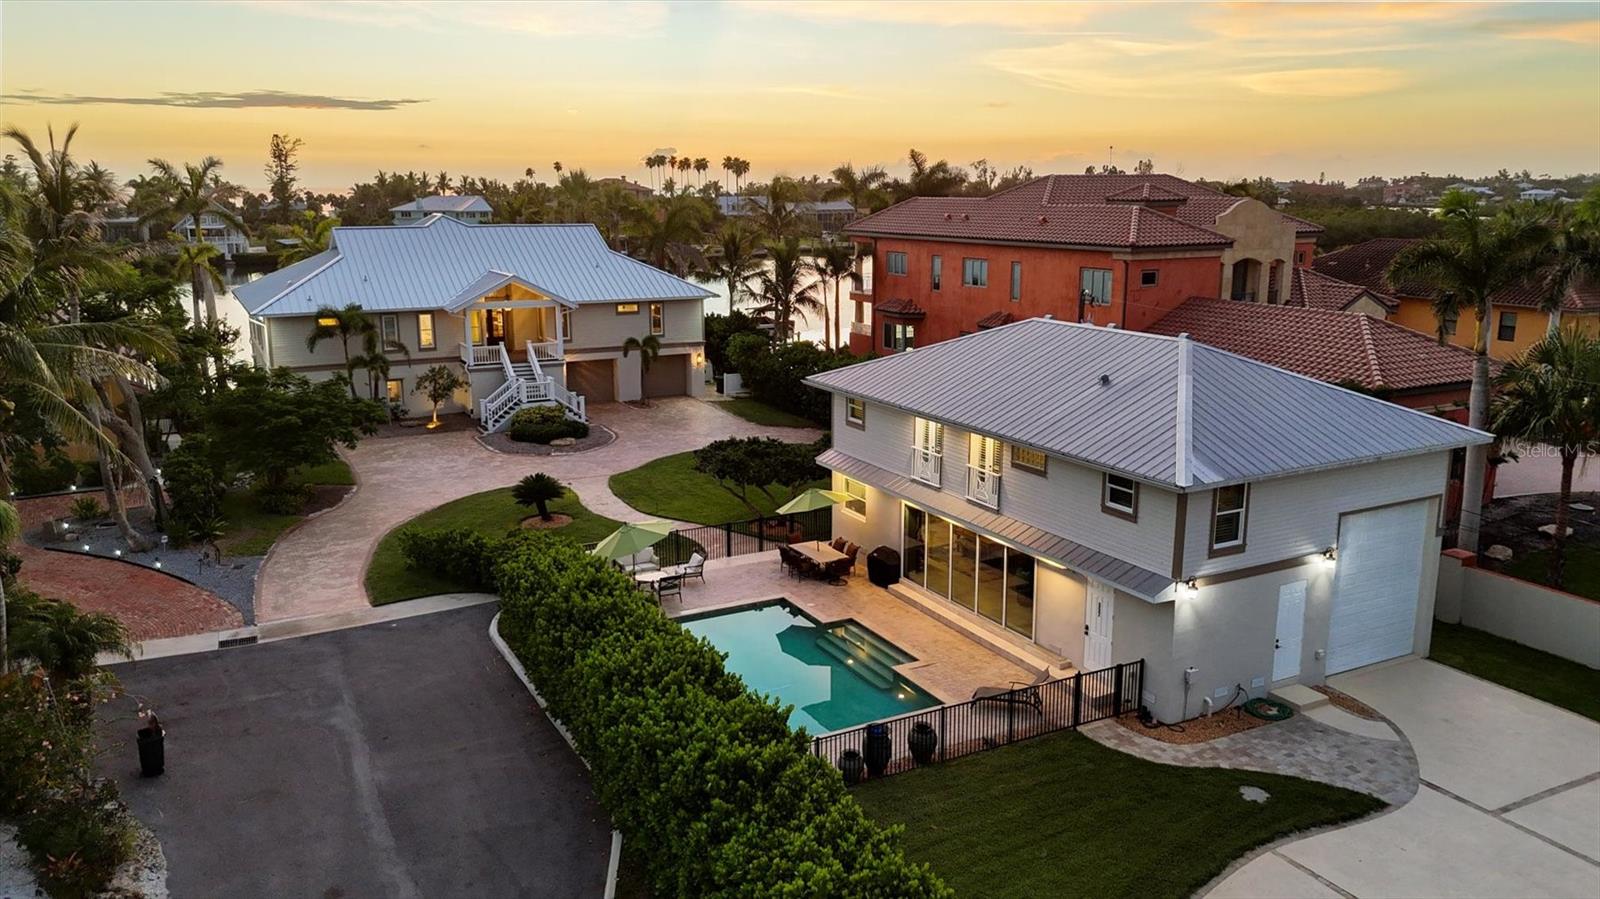
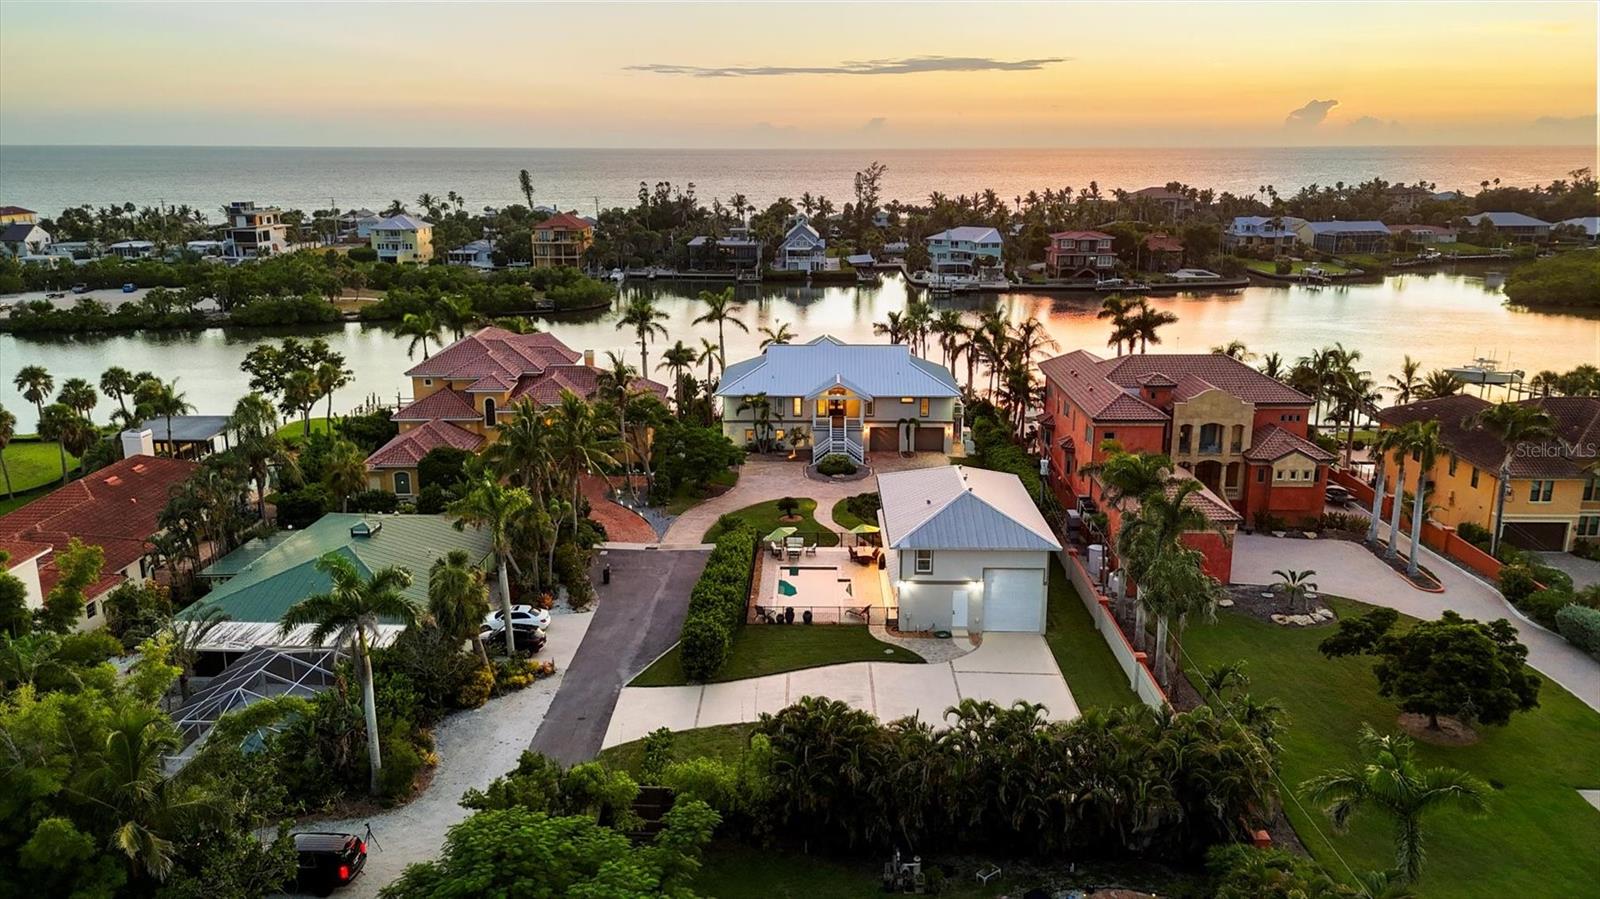
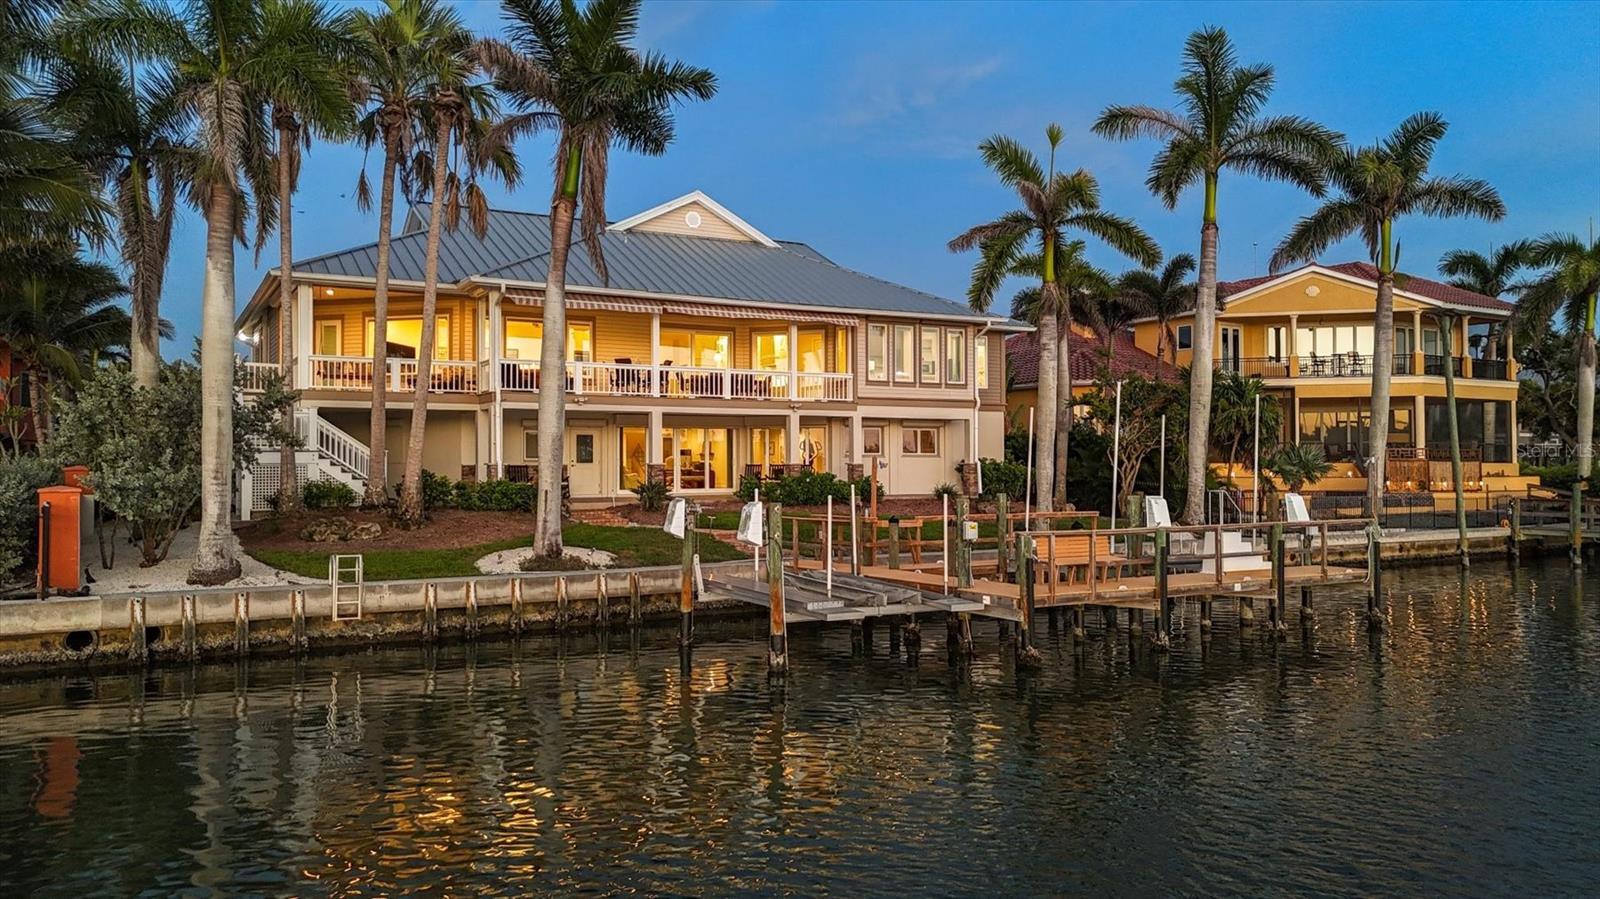
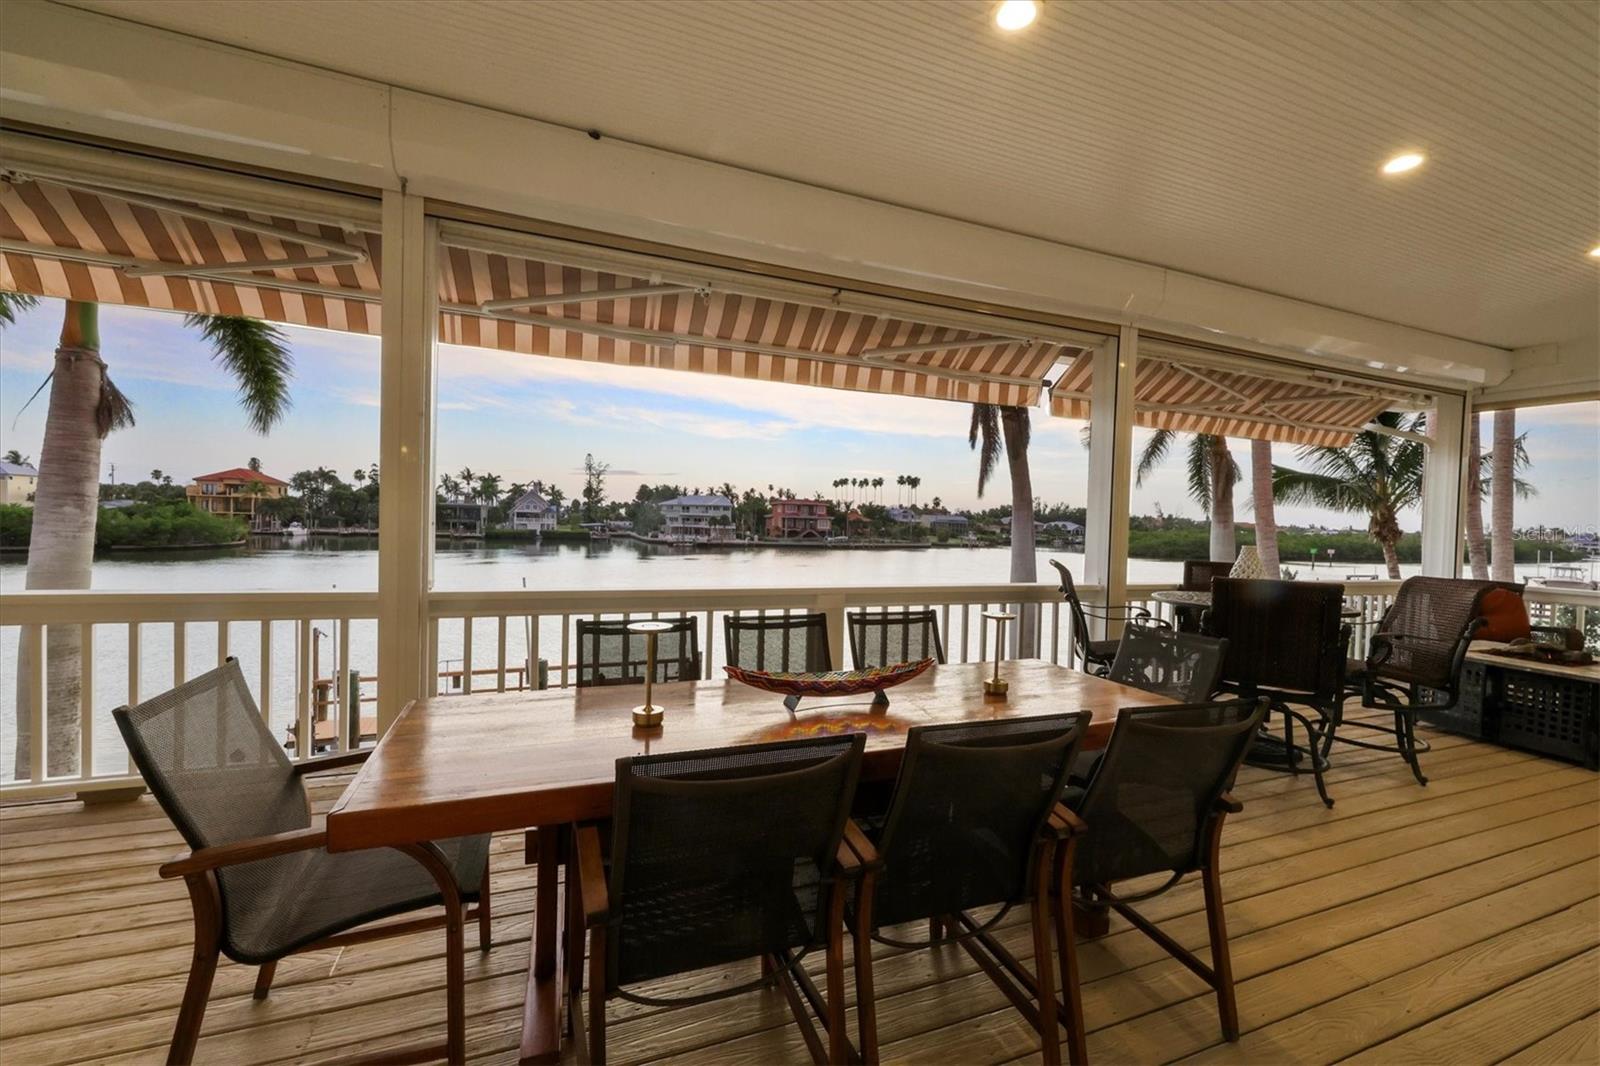
Set along the coveted waterfront of Blackburn Bay, this rare Nokomis estate embodies the very best of refined coastal living with multi-residence flexibility. The .68-acre property spans 100 waterfront feet and offers a stunning main residence and a fully appointed guest house with unique and flexible garage space. Crafted for effortless entertaining, year-round comfort, and Gulf Coast adventure, it encompasses 4,537 square feet of living space, four bedrooms, four-and-a-half baths, an attached garage, and dedicated boat, RV or hobby storage, ideally pairing casual luxury with a practical lifestyle. A welcoming approach leads to Trex steps, and a front porch framed by glass-pane French doors, opening to expansive living spaces. The great room’s illuminated tray ceiling, large windows, and engineered hardwood floors set the tone for airy sophistication. The dining area, open to the kitchen and living area, features sliders to the deck, designer lighting and a decorative high ceiling. The chef’s kitchen offers an oversized central island with seating, quartz countertops, a premier stainless-steel appliance package with a cabinet-faced Sub-Zero refrigerator, stone backsplash, and ceiling-height cabinetry with decorative glass accents. A custom bar and lounge, with prep sink, wine cooler, dual Sub-Zero beverage refrigerators, glass-faced cabinetry and a hidden door to the primary suite, adds a touch of intrigue. The primary bedroom includes a sitting area, dual walk-in closets, and plantation-shuttered windows, while its spa-inspired bath features a soaking tub, glass-block walk-in shower, dual vanities, water closet, chandelier-lit tray ceiling and transom windows. Two guest bedrooms share a full bath, and a half bath completes the main floor. The ground level, finished with wood-look tile, offers water views and flexible spaces that open to the outdoor amenities, abundant storage and a two-stop elevator. Outdoor living is elevated with a spacious terrace featuring retractable awning and hurricane screens, a shaded lower patio with freshly sealed stone columns and mature landscaping. The private dock includes two lifts, plus water, electric and lighting for seamless boating with quick access to the Gulf. The guest house is equally well-appointed, with a travertine-floored great room, kitchenette with stainless steel Frigidaire appliances, upstairs family room and bedroom, two full baths, Bosch laundry, and a garage designed for boat, RV or hobby storage. Multiple French doors and sliders connect the space to an amazing paver pool area strategically between the two homes. With its blend of refined interiors, generous indoor-outdoor spaces and direct waterfront access, 559 Bob Hope Drive is more than a home, it’s a statement of coastal living.
Build Your Team
Quickly find investor-friendly professionals who can help you succeed in real estate investing at any stage of the investing journey.


Agents
Match with investor-friendly agents who can help you find, analyze, and close your next deal


Lenders
Get the best funding…find investor-friendly lenders who specialize in your deal strategy


Property Managers
Transition to passive investing. Find a trusted property management partnership that lasts.


Tax Pros & Accountants
Taxes and financial reporting made easy—find experts to create tax savings strategies, file taxes, and more
Location
Property Details
Parking
- Description: Garage Door Opener, Oversized, Workshop in Garage
- Details: Boat, Covered, Driveway, Garage Door Opener, Golf Cart Garage, Guest, Off Street, Oversized, RV Garage, RV Access/Parking, Tandem, Attached
- Garage Spaces: 4
- Spaces Total: 0
Bedroom Information
- # of Bedrooms: 4
Bathroom Information
- # of Baths (Full): 4
- # of Baths (Partial): 1
- # of Baths (Total): 5.0
Interior Features
- # of Rooms: 9
- # of Stories: 2
Exterior Features
- Exterior Walls Materials: Stucco
- Foundation: Block, Slab
- Roof Type: Hip
- Roof Material: Metal
- Pool: Yes
Land Information
- Land Use: Residential
- Land Use Subtype: Multi-Family Dwellings (any combination 2+)
Lot Information
- Parcel ID: 0169010022
- Lot Size: 29774 sqft
Property Information
- Property Type: Single Family Residence
- Style: Coastal, Florida, Key West
- Year Built: 1995
Tax Information
- Annual Tax: $15,952
Utilities
- Water & Sewer: Private, Public, Well
- Heating: Central, Electric, Zoned
- Cooling: Central Air, Zoned
Location
- County: Sarasota
Listing Details
Investment Summary
- Monthly Cash Flow
- -$19,800
- Cap Rate
- 0.5%
- Cash-on-Cash Return
- -24.7%
- Debt Coverage Ratio
- 0.08
- Internal Rate of Return (5 years)
- -19.8%
Cash Flow
Net Operating Income (NOI) minus mortgage payments.
Calculation:
NOI - Mortgage Payments
Cap Rate (Market Value)
Capitalization Rate is a rate of return that compares the yearly Net Operating Income (NOI) to the market value.
Calculation:
NOI / Market Value
Cash-on-Cash Return (CoC)
Annual Cash Flow / Cash Invested
Calculation:
Annual cash flow divided by initial cash invested.
Debt Coverage Ratio (DCR)
Net Operating Income (NOI) divided by total debt payments.
Calculation:
NOI / Total Debt Payments
Internal Rate of Return (IRR)
A metric for assessing profitability over time. IRR is the discount rate at which the net present value (NPV) of all future cash flows (positive and negative) from an investment equals zero — including both periodic cash flow (such as rent) and a projected sale at the end of the holding period. It represents the expected annualized return, accounting for income, expenses, and the recovery of capital through a future sale.
Purchase Details
Purchase PriceThe price paid for the property. Purchase price:
| $4,185,000 |
|---|---|
Amount FinancedThe amount of the purchase financed through a loan. Amount financed:
| -$3,348,000 |
Down paymentThe initial payment made towards the purchase. Down payment:
| $837,000 |
Closing CostsFees and expenses associated with purchasing a property, typically ranging from 2% to 5% of the home’s purchase price, paid at the end of a home purchase to cover services like lending, title transfer, and taxes. Closing costs:
| $125,550 |
Rehab CostsCosts incurred to repair or improve the property, including: roof, flooring, exterior siding, kitchen, exterior paint, bathrooms, etc. Rehab costs:
| $0 |
Initial Cash InvestedThe total initial cash invested in the property. Calculation:Down payment + Buying costs + Rehab costs Initial cash invested:
| $962,550 |
Square Feet (SQFT)The total square footage of the property. Square feet:
| 4,537 |
Cost Per Square FootCost per square foot of the property. Calculation:Purchase Price / Square Feet Cost per square foot:
| $922 |
Monthly Rent Per Square FootMonthly rent divided by the number of square feet. This ratio helps investors compare rental income efficiency across properties, markets, and unit sizes Calculation:Monthly Rent / Square Feet Monthly rent per square foot:
| $0.95 |
Financing Details
Loan AmountThe total sum of money borrowed from a lender to finance a property purchase. Calculation:Purchase Price - Down Payment
Loan amount:
| $3,348,000 |
|---|---|
Loan to Value Ratio (LTV)Loan amount divided by the market value of the property. Calculation:Loan Amount / Market Value
Loan to value ratio:
| 80.0% |
Loan TypeThe type of loan (e.g., fixed, adjustable).
Loan type:
| Amortizing |
TermThe loan repayment period in years.
Term:
| 30 years |
Interest RateThe percentage a lender charges on the borrowed amount of a loan, determining the cost of borrowing money.
Interest rate:
| 6.625% |
Principal & Interest (PI)The principal is the portion of the loan payment that reduces the loan balance. The interest is the lender's charge for borrowing money. Calculation:(P * r * (1 + r) ** n) / ((1 + r) ** n - 1) Where:
P = Loan amount (principal)
Principal & interest:
| $21,438 |
Property TaxesAnnual taxes levied by local governments on real estate properties. These taxes fund public services like schools, roads, and emergency services.
Property tax:
| $1,329 |
InsuranceThe costs for insurance coverage to protect against financial losses due to risks like fire, natural disasters, theft, liability, or tenant-related damages. Calculation:Assumes 7% of gross rental income, unless insurance rates are specified.
Insurance:
| $301 |
Private Mortgage Insurance (PMI)A fee that borrowers pay when they take out a conventional loan with a loan-to-value (LTV) ratio above 80%.
Private mortgage insurance (PMI):
| $0 |
Monthly PaymentThe fixed amount a borrower pays each month to repay a loan. It typically includes principal and interest (P&I) and may also cover property taxes, insurance, HOA fees, and PMI if escrowed. Monthly payment:
| $23,068 |
Operating Income
| % Rent | Monthly | Yearly | |
|---|---|---|---|
Gross RentThe total rental income received from tenants before deducting any expenses. Includes base rent, late fees, pet fees, parking fees, and other recurring charges.
Gross rent:
| $4,300 | $51,600 | |
Vacancy LossExpected loss of rent due to vacancies.
Vacancy loss:
(6%)
| 6% | -$258 | -$3,096 |
Operating IncomeGross rental income minus vacancy loss. Calculation:Gross rent - Vacancy loss
Operating income:
| $4,042 | $48,504 |
Operating Expenses
| % Rent | Monthly | Yearly | |
|---|---|---|---|
Property TaxesAnnual taxes levied by local governments on real estate properties. These taxes fund public services like schools, roads, and emergency services. | 31% | -$1,329 | -$15,953 |
InsuranceThe costs for insurance coverage to protect against financial losses due to risks like fire, natural disasters, theft, liability, or tenant-related damages. Calculation:Assumes 7% of gross rental income, unless insurance rates are specified. | 7% | -$301 | -$3,612 |
Property ManagementThe costs associated with hiring a property manager to handle the day-to-day operations of a rental property. Includes management fees, leasing fes, eviction fees, etc. Calculation:Assumes 8% of gross rental income. | 8% | -$344 | -$4,128 |
Repairs & MaintenanceOngoing costs for routine upkeep and minor fixes needed to keep a property in good working condition. Calculation:Assumes 5% of gross rental income. Varies by property age and condition. | 5% | -$215 | -$2,580 |
Capital ExpensesLarge, infrequent costs for major improvements or replacements, like a new roof, HVAC system, or appliances. Calculation:Assumes 5% of gross rental income. Varies by property age. | 5% | -$215 | -$2,580 |
HOA FeesRegular dues paid to a Homeowners Association for community maintenance, amenities, and management. Similar fees include: Condo Association Fees, Co-op Maintenance Fees, etc. | n/a | n/a | n/a |
Operating ExpensesRecurring costs required to maintain and manage a rental property, including property taxes, insurance, maintenance, repairs, utilities (if paid by the owner), property management fees, and other day-to-day expenses. Calculation:Insurance + Property Taxes + Property Management + Repairs & Maintenance + Capital Expenditures + HOA Fees | 56% | -$2,404 | -$28,853 |
Cash Flow
| Monthly | Yearly | |
|---|---|---|
Net Operating Income (NOI)The income generated from a property after deducting all operating expenses but before deducting mortgage payments, taxes, and capital expenditures. Calculation:Gross Operating Income - Operating Expenses
Net operating income:
| $1,638 | $19,656 |
Mortgage PaymentThe fixed amount a borrower pays each month to repay a loan. It typically includes principal and interest (P&I) and may also cover property taxes, insurance, HOA fees, and PMI if escrowed. | -$21,438 | -$257,256 |
Cash FlowNet Operating Income (NOI) minus mortgage payments. Calculation:NOI - Mortgage Payments | $19,800 | $237,600 |