

$2,550,000
Investment Summary
- Monthly Cash Flow
- -$7,835
- Cap Rate
- 2.0%
- Cash-on-Cash Return
- -16.0%
- Debt Coverage Ratio
- 0.35
- Internal Rate of Return (5 years)
- -11.5%
Cash Flow
Net Operating Income (NOI) minus mortgage payments.
Calculation:
NOI - Mortgage Payments
Cap Rate (Market Value)
Capitalization Rate is a rate of return that compares the yearly Net Operating Income (NOI) to the market value.
Calculation:
NOI / Market Value
Cash-on-Cash Return (CoC)
Annual Cash Flow / Cash Invested
Calculation:
Annual cash flow divided by initial cash invested.
Debt Coverage Ratio (DCR)
Net Operating Income (NOI) divided by total debt payments.
Calculation:
NOI / Total Debt Payments
Internal Rate of Return (IRR)
A metric for assessing profitability over time. IRR is the discount rate at which the net present value (NPV) of all future cash flows (positive and negative) from an investment equals zero — including both periodic cash flow (such as rent) and a projected sale at the end of the holding period. It represents the expected annualized return, accounting for income, expenses, and the recovery of capital through a future sale.
Property Description
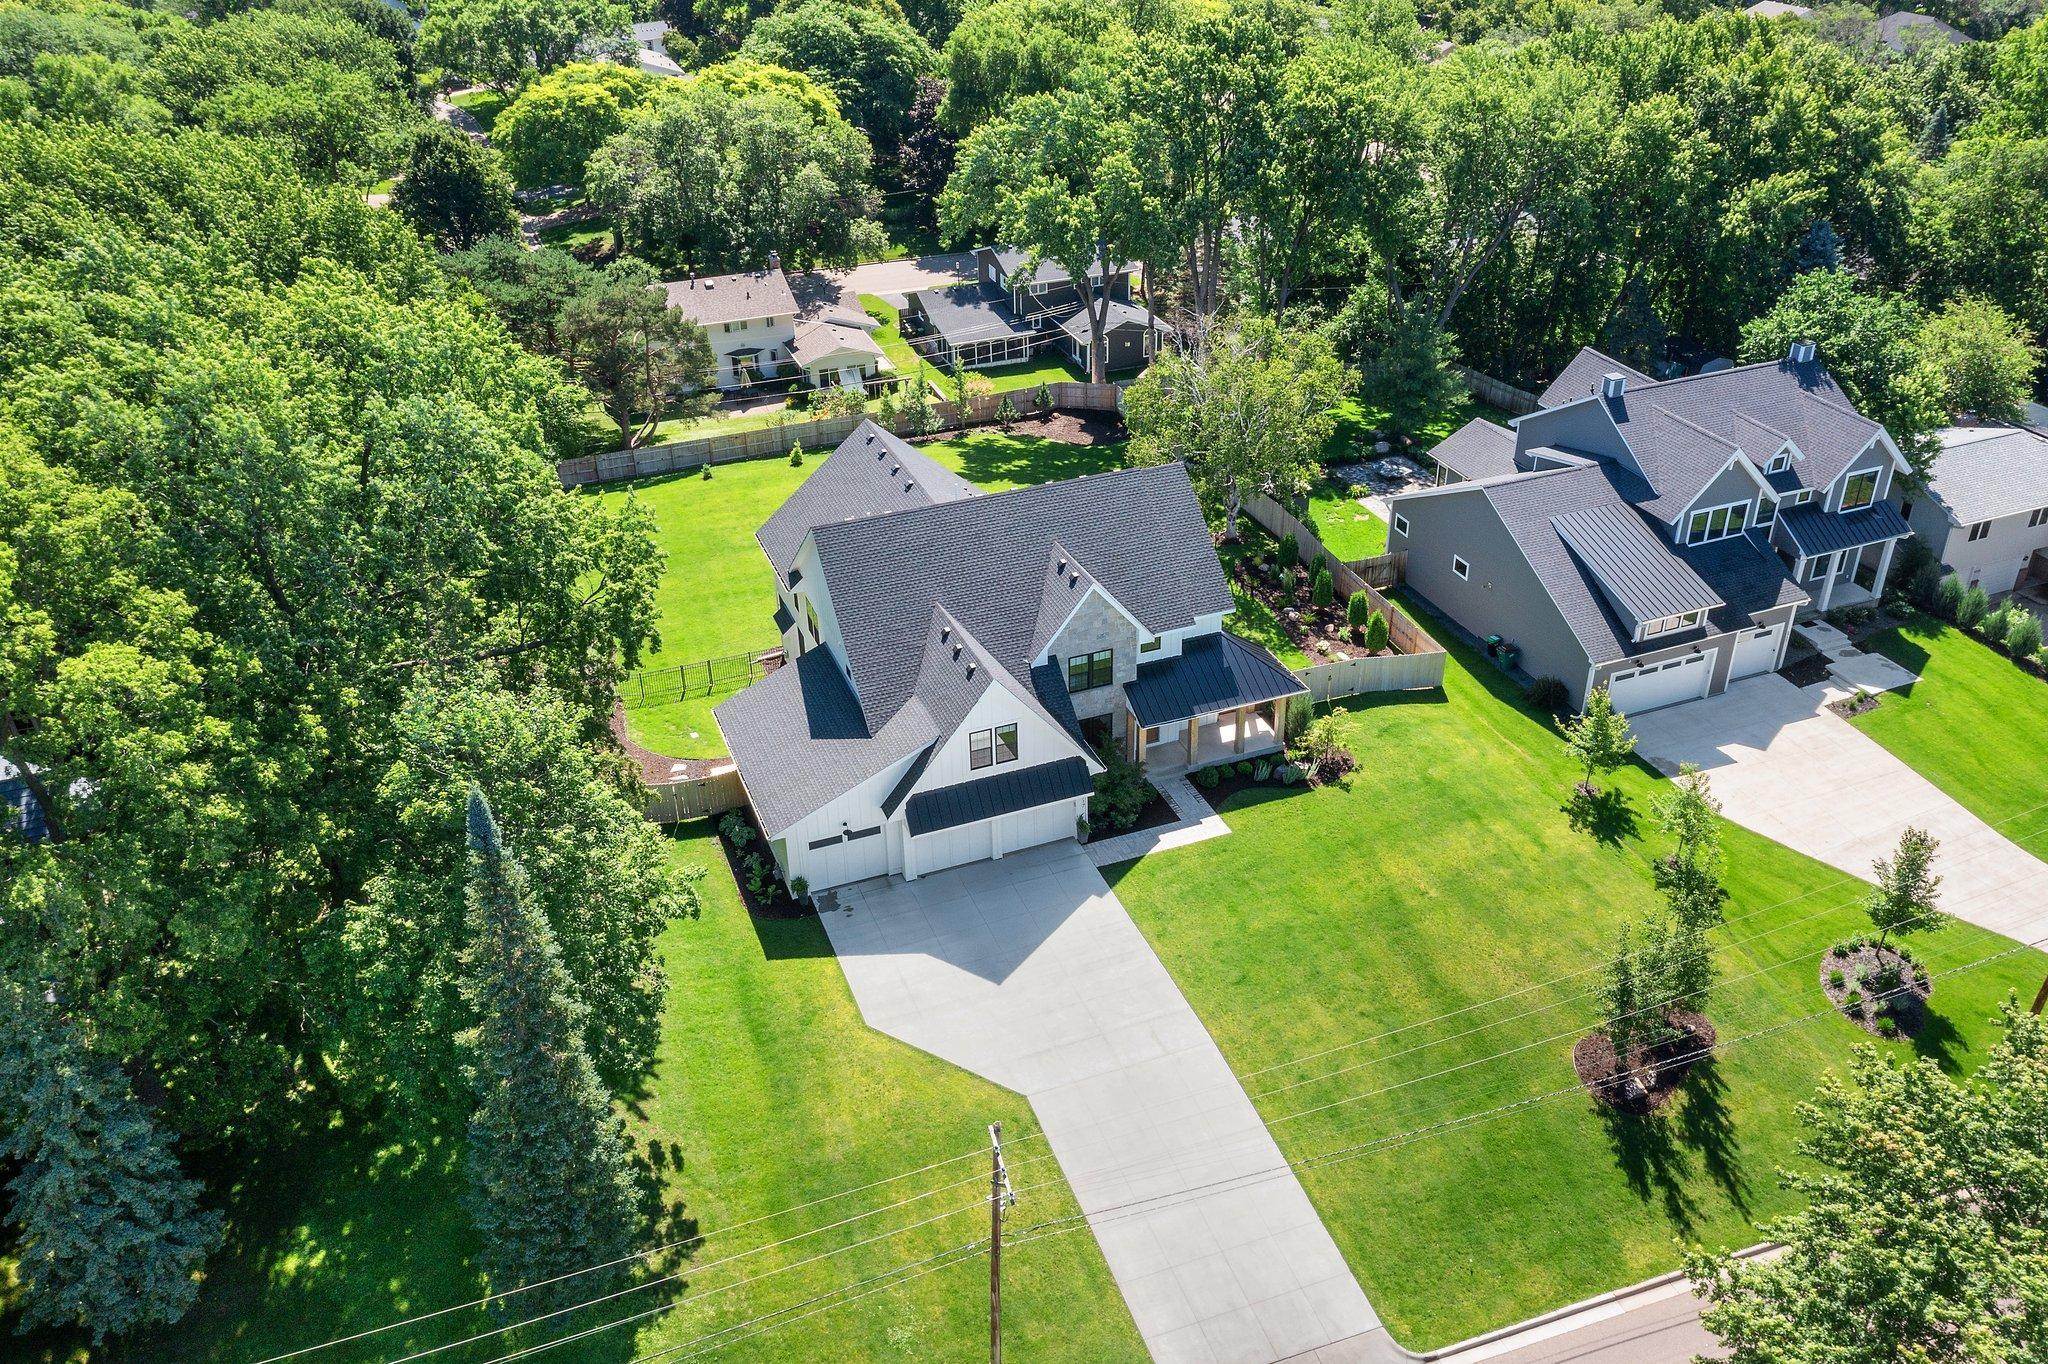
Experience luxury living in this one-of-a-kind custom-built home, perfectly nestled on a beautifully landscaped .64-acre lot in Edina. The meticulously maintained exterior welcomes you with professionally landscaped grounds, an inviting front porch complete with recessed lighting and built-in speakers, the flat backyard features a premium Techo-Bloc paver patio, providing a stylish and durable foundation for outdoor furniture and entertainment. Step inside to a grand entryway featuring soaring ceilings, statement chandeliers, board and batten millwork, and a handcrafted iron staircase. Just off the entry, a private home office with a glass pocket door offers a peaceful and stylish workspace. The gourmet kitchen is outfitted with high-end Thermador appliances—including a 60” gas range with built-in griddle—it also features inset dovetail cabinetry, Brizo fixtures, and a stunning Quartzite leather-finish island. A spacious butler’s pantry adds additional functionality with a Bosch dishwasher, prepping sink, full-size refrigerator, and under-cabinet lighting. The expansive living room stuns with 17-foot vaulted ceilings, rustic wood beams and a dramatic floor-to-ceiling stone fireplace. Designer lighting, including a striking chandelier and soft wall sconces, enhances the room’s warmth and sophistication. The luxurious primary suite offers 11-foot vaulted ceilings, a spa-like en-suite bathroom with a bubble tub, heated towel bar, dual vanities, private water closet, and a custom walk-in closet with built-ins—conveniently connected to the laundry room for everyday ease. Three additional upper-level bedrooms each offer access to en-suite or Jack-and-Jill bathrooms, plush wool carpeting, and abundant storage. The finished lower level is complete with a full bar featuring quartzite countertops, a wine fridge, Bosch dishwasher, full-size refrigerator, and custom shelving. A spacious family room, built-in cabinetry, and guest bedroom with a stylish bath complete the lower level, making it ideal for hosting or extended stays. A beautifully designed three-season porch adds even more living space, with tile flooring, a gas fireplace with brick surround, EZ screens, recessed lighting, and built-in audio. The oversized three-car garage is fully insulated, heated, and finished with epoxy flooring, built-in shelving, floor drain, laundry tub, and even a urinal. Throughout the home, you’ll find custom white oak quarter-sawn cabinetry, soft-close drawers, designer light fixtures from Visual Comfort and Hudson Valley, integrated sound systems, and energy-efficient Pella windows in every room. Ideally located just a short walk from Bredesen Park’s scenic trails and 9 Mile Creek, with convenient access to Highways 62, 169, and 100, this is truly a rare opportunity to own a remarkable home in one of Edina’s most sought-after neighborhoods.
Build Your Team
Quickly find investor-friendly professionals who can help you succeed in real estate investing at any stage of the investing journey.


Agents
Match with investor-friendly agents who can help you find, analyze, and close your next deal


Lenders
Get the best funding…find investor-friendly lenders who specialize in your deal strategy


Property Managers
Transition to passive investing. Find a trusted property management partnership that lasts.


Tax Pros & Accountants
Taxes and financial reporting made easy—find experts to create tax savings strategies, file taxes, and more
Location
Property Details
Parking
- Description: Attached Garage, Concrete, Floor Drain, Finished Garage, Garage Door Opener, Heated Garage, Insulated Garage
- Details: Garage Door Opener, Heated Garage, Garage
- Garage Spaces: 3
- Spaces Total: 0
Bedroom Information
- # of Bedrooms: 5
Bathroom Information
- # of Baths (Full): 2
- # of Baths (Total): 5.0
Interior Features
- # of Rooms: 15
- # of Stories: 2
- Basement: Yes
- Basement Description: Full, Sump Pump, Concrete
- Fireplace: Yes
Exterior Features
- Exterior Walls Materials: Wood
- Roof Type: Gable
Land Information
- Land Use: Residential
- Land Use Subtype: Single Family Residential
Lot Information
- Parcel ID: 3211721240024
- Lot Size: 27878 sqft
Property Information
- Property Type: Single Family Residence
- Style: (SF) Single Family
- Year Built: 2022
Tax Information
- Annual Tax: $30,354
Utilities
- Water & Sewer: Public
- Heating: Forced Air
- Cooling: Central Air
Location
- County: Hennepin
Listing Details
Investment Summary
- Monthly Cash Flow
- -$7,835
- Cap Rate
- 2.0%
- Cash-on-Cash Return
- -16.0%
- Debt Coverage Ratio
- 0.35
- Internal Rate of Return (5 years)
- -11.5%
Cash Flow
Net Operating Income (NOI) minus mortgage payments.
Calculation:
NOI - Mortgage Payments
Cap Rate (Market Value)
Capitalization Rate is a rate of return that compares the yearly Net Operating Income (NOI) to the market value.
Calculation:
NOI / Market Value
Cash-on-Cash Return (CoC)
Annual Cash Flow / Cash Invested
Calculation:
Annual cash flow divided by initial cash invested.
Debt Coverage Ratio (DCR)
Net Operating Income (NOI) divided by total debt payments.
Calculation:
NOI / Total Debt Payments
Internal Rate of Return (IRR)
A metric for assessing profitability over time. IRR is the discount rate at which the net present value (NPV) of all future cash flows (positive and negative) from an investment equals zero — including both periodic cash flow (such as rent) and a projected sale at the end of the holding period. It represents the expected annualized return, accounting for income, expenses, and the recovery of capital through a future sale.
Purchase Details
Purchase PriceThe price paid for the property. Purchase price:
| $2,550,000 |
|---|---|
Amount FinancedThe amount of the purchase financed through a loan. Amount financed:
| -$2,040,000 |
Down paymentThe initial payment made towards the purchase. Down payment:
| $510,000 |
Closing CostsFees and expenses associated with purchasing a property, typically ranging from 2% to 5% of the home’s purchase price, paid at the end of a home purchase to cover services like lending, title transfer, and taxes. Closing costs:
| $76,500 |
Rehab CostsCosts incurred to repair or improve the property, including: roof, flooring, exterior siding, kitchen, exterior paint, bathrooms, etc. Rehab costs:
| $0 |
Initial Cash InvestedThe total initial cash invested in the property. Calculation:Down payment + Buying costs + Rehab costs Initial cash invested:
| $586,500 |
Square Feet (SQFT)The total square footage of the property. Square feet:
| 5,422 |
Cost Per Square FootCost per square foot of the property. Calculation:Purchase Price / Square Feet Cost per square foot:
| $470 |
Monthly Rent Per Square FootMonthly rent divided by the number of square feet. This ratio helps investors compare rental income efficiency across properties, markets, and unit sizes Calculation:Monthly Rent / Square Feet Monthly rent per square foot:
| $1.81 |
Financing Details
Loan AmountThe total sum of money borrowed from a lender to finance a property purchase. Calculation:Purchase Price - Down Payment
Loan amount:
| $2,040,000 |
|---|---|
Loan to Value Ratio (LTV)Loan amount divided by the market value of the property. Calculation:Loan Amount / Market Value
Loan to value ratio:
| 80.0% |
Loan TypeThe type of loan (e.g., fixed, adjustable).
Loan type:
| Amortizing |
TermThe loan repayment period in years.
Term:
| 30 years |
Interest RateThe percentage a lender charges on the borrowed amount of a loan, determining the cost of borrowing money.
Interest rate:
| 5.875% |
Principal & Interest (PI)The principal is the portion of the loan payment that reduces the loan balance. The interest is the lender's charge for borrowing money. Calculation:(P * r * (1 + r) ** n) / ((1 + r) ** n - 1) Where:
P = Loan amount (principal)
Principal & interest:
| $12,067 |
Property TaxesAnnual taxes levied by local governments on real estate properties. These taxes fund public services like schools, roads, and emergency services.
Property tax:
| $2,530 |
InsuranceThe costs for insurance coverage to protect against financial losses due to risks like fire, natural disasters, theft, liability, or tenant-related damages. Calculation:Assumes 7% of gross rental income, unless insurance rates are specified.
Insurance:
| $686 |
Private Mortgage Insurance (PMI)A fee that borrowers pay when they take out a conventional loan with a loan-to-value (LTV) ratio above 80%.
Private mortgage insurance (PMI):
| $0 |
Monthly PaymentThe fixed amount a borrower pays each month to repay a loan. It typically includes principal and interest (P&I) and may also cover property taxes, insurance, HOA fees, and PMI if escrowed. Monthly payment:
| $15,283 |
Operating Income
| % Rent | Monthly | Yearly | |
|---|---|---|---|
Gross RentThe total rental income received from tenants before deducting any expenses. Includes base rent, late fees, pet fees, parking fees, and other recurring charges.
Gross rent:
| $9,800 | $117,600 | |
Vacancy LossExpected loss of rent due to vacancies.
Vacancy loss:
(6%)
| 6% | -$588 | -$7,056 |
Operating IncomeGross rental income minus vacancy loss. Calculation:Gross rent - Vacancy loss
Operating income:
| $9,212 | $110,544 |
Operating Expenses
| % Rent | Monthly | Yearly | |
|---|---|---|---|
Property TaxesAnnual taxes levied by local governments on real estate properties. These taxes fund public services like schools, roads, and emergency services. | 26% | -$2,530 | -$30,354 |
InsuranceThe costs for insurance coverage to protect against financial losses due to risks like fire, natural disasters, theft, liability, or tenant-related damages. Calculation:Assumes 7% of gross rental income, unless insurance rates are specified. | 7% | -$686 | -$8,232 |
Property ManagementThe costs associated with hiring a property manager to handle the day-to-day operations of a rental property. Includes management fees, leasing fes, eviction fees, etc. Calculation:Assumes 8% of gross rental income. | 8% | -$784 | -$9,408 |
Repairs & MaintenanceOngoing costs for routine upkeep and minor fixes needed to keep a property in good working condition. Calculation:Assumes 5% of gross rental income. Varies by property age and condition. | 5% | -$490 | -$5,880 |
Capital ExpensesLarge, infrequent costs for major improvements or replacements, like a new roof, HVAC system, or appliances. Calculation:Assumes 5% of gross rental income. Varies by property age. | 5% | -$490 | -$5,880 |
HOA FeesRegular dues paid to a Homeowners Association for community maintenance, amenities, and management. Similar fees include: Condo Association Fees, Co-op Maintenance Fees, etc. | n/a | n/a | n/a |
Operating ExpensesRecurring costs required to maintain and manage a rental property, including property taxes, insurance, maintenance, repairs, utilities (if paid by the owner), property management fees, and other day-to-day expenses. Calculation:Insurance + Property Taxes + Property Management + Repairs & Maintenance + Capital Expenditures + HOA Fees | 51% | -$4,980 | -$59,754 |
Cash Flow
| Monthly | Yearly | |
|---|---|---|
Net Operating Income (NOI)The income generated from a property after deducting all operating expenses but before deducting mortgage payments, taxes, and capital expenditures. Calculation:Gross Operating Income - Operating Expenses
Net operating income:
| $4,232 | $50,784 |
Mortgage PaymentThe fixed amount a borrower pays each month to repay a loan. It typically includes principal and interest (P&I) and may also cover property taxes, insurance, HOA fees, and PMI if escrowed. | -$12,067 | -$144,804 |
Cash FlowNet Operating Income (NOI) minus mortgage payments. Calculation:NOI - Mortgage Payments | $7,835 | $94,020 |