Hennepin County Investment Properties for Sale
Browse homes for sale and investment properties in Hennepin County. Refine your search by price, property type, or more.
Best cash flowing properties in Hennepin County

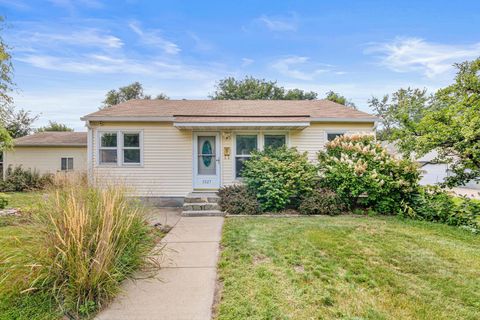
Active
$87,500
3
bds
|
2
ba
|
1,216
sqft
|
built
2020
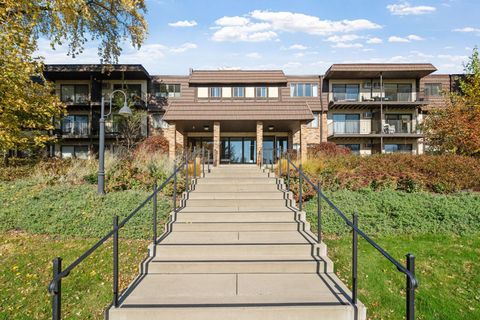
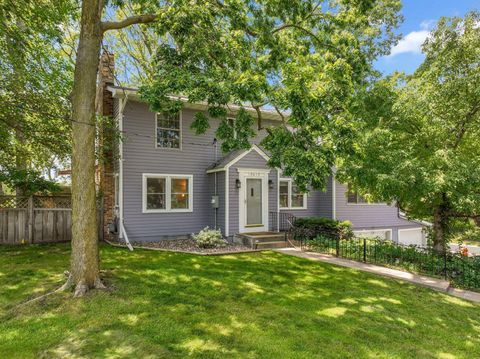
2501 Lowry Ave NE, Saint Anthony, MN 55418
$715
Cash flow
42.6%
Cash-on-Cash Return
15.5%
Cap rate
2.1%
Rent to Value Ratio

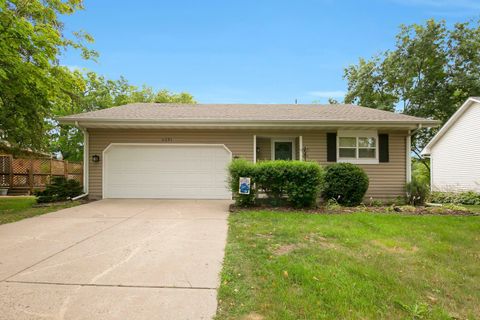
Active
$124,900
1
bds
|
1
ba
|
903
sqft
|
built
1965
4360 Brookside Ct, Edina, MN 55436
$-70
Cash flow
-2.9%
Cash-on-Cash Return
5.0%
Cap rate
1.4%
Rent to Value Ratio
653 out of 1,042 properties for sale in Hennepin County
Limited Results Shown
Create a free account, or log in to reveal all property listings and enjoy the complete experience.

Active
$1,499,900
5
bds
|
5
ba
|
4,001
sqft
|
built
2025
5904 Wooddale Ave, Edina, MN 55424
$-3,405
Cash flow
-11.8%
Cash-on-Cash Return
3.0%
Cap rate
0.4%
Rent to Value Ratio

Active
$425,000
4
bds
|
2
ba
|
2,152
sqft
|
built
1900
2628 Quincy St NE, Minneapolis, MN 55418
$-925
Cash flow
-11.4%
Cash-on-Cash Return
3.1%
Cap rate
0.6%
Rent to Value Ratio

Active
$765,000
3
bds
|
3
ba
|
3,234
sqft
|
built
1993
7810 W 95th St, Bloomington, MN 55438
$-1,953
Cash flow
-13.3%
Cash-on-Cash Return
2.6%
Cap rate
0.5%
Rent to Value Ratio

Active
$250,000
3
bds
|
3
ba
|
1,938
sqft
|
built
2004
7710 Elm Grove Ct, New Hope, MN 55428
$-272
Cash flow
-5.7%
Cash-on-Cash Return
4.4%
Cap rate
1.0%
Rent to Value Ratio

Active
$725,000
4
bds
|
3
ba
|
2,488
sqft
|
built
1960
4909 Trillium Ln, Edina, MN 55435
$-859
Cash flow
-6.2%
Cash-on-Cash Return
4.3%
Cap rate
0.7%
Rent to Value Ratio

Active
$574,900
2
bds
|
2
ba
|
1,936
sqft
|
built
2024
10054 Mulberry Ln, Rogers, MN 55374
$-343
Cash flow
-3.1%
Cash-on-Cash Return
5.0%
Cap rate
0.7%
Rent to Value Ratio

Active
$134,900
2
bds
|
1
ba
|
939
sqft
|
built
1985
2601 Kenzie Ter, Saint Anthony, MN 55418
$-301
Cash flow
-11.6%
Cash-on-Cash Return
3.0%
Cap rate
1.2%
Rent to Value Ratio

Active
$489,000
5
bds
|
4
ba
|
2,806
sqft
|
built
1980
5105 Balsam Ln N, Plymouth, MN 55442
$-510
Cash flow
-5.4%
Cash-on-Cash Return
4.4%
Cap rate
0.7%
Rent to Value Ratio

Active
$599,900
4
bds
|
2
ba
|
2,276
sqft
|
built
1923
4536 Grand Ave S, Minneapolis, MN 55419
$-1,811
Cash flow
-15.8%
Cash-on-Cash Return
2.1%
Cap rate
0.4%
Rent to Value Ratio

Active
$499,900
5
bds
|
2
ba
|
2,708
sqft
|
built
1900
3136 Lyndale Ave S, Minneapolis, MN 55408
$-848
Cash flow
-8.9%
Cash-on-Cash Return
3.6%
Cap rate
0.4%
Rent to Value Ratio

Active
$530,000
4
bds
|
2
ba
|
2,262
sqft
|
built
1980
24800 Wiltsey Ln, Excelsior, MN 55331
$-543
Cash flow
-5.3%
Cash-on-Cash Return
4.4%
Cap rate
0.7%
Rent to Value Ratio
Active
$250,000
1
bds
|
1
ba
|
725
sqft
|
built
1970
205 Barry Ave S, Wayzata, MN 55391
$-457
Cash flow
-9.5%
Cash-on-Cash Return
3.5%
Cap rate
0.8%
Rent to Value Ratio

Active
$145,000
2
bds
|
2
ba
|
1,064
sqft
|
built
2005
5650 Boone Ave N, New Hope, MN 55428
$-494
Cash flow
-17.8%
Cash-on-Cash Return
1.6%
Cap rate
1.4%
Rent to Value Ratio

Active
$259,900
2
bds
|
1
ba
|
1,352
sqft
|
built
1926
521 S 7th St, Minneapolis, MN 55415
$-1,017
Cash flow
-20.4%
Cash-on-Cash Return
1.0%
Cap rate
0.8%
Rent to Value Ratio
Active
$283,900
2
bds
|
2
ba
|
1,197
sqft
|
built
1981
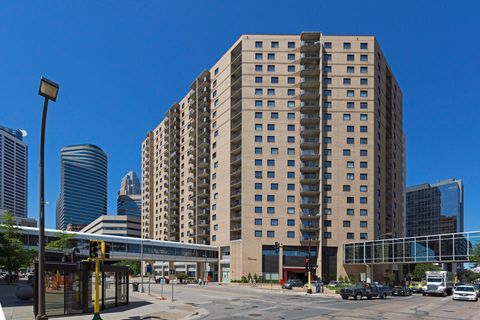
121 Washington Ave S, Minneapolis, MN 55401
$-1,022
Cash flow
-18.8%
Cash-on-Cash Return
1.4%
Cap rate
0.7%
Rent to Value Ratio
Active
$250,000
1
bds
|
2
ba
|
860
sqft
|
built
2006
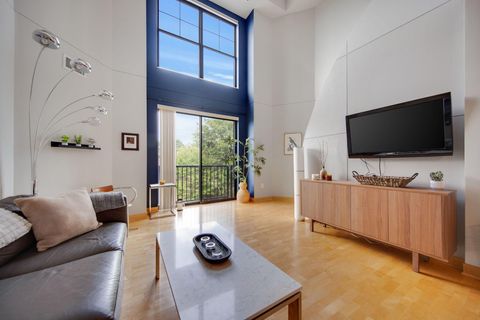
317 Groveland Ave, Minneapolis, MN 55403
$-247
Cash flow
-5.2%
Cash-on-Cash Return
4.5%
Cap rate
1.0%
Rent to Value Ratio
Active
$1,995,000
5
bds
|
4
ba
|
4,297
sqft
|
built
2005
800 Westwood Dr S, Golden Valley, MN 55416
$-7,450
Cash flow
-19.5%
Cash-on-Cash Return
1.2%
Cap rate
0.3%
Rent to Value Ratio
Active
$1,000,000
3
bds
|
3
ba
|
2,350
sqft
|
built
2006
215 10th Ave S, Minneapolis, MN 55415
$-4,947
Cash flow
-25.8%
Cash-on-Cash Return
-0.3%
Cap rate
0.4%
Rent to Value Ratio

Active
$699,000
5
bds
|
4
ba
|
4,048
sqft
|
built
1996
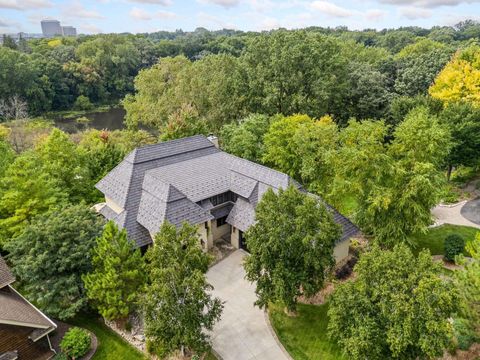
10035 Gristmill Rdg, Eden Prairie, MN 55347
$-1,307
Cash flow
-9.8%
Cash-on-Cash Return
3.4%
Cap rate
0.6%
Rent to Value Ratio
Active
$229,900
1
bds
|
2
ba
|
1,360
sqft
|
built
1975
6105 Lincoln Dr, Edina, MN 55436
$-1,072
Cash flow
-24.3%
Cash-on-Cash Return
0.1%
Cap rate
0.8%
Rent to Value Ratio
Active
$239,900
3
bds
|
1
ba
|
1,513
sqft
|
built
1924
3301 Beard Ave N, Minneapolis, MN 55422
$-113
Cash flow
-2.5%
Cash-on-Cash Return
5.1%
Cap rate
0.8%
Rent to Value Ratio
Active
$330,000
2
bds
|
1
ba
|
986
sqft
|
built
1977
1164 Xene Ln N, Plymouth, MN 55447
$-727
Cash flow
-11.5%
Cash-on-Cash Return
3.0%
Cap rate
0.7%
Rent to Value Ratio
Active
$900,000
5
bds
|
4
ba
|
4,322
sqft
|
built
1994
16035 36th Pl N, Minneapolis, MN 55446
$-2,496
Cash flow
-14.5%
Cash-on-Cash Return
2.4%
Cap rate
0.4%
Rent to Value Ratio
Active
$449,900
4
bds
|
4
ba
|
2,521
sqft
|
built
1954
7204 Harriet Ave, Richfield, MN 55423
$-535
Cash flow
-6.2%
Cash-on-Cash Return
4.3%
Cap rate
0.6%
Rent to Value Ratio
Active
$1,180,000
5
bds
|
4
ba
|
4,900
sqft
|
built
1990
4803 Chantrey Pl, Minnetonka, MN 55345
$-3,063
Cash flow
-13.5%
Cash-on-Cash Return
2.6%
Cap rate
0.4%
Rent to Value Ratio
Active
$800,000
5
bds
|
4
ba
|
4,128
sqft
|
built
2012
3277 Pin Oak Rd, Hamel, MN 55340
$-1,856
Cash flow
-12.1%
Cash-on-Cash Return
2.9%
Cap rate
0.5%
Rent to Value Ratio
Active
$315,000
3
bds
|
1
ba
|
1,490
sqft
|
built
1951
5527 Fremont Ave N, Brooklyn Center, MN 55430
$-366
Cash flow
-6.1%
Cash-on-Cash Return
4.3%
Cap rate
0.6%
Rent to Value Ratio
Active
$449,000
3
bds
|
3
ba
|
2,020
sqft
|
built
1985
6281 Whispering Oaks Dr, Eden Prairie, MN 55346
$-846
Cash flow
-9.8%
Cash-on-Cash Return
3.4%
Cap rate
0.6%
Rent to Value Ratio
Active
$394,500
4
bds
|
4
ba
|
1,892
sqft
|
built
2004
15575 June Grass Ln, Eden Prairie, MN 55347
$-677
Cash flow
-9.0%
Cash-on-Cash Return
3.6%
Cap rate
0.7%
Rent to Value Ratio
Active
$694,900
4
bds
|
3
ba
|
3,594
sqft
|
built
1993
11984 Saint Albans Hollow Dr, Minnetonka, MN 55305
$-1,161
Cash flow
-8.7%
Cash-on-Cash Return
3.7%
Cap rate
0.6%
Rent to Value Ratio
Active
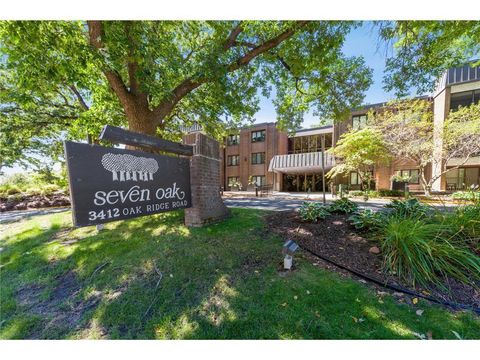
$243,000
2
bds
|
2
ba
|
1,463
sqft
|
built
1971
3412 Oak Ridge Rd, Minnetonka, MN 55305
$-919
Cash flow
-19.7%
Cash-on-Cash Return
1.1%
Cap rate
0.8%
Rent to Value Ratio
Active
$435,000
6
bds
|
2
ba
|
2,484
sqft
|
built
1900
823 20th Ave NE, Minneapolis, MN 55418
$-1,175
Cash flow
-14.1%
Cash-on-Cash Return
2.4%
Cap rate
0.5%
Rent to Value Ratio
Active
$295,000
2
bds
|
2
ba
|
1,283
sqft
|
built
2005
514 W 84th St, Bloomington, MN 55420
$-550
Cash flow
-9.7%
Cash-on-Cash Return
3.4%
Cap rate
0.7%
Rent to Value Ratio
Active
$719,999
3
bds
|
3
ba
|
3,100
sqft
|
built
1986
15904 Dawn Dr, Minnetonka, MN 55345
$-1,674
Cash flow
-12.1%
Cash-on-Cash Return
2.9%
Cap rate
0.5%
Rent to Value Ratio
Active
$429,900
4
bds
|
3
ba
|
2,148
sqft
|
built
1951
10610 Humboldt Ave S, Bloomington, MN 55431
$-299
Cash flow
-3.6%
Cash-on-Cash Return
4.8%
Cap rate
0.7%
Rent to Value Ratio
Active
$299,900
3
bds
|
2
ba
|
1,623
sqft
|
built
1980
4219 Hemlock Ln N, Plymouth, MN 55441
$-285
Cash flow
-5.0%
Cash-on-Cash Return
4.5%
Cap rate
0.8%
Rent to Value Ratio
Active
$359,900
2
bds
|
3
ba
|
1,862
sqft
|
built
1997
2062 Mainstreet, Hopkins, MN 55343
$-601
Cash flow
-8.7%
Cash-on-Cash Return
3.7%
Cap rate
0.8%
Rent to Value Ratio
Active
$349,900
5
bds
|
2
ba
|
2,585
sqft
|
built
1959
6931 Toledo Ave N, Brooklyn Center, MN 55429
$-251
Cash flow
-3.7%
Cash-on-Cash Return
4.8%
Cap rate
0.8%
Rent to Value Ratio